Angle Regression Line MT4
- Indikatoren
- Version: 1.40
- Aktualisiert: 31 Mai 2017
- Aktivierungen: 10

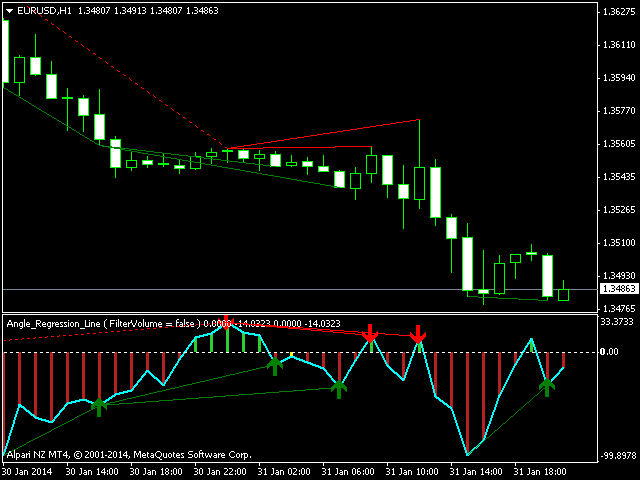
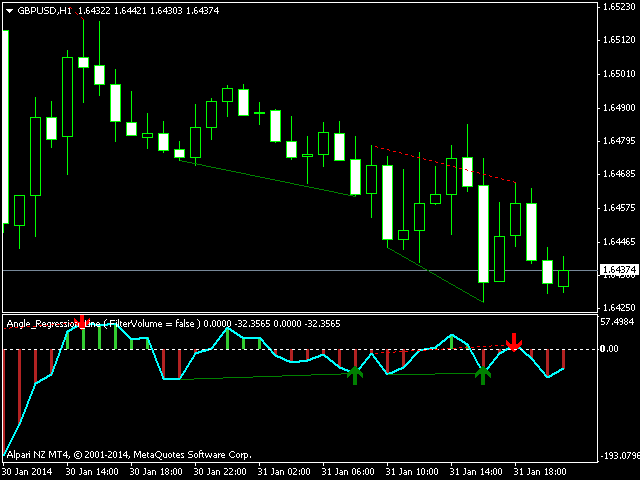
Der Indikator ermöglicht eine genaue Bestimmung der Stärke und Richtung des Trends. Das in einem separaten Fenster angezeigte Histogramm zeigt die Veränderungen der Steigung der Regressionslinie an. Ein Signal für den Einstieg in ein Geschäft ist das Überschreiten der Nulllinie und/oder eine Divergenz. Der Indikator ist auch für die Wellenanalyse nützlich.
Eingabeparameter:
- Periode - Periode der Berechnung, standardmäßig 10;
- Winkelschwelle - Steigung, bei der ein Flat angezeigt wird, standardmäßig 6,0 (im Bereich von -6,0 bis 6,0);
- Filter nach Volumen - Volumenfilter (Divergenzsignale werden nicht geliefert, wenn das Volumen unter dem Durchschnitt der letzten 50 Bars liegt), standardmäßig true;
- Divergenzwarnung anzeigen - aktiviert Benachrichtigungen über Divergenzen, standardmäßig true;
- Pfeilverschiebung - Verschiebung des Arrays des Divergenzsignals, Standardwert ist 5.0;
- Alarm bei Nulldurchgang anzeigen - aktiviert den Alarm bei Nulldurchgang, standardmäßig wahr;
- Indikator-Trendlinien zeichnen - aktiviert Indikator-Trendlinien in Divergenz; standardmäßig wahr;
- Preistrendlinien zeichnen - aktiviert die Anzeige der Trendlinien auf dem Preisdiagramm während der Divergenz; Standardeinstellung: wahr;
- Farbe der Bullen-Divergenzlinie - Farbe der Linie bei bullischer Divergenz, standardmäßig grün;
- Farbe der Bären-Divergenz-Linie - Farbe der Linie bei einer bärischen Divergenz, standardmäßig rot.
Währungspaar - beliebig. Zeitrahmen - beliebig.


I like this Indicator and use it since quite some time.