Angle DeMarker MT5
- Indikatoren
- Version: 1.10
- Aktualisiert: 18 November 2021
- Aktivierungen: 10

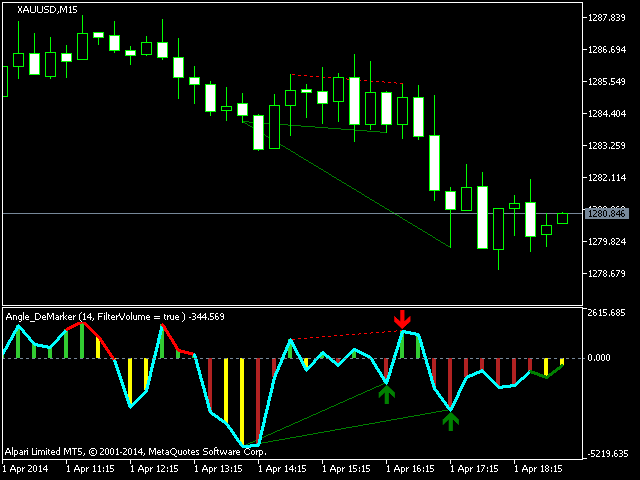
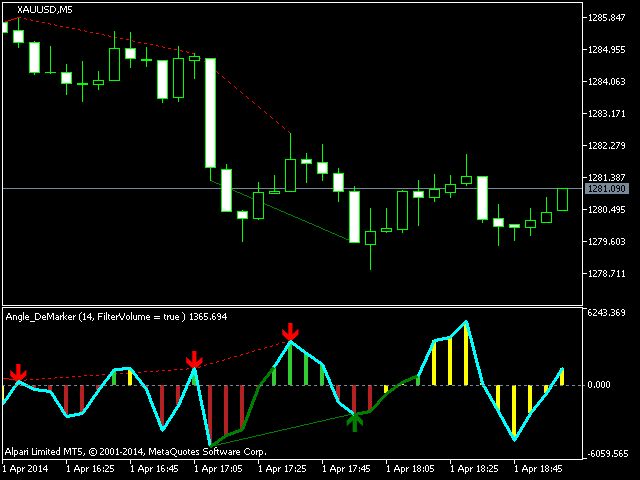
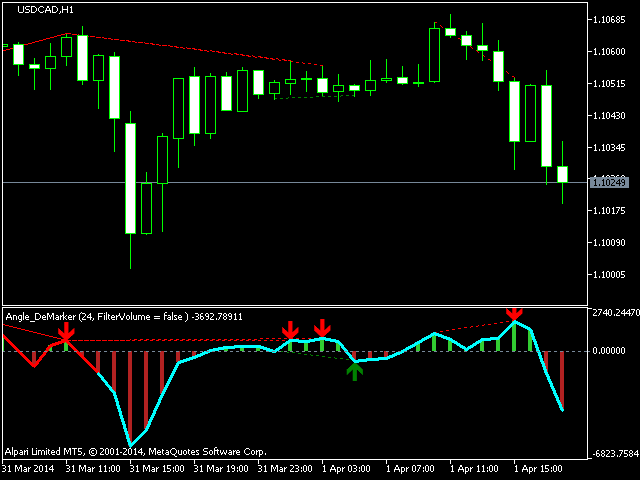
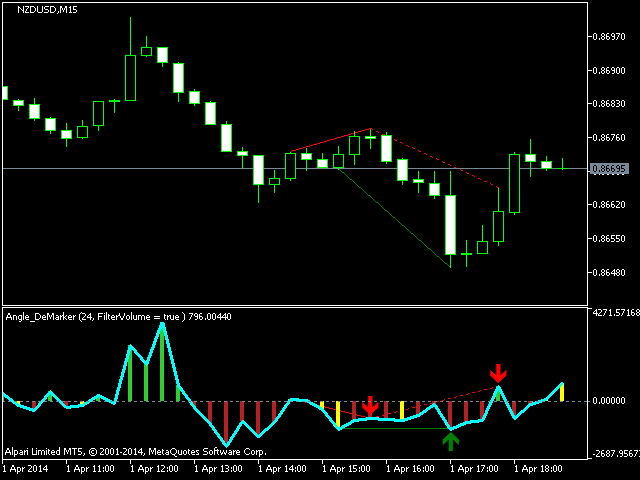
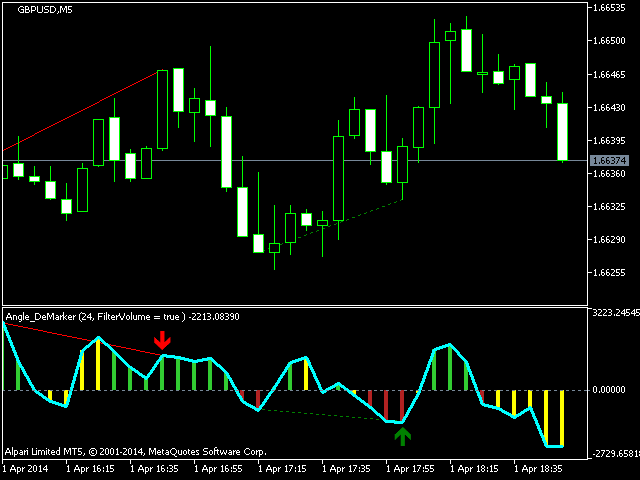
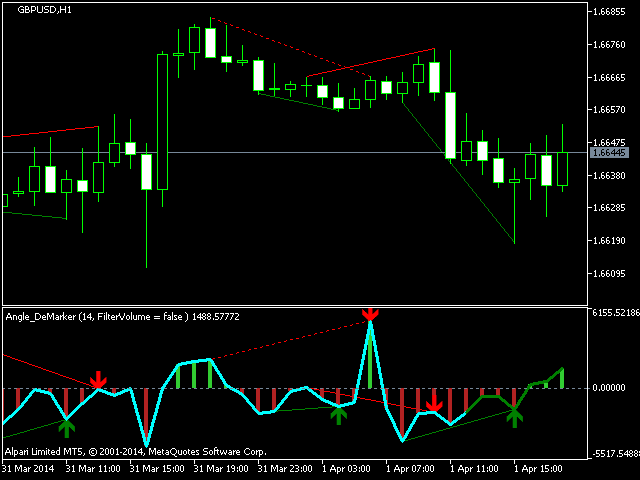
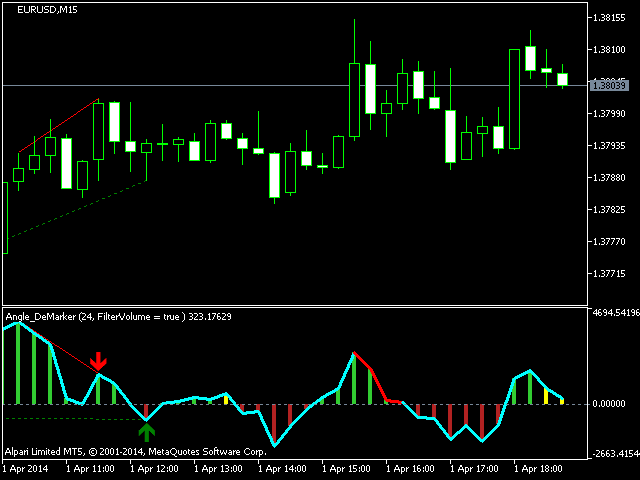
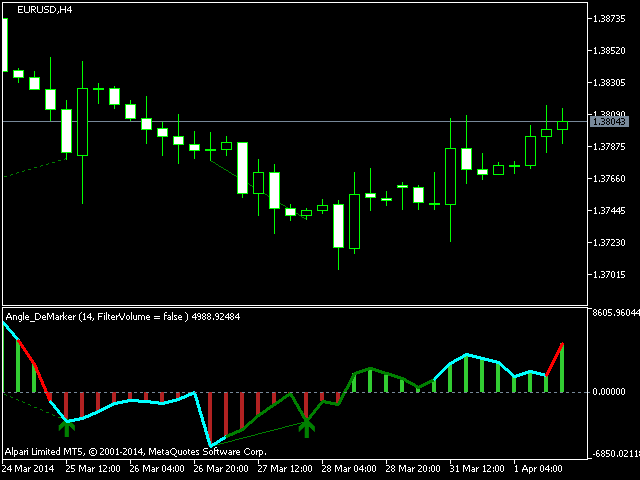
Der Indikator zeigt den Winkel der DeMarker-Indikatorlinie an, wodurch Sie mögliche Preisextrema genauer identifizieren können. Farbe und Größe des Histogrammbalkens zeigen die Richtung und den Winkel der DeMarker-Linie an. Wenn die Kontrolle des Handelsvolumens aktiviert ist, zeigt ein gelber Balken an, dass das Volumen niedriger ist als der Durchschnitt der letzten 50 Balken. Die Farbe der Hauptindikatorlinie zeigt an, ob der Preis ein überkauftes/überverkauftes Niveau in Übereinstimmung mit den DeMarker-Indikatorwerten erreicht hat. Es gibt drei Arten von Signalen: Kreuzung der Nulllinie, Farbwechsel der Hauptlinie und Divergenz.
Eingabeparameter:
- Zeitraum - Berechnungszeitraum, standardmäßig 14;
- Smooth - Glättung, standardmäßig 4;
- CalculatedBar - Anzahl der Balken für die Anzeige der Divergenz, standardmäßig 300;
- Filter nach Volumen - Filter nach Volumen, standardmäßig Auto (automatisch aktiviert bei Zeitrahmen kleiner als Н1);
- Level DeMarker buy - überverkauftes Niveau gemäß den Werten des DeMarker-Indikators, standardmäßig 0,3;
- Level DeMarker sell - überkauftes Niveau gemäß den Werten des DeMarker-Indikators, standardmäßig 0,7;
- Divergenzwarnung anzeigen - aktiviert die Divergenzwarnung, standardmäßig true;
- Kreuzungsalarm anzeigen - aktiviert den Kreuzungsalarm der Nulllinie, standardmäßig true;
- Indikator-Trendlinien zeichnen - aktiviert Indikator-Trendlinien in Divergenz, standardmäßig true;
- Preistrendlinien zeichnen - aktiviert Trendlinien auf dem Preisdiagramm in Divergenz, standardmäßig wahr;
- Farbe der Linie Bullen-Divergenz - Farbe der Trendlinie bei bullischer Divergenz, standardmäßig grün;
- Farbe der Linie bei Baisse-Divergenz - Farbe der Trendlinie bei Baisse-Divergenz, standardmäßig Rot.
Währungspaar - beliebig. Zeitrahmen - beliebig. Der empfohlene Berechnungszeitraum für М15 und niedrigere Zeitrahmen ist 24.


Der Benutzer hat keinen Kommentar hinterlassen