White Light POC
- Indikatoren
-
Ricardo Almeida Branco
 Ich habe 2018 begonnen, der brasilianischen Börse in einem Demo-Konto zu folgen, und fand die Anzahl der verwendeten Setups interessant. Ich nahm das Lernen und sogar die Demo ernst und verstand, dass ich mit der Programmierung beginnen sollte, um Setups zu validieren / zu verwerfen.
 - Version: 1.0
- Aktivierungen: 5
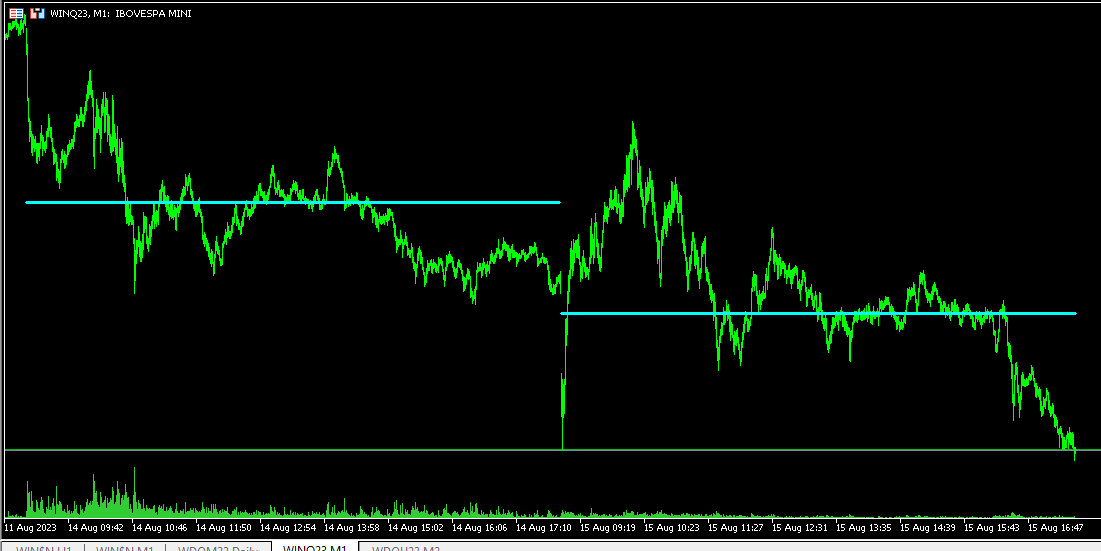
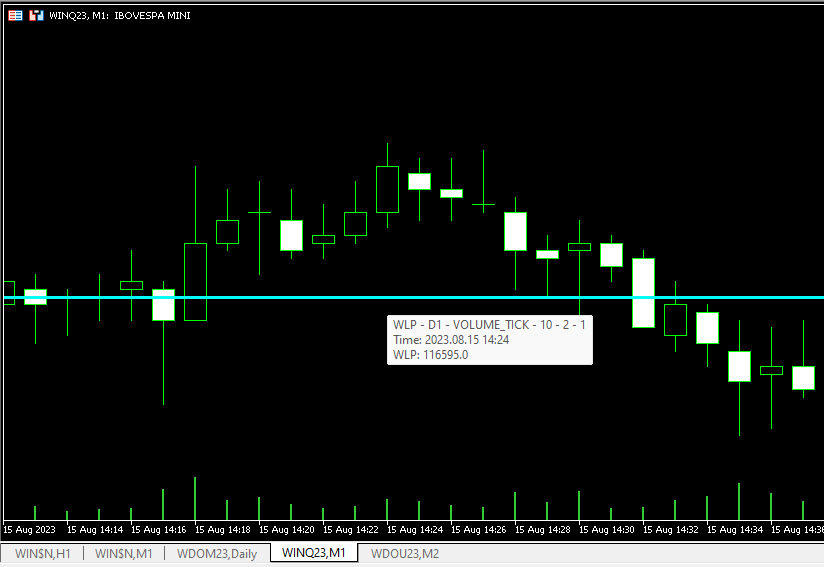
Weißes Licht POC (WLP)
Erleben Sie Präzision in der Handelsanalyse mit White Light POC (WLP), einem sorgfältig entwickelten, leistungsstarken Tool für Händler, die genaue Point of Control (POC)-Berechnungen wünschen. Dieser fortschrittliche Indikator wurde mit dem Fokus auf Effizienz und Anpassungsfähigkeit entwickelt und gewährleistet eine nahtlose Integration in Expert Advisors oder andere Indikatoren durch eine praktische Copybuffer-Schnittstelle.
Merkmale:
-
Leichtgewichtige Effizienz: White Light POC (WLP) bietet eine schlanke Lösung, die POC-Berechnungen bei minimalem Ressourcenverbrauch ermöglicht. Sein leichtes Design sorgt für eine schnelle Verarbeitung, ohne die Genauigkeit zu beeinträchtigen.
-
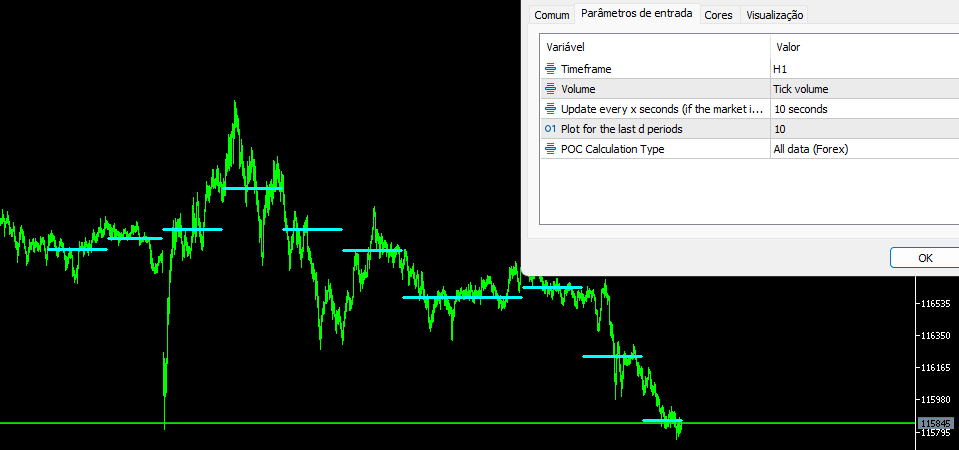
Anpassbare Parameter: Passen Sie Ihre Analyse an Ihren Handelsstil an. WLP bietet Ihnen eine Reihe von anpassbaren Parametern, einschließlich der Auswahl verschiedener Zeitrahmen, des Volumentyps (Real oder Ticks), des Aktualisierungsintervalls (Datenaktualisierungsfrequenz), der Anzahl der Kerzen für die Darstellung historischer Daten und der Wahl des POC-Berechnungstyps (alle Daten oder handelsspezifische Daten).
-
Nahtlose Integration: Ob Sie nun ein algorithmischer Händler oder ein Liebhaber der technischen Analyse sind, WLP lässt sich nahtlos in Ihr Handelsarsenal integrieren. Er kann problemlos innerhalb von Expert Advisors verwendet oder über einen Copybuffer in andere Indikatoren integriert werden, um Ihre Handelsstrategien zu verbessern.
-
Präzise POC-Berechnung: White Light POC verwendet proprietäre Algorithmen, um genaue Point-of-Control-Berechnungen durchzuführen. Dieser Marktprofilindikator hilft bei der Identifizierung von Kursniveaus, auf denen sich die Handelsaktivität konzentriert, und unterstützt Sie dabei, fundierte Handelsentscheidungen zu treffen.
-
Aktualisierungen in Echtzeit: Mit Echtzeit-Updates sind Sie dem Markt immer einen Schritt voraus. WLP ermöglicht es Ihnen, aktualisierte Daten in bestimmten Intervallen zu erhalten, so dass Sie immer die neuesten Informationen zur Hand haben.
-
Flexible grafische Darstellung: Zeichnen Sie historische Daten über eine bestimmte Anzahl von Kerzen auf und erhalten Sie so einen umfassenden Überblick über die Entwicklung der POC-Levels im Laufe der Zeit. Anhand dieses historischen Kontextes können Sie Ihre Handelsstrategien ausrichten.
-
Handelsspezifische Einblicke: Sie haben die Wahl zwischen der Analyse aller verfügbaren Daten oder der ausschließlichen Konzentration auf handelsspezifische Daten. Dank dieser Flexibilität können Sie Ihre Analyse auf verschiedene Handelsszenarien abstimmen.
Erweitern Sie Ihr Handelserlebnis mit White Light POC (WLP) und nutzen Sie die Möglichkeiten präziser Point-of-Control-Berechnungen. Stärken Sie Ihre Handelsentscheidungen mit diesem unverzichtbaren Tool, das Genauigkeit, Anpassungsfähigkeit und Effizienz vereint.
Entdecken Sie auch andere Produkte von White Trader Indicators!