Neue Handelsroboter und Indikatoren für den MetaTrader 4 - 281
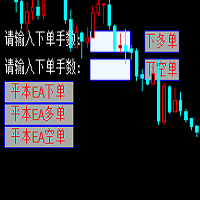
Dieser EA basiert auf der Beziehung zwischen den drei Währungen, Interaktion, und damit die Absicherung, finde ich jetzt die ideale Paar von Währungen ist der Standard-Parameter der drei Paare von Währungen, Zu den Parametern
Parameter-Einstellung ist sehr einfach, "Huoli" ist profitabel n USD. Benutzer können die Anzahl der Aufträge nach den Mitteln des Kontos zu bestimmen.

Der MACD Standard/Hidden Divergence-Indikator stellt den MACD dar und identifiziert und zeichnet auch Standard-Divergenzen (reguläre Divergenzen) zwischen dem Indikator und dem Kursverlauf, ODER er kann so eingestellt werden, dass er versteckte Divergenzen (umgekehrte Divergenzen) zwischen dem Indikator und dem Kursverlauf identifiziert und zeichnet. Die Divergenzen selbst werden als Linien (standardmäßig grün für bullische Divergenzen und rot für bärische Divergenzen) im Indikatorfenster darges

Der RSI-Indikator Standard/verdeckte Divergenz stellt den Relative Strength Index (RSI) dar und identifiziert und zeichnet auch Standard-Divergenzen (reguläre Divergenzen) zwischen dem Indikator und dem Kursverlauf, oder er kann so eingestellt werden, dass er verdeckte Divergenzen (umgekehrte Divergenzen) zwischen dem Indikator und dem Kursverlauf identifiziert und zeichnet. Die Divergenzen selbst werden als Linien (standardmäßig grün für bullische Divergenzen und rot für bärische Divergenzen) i

Der Momentum Standard/Hidden Divergence-Indikator stellt das Momentum dar und identifiziert und zeichnet auch Standard-Divergenzen (reguläre Divergenzen) zwischen dem Indikator und dem Kursverlauf, ODER er kann so eingestellt werden, dass er versteckte Divergenzen (umgekehrte Divergenzen) zwischen dem Indikator und dem Kursverlauf identifiziert und zeichnet. Die Divergenzen selbst werden als Linien (standardmäßig grün für bullische Divergenzen und rot für bärische Divergenzen) im Indikatorfenste

Der Stochastik-Indikator Standard/versteckte Divergenz stellt die Stochastik (%K und %D) dar und identifiziert und stellt auch Standard-Divergenzen (reguläre Divergenzen) zwischen dem Indikator und der Preisaktion dar, ODER er kann so eingestellt werden, dass er versteckte Divergenzen (umgekehrte Divergenzen) zwischen dem Indikator und der Preisaktion identifiziert und darstellt. Die Divergenzen selbst werden als Linien (standardmäßig grün für bullische Divergenzen und rot für bärische Divergenz

Die ultimative Lösung für das Preisaktionshandelssystem in einem einzigen Tool! Unser intelligentes Algorithmus-Tool erkennt das Preisaktionsmuster und warnt vor potenziellen Einstiegs- und Ausstiegssignalen, einschließlich Stoploss- und Takeprofit-Levels, basierend auf der Zeiteinstellung jeder Marktsitzung. Dieses Tool filtert auch die Stärke der Marktwährung heraus, um sicherzustellen, dass unser Einstieg in einer guten Währungssituation erfolgt, die auf dem Trend basiert.
Sie erhalten folg
CSV Trader liest CSV-Dateien und führt die darin geschriebenen Aufträge aus. Wenn Sie brauchen, um Aufträge an mt4 mit verschiedenen Plattformen oder Software, die Sie leicht einstellen können, um ihre Aufträge zu CSV-Datei zu schreiben und dann verwenden Sie diese EA, um sie in MT4 ausführen. Viele Male habe ich in der Freelance-Sektion gelesen, dass Leute einen CSV-Trade Executor brauchen und jetzt habe ich einen generischen EA programmiert, der alle Ihre Bedürfnisse erfüllt. Beachten Sie: Wen

Dieser Indikator zeigt die Super Power Beeta Trendbewegung an, der Indikator ist Version 2. Eigenschaften Vervielfacher - zeigt die Bewegung des Multiplikators an. Multiplikator2 - zeigt zeigt die Bewegung des Multiplikators2 an. Trend - zeigt zeigt den Indikator Trend 1 und Trend 2 (wahr/falsch).
Hintergrund:Farbe - zeigt die Hintergrundfarbe an (wahr/falsch).
separates_Fenster - zeigt den Trend in einem separaten Fenster an.(0-1....) getrenntes_Fenster2 - zeigt den Trend (Hintergrundfarbe) i

Lasst uns versuchen, richtiges Geld zu verdienen!
Nennt mich gewinnsüchtig. Ich dachte, warum nicht versuchen, DEN Traum Wirklichkeit werden zu lassen. Mit Disziplin, einer klaren Strategie und diesem Indikator konzentriere ich mich darauf, die perfekten Trades einzugehen. Dieser Indikator ist sehr einfach zu bedienen, da Sie perfekte Einstiegspunkte für Put- oder Call-Trades erhalten.
Die Pfeile werden mit berechnet: - Momentum-Parameter - Candle-Stick-Muster - Fundamentale Preisbewegung
Wi
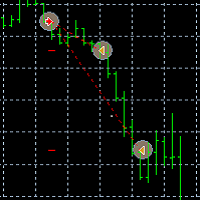
TaiChi4 Tai Chi4EA Tai Chi2EA ist nach MACD-Indikatorabweichung ein trendorientierter EA。 geschrieben. Broker: ECN-Broker, niedrige Kommunikation / Kommission, 1:400 Hebelwirkung, nicht FIFO oder FIFO. Wenn Sie in verschiedenen Währungspaaren laufen wollen, ändern Sie bitte die Parameter BM und SM。. Bitte verwenden Sie die Standardparameter. Als die sachkundigste Person der Welt habe ich die Parameter auf die optimalen Parameter eingestellt, die Benutzer direkt verwenden können, ohne Änderung.

SAFE FUND EA ist ein sorgfältig entwickelter Expert Advisor für langfristige Trader wie Hedgefonds, Banken und Finanzinstitute. Er handelt sicher und versucht nicht, außergewöhnliche Gewinne zu erzielen.
Er handelt nicht oft, es sei denn, seine strengen Marktbedingungen werden erfüllt. Er verwendet KEINE gefährlichen Handelsstrategien wie Martingale, Grid oder Hedging.
Der EA bewertet den Markt und sucht nach sicheren Einstiegs- und Ausstiegspunkten, um den Drawdown niedrig und die Gewinne hoc

Erweiterte VERSION
Die ultimative Lösung für das Preisaktionshandelssystem in einem einzigen Tool! Unser intelligenter Algorithmus erkennt das Preisaktionsmuster und warnt vor potenziellen Einstiegssignalen und Ausstiegsniveaus, einschließlich Stoploss- und Takeprofit-Niveaus, die auf einer dynamischen und einzigartigen Berechnung basieren. Dieses Tool filtert auch die Stärke der Marktwährung heraus, um sicherzustellen, dass unser Einstieg in einer guten Währungssituation erfolgt, basierend au
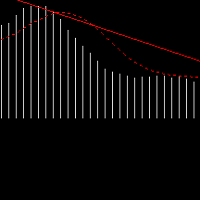
Tai Chi6EA Zeitrahmen: M30 ,H1. Tai Chi6 basiert auf der vorherigen TaiChi Serie von EA, gepaart mit der Theorie des Martingale, entsprechende Anpassungen an der Reihenfolge, die grundlegende Theorie ist immer noch der MACD-Indikator der Divergenz, löschen Sie einige der richtigen Rate des Signals ist nicht hoch, und letztlich in eine aktualisierte Version des TaiChi kompiliert. Zuvor gekauft Tai Chi (1 --- 5) Freunde können mehr bewusst sein, dieser EA, wo ich nicht tun, zu viel Erklärung, in d
------------------------------------ | LIVE-KONTO | ------------------------------------ Live-Konto bei mql5.
https://www.mql5.com/en/signals/457344
------------------------------------ | Anregung | ------------------------------------ Jede $30 mit 0,01 Lot.
Z.B. $90 Handel mit 0.03 Lot.
Zeitrahmen: m5
Vorgeschlagenes Paar: Eurusd (ich konzentriere mich nur auf EU-Paar)
Ein Paar bereits gut profitieren, überprüfen Sie bitte mql5 Ergebnis VPS: Zeitzone UTC 00:00
------------------------------
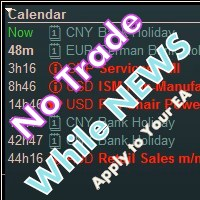
Bibliothek für einen Expert Advisor. Er prüft den Nachrichtenkalender und unterbricht den Handel für ein bestimmtes Paar, wenn wichtige Nachrichten eintreffen.
Nachrichtenfilter für einen Exert Advisor. Einfach auf Ihren EA anzuwenden, Sie brauchen nur einfache Skripte, um ihn von Ihrem EA aus aufzurufen. Benötigen Sie Ihren EA (Expert Advisor), um kommende High Impact News zu erkennen ? Brauchen Sie Ihren EA, um den Handel mit dem entsprechenden Währungspaar zu pausieren, bevor wichtige Nachri

Wir stellen den Entry Point vor, einen leistungsstarken technischen Indikator, der Kauf-/Verkaufsbenachrichtigungen liefert. Dieser Indikator analysiert 5 gleitende Durchschnitte, CCI, RSI, Stochastic, Bill Williams und Volumenindikatoren über 3 verschiedene Zeitrahmen, um genaue Signale zu generieren. Es bietet unbegrenzte Anpassungsmöglichkeiten für professionelle Händler, sodass sie den Indikator basierend auf ihrer Erfahrung und ihren Strategien anpassen können. Der Einstiegspunkt sendet

PriceRunner-Indikator zur Trenderkennung ohne die Auswirkungen versehentlicher Preissprünge. Es verwendet Preisreihen und einige gleitende Durchschnitte zur Rauschunterdrückung. Es funktioniert in mehreren Zeitrahmen, sogar M1. Um die Effektivität zu erhöhen, wird empfohlen, Standardparameter für die M1-Grafik zu verwenden (siehe Screenshots). Sie können die Einstellungen für andere Zeitrahmen ändern. Beispiel für die Verwendung dieses Indikators: Wenn Gold nach unten zu Blau und sowohl Gold al

Indikatorloser Grid Expert Advisor. Wie Sie wissen, kann sich der Preis nicht ständig in diese Richtung bewegen, der EA überwacht kurzfristige Trends und legt die Level für Eröffnungsaufträge in einem Abstand zum Schlusskurs des vorherigen Balkens fest. Basierend auf einer Vorlage mit einem fortschrittlichen Rasteralgorithmus und Schutz vor erhöhter Volatilität bei Pressemitteilungen. Wendet dynamische Level für das Setzen neuer Orders, Stop Loss, Take Profit und Trailing Stop an, die für den B

Virtual Scalper - the most safe for your deposit the automated adviser. Not martingale. EA uses unique innovative algorithm of an input in the transaction, based on the virtual pending orders. EA is adapted on trade on high-volatile market and economic news. Thus EA is not included into the transaction at raised spread. Minimum deposit for trade 100$ For trade the broker with low spread (from 0 - to 10 on a 5-sign) is used ECN. Pairs GBPUSD, EURUSD, USDJPY. Timeframe M1 - M5. Parametrs: Stoplos

Übersicht
Der Expert Advisor ermöglicht es Ihnen, Benachrichtigungen auf dem Mobiltelefon (oder Tablet-PC), der Mailbox zu empfangen oder einen akustischen Alarm abzuspielen, wenn bestimmte Ereignisse eintreten: Eröffnung oder Schließung einer Position, Platzierung oder Löschung einer schwebenden Order, Änderung des Eröffnungskurses, Stop-Loss oder Take-Profit, Erreichen des Kontostandes, des Eigenkapitals, des Margenniveaus, der freien Marge oder des Drawdowns auf einem vom Benutzer festgelegte

Channels + S & R Indikator (CSRI)
Der Indikator zeichnet 3 Kanäle (groß, mittel, klein) innerhalb des Bereichs der Balken des aktuellen Zeitrahmens und des Paares/Instruments. Er kann Unterstützungs- und Widerstandsniveaus innerhalb jedes gewählten Kanals identifizieren. Zusätzlich können Fibonacci-Levels für den großen Kanal eingezeichnet werden. Alle Linien und Niveaus können durch Farbe und Breite angepasst werden.
Identifizieren Sie Unterstützungs- und Widerstandsniveaus für einen beliebige

Dieser Indikator zeigt die verbleibende Zeit bis zum Schließen der Kerze an, auch wenn sich der Preis nicht ändert, zählt die Uhr weiter rückwärts. Sie können auch Preiswarnstufen mit Trendlinien programmieren.
Der Indikator kann zusammen mit Expert Advisors und anderen Panels, wie z.B. Controller ohne Limit , verwendet werden.
MT5-Version
Anleitung Um ein Preisalarmniveau festzulegen, müssen Sie eine Trendlinie zeichnen. Sobald das Objekt gezeichnet ist, muss es benannt werden, damit der Ind

Der Nutzen bezieht sich auf probabilistische Analysewerkzeuge, insbesondere auf die Monte-Carlo-Methode. Die Monte-Carlo-Methode ist definiert als die Simulation von Prozessen mit dem Ziel, ihre probabilistischen Eigenschaften zu bewerten und sie auf die zu lösende Aufgabe anzuwenden.
Merkmale des Verfahrens Die Simulation verwendet ein Tick-Modell mit anschließender Transformation in die Kerzenform, als ein Modell, das dem realen Marktprozess so nahe wie möglich kommt. Das Programm generiert e

Smart Reversal Signal ist ein professioneller Indikator für die MetaTrader 4 Plattform, der von einer Gruppe professioneller Trader entwickelt wurde. Dieser Indikator ist für den Handel mit Forex und binären Optionen konzipiert. Wenn Sie diesen Indikator kaufen, erhalten Sie: Ausgezeichnete Indikator-Signale. Kostenlose Produktunterstützung. Regelmäßige Aktualisierungen. Verschiedene Benachrichtigungsoptionen: Alert, Push, Emails. Sie können ihn für jedes Finanzinstrument (Forex, CFD, Optionen)

Achtung! Die Standard-Eingabewerte sind bereits für EURUSD mit dem Zeitrahmen M1, einem Spread von 16 und einem abgesicherten Kontomodus mit einem Hebel von 1:100 und einer Ersteinlage von 500 US-Dollar optimiert. Verwenden Sie immer die Optimierung des Strategietesters, um die besten Werte für Ihre Vermögenswerte, den Zeitrahmen, den Spread und den Kontomodus einzustellen. Dies ist sehr wichtig und wird für einen erfolgreichen Handel dringend empfohlen. Optimieren Sie die Eingabewerte entsprech

BinaryUniversal ist ein Signalindikator für binäre Optionen und Forex. Bei seiner Arbeit verwendet der Indikator einen komplexen Algorithmus zur Erzeugung von Signalen. Vor der Bildung eines Signals analysiert der Indikator die Volatilität, Candlestick-Muster, wichtige Unterstützungs- und Widerstandsniveaus. Der Indikator verfügt über die Möglichkeit, die Genauigkeit der Signale einzustellen, so dass dieser Indikator sowohl für den aggressiven als auch für den konservativen Handel eingesetzt wer

Die Pfeile sind mit berechnet: - 2 Parabolic-Parameter - 2 ADX-Parameter - 4 Stochastik-Parameter
Wir empfehlen die Kombination mit dem Parabolic, ZigZag oder Elliot Waves Indikator. Handeln Sie immer im Trend!
Wenn Sie darauf achten, dass Sie Ihre Trendlinien und Unterstützungs-/Widerstandszonen einzeichnen, brauchen Sie nur auf das Signal zu warten. Gehen Sie den Handel ein. Für binäre Optionen ist es ratsam, die Ablaufzeit auf 5-15 Minuten im M1-Chart einzustellen. DIESER INDIKATOR WIRD NIC

Dieser Expert Advisor ist eine Light-Version des Silver Line EA und wurde ausschließlich für EURGBP optimiert. Wenn Sie den EA für andere Paare verwenden möchten, müssen Sie die Einstellungen für das beste Ergebnis optimieren. Der EA bestimmt automatisch die Anzahl der Ziffern in den Kursen. Der Expert Advisor kann auf Standardkonten, ECN-, Cent- und Mikrokonten arbeiten. Der Zeitrahmen, in dem der Expert Advisor arbeitet, wird in den Einstellungen festgelegt. Daher können Sie jeden beliebigen Z

Dieser Berater handelt nach Volumen und analysiert die Kerzen. Es ist eine kostenlose Version von Volume Candlex Master . Die Unterschiede zu den kostenpflichtigen Versionen bestehen darin, dass hier einige Funktionen nicht vorhanden sind: Arbeit auf 2 Zeitrahmen, Verwendung des gleitenden Durchschnitts, dynamischer Stop-Loss und Take-Profit, und auch das maximale Lot ist begrenzt (nicht mehr als 0,10). Empfohlene Timeframes: M5, M15, M30. Optimieren Sie vor dem Handel die Parameter des Advisors
FREE

UniversalFiboChannel ist ein universeller Indikator, der einen Handelskanal gemäß den Fibonacci-Levels bildet. Dieser Indikator ist eine vollwertige Channel-Handelsstrategie. Der Indikator wird auf die übliche Weise installiert und funktioniert mit jedem Trading-Tool. Optionen HelpBasisTF = "M: 43200; W: 10080; D1: 1440; H4: 240; H1: 60" ist ein Hinweis auf den Parameter BasisTF
BasisTF = 1440 - Basisperiode für die Berechnung der Fibonacci-Levels DisplayDecimals = 5 - die Anzahl der Dezimalst
FREE

Grid-Berater. Der Advisor legt die Eröffnungsniveaus der Aufträge in einem Abstand von n vom Durchschnittspreis (MA) fest. Er basiert auf einer Vorlage, die einen fortschrittlichen Gitteralgorithmus und eine Funktion zum Schutz vor erhöhter Volatilität während der Veröffentlichung von Nachrichten verwendet. Es gilt unsichtbar für den Broker dynamische Ebenen der Einstellung neuer Aufträge, Stop-Loss, Take-Profit und Trailing Stop. Wenn Sie MagicNumber = 0 einstellen, kann der Experte im halbauto

TraderPro ist ein vollautomatischer Berater für den professionellen Handel. Bei seiner Arbeit verwendet der Berater einen Gitteralgorithmus mit Absicherungspositionen. Die Absicherung von Positionen erhöht die Wahrscheinlichkeit erfolgreicher Transaktionen und reduziert das Risiko, die Einlage zu verlieren. Der Advisor wird auf die übliche Weise auf dem Zeitplan mit der Zeitperiode M5 eingerichtet und arbeitet mit beliebigen Handelswerkzeugen. Um hohe Handelsindikatoren zu erhalten, ist es notw
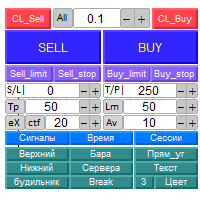
Panel "panel_kjutaMultiTerminal" für den Handel. Eröffnet, ändert, schließt und löscht Handels- und schwebende Aufträge auf dem Chart mit Hilfe von virtuellen Linien, Schaltflächen und dem aktiven Informationsterminal. Öffnet automatisch eine Order nach Indikatorstufen. Hinweise auf Russisch, Englisch oder deaktiviert. Verfügt über eine Reihe von Funktionen zum Nachziehen virtueller Take-Profit-Linien und Limit-Orders. Zeigt Informationen auf dem aktiven Informationsterminal an. Blendet virtuell

Der Advisor-Algorithmus berechnet die Korrelation zwischen den eingebauten Algorithmen zur Bestimmung der Muster von Preisbewegungen. Wenn das dynamisch berechnete erforderliche Korrelationsniveau erreicht ist, tritt der Advisor in den Markt ein.
Jede Transaktion wird durch einen kurzen Trailing-Stop kontrolliert, der jede Marktorder in beiden Zonen - profitabel und unprofitabel - begleitet.
Es wird empfohlen, den Advisor gleichzeitig für die folgenden Handelsinstrumente einzusetzen: EURUSD M5
Funktionsweise
Der Expert Advisor funktioniert auf jedem Zeitrahmen und für jedes Währungspaar. Wenn der Expert Advisor arbeitet, werden mehrere Trendindikatoren und Indikatoren für das Handelsvolumen analysiert, und wenn die erforderlichen Bedingungen eintreten, wird eine Marktorder eröffnet. Der Expert Advisor eröffnet die nächste Order erst dann, wenn die vorherige geschlossen ist.
Der Expert Advisor verfügt über einen TrailingStop-Block , der es ermöglicht, den StopLoss hinter die Preis

Hola Traders. Lot - Lotgröße für schwebende Aufträge. Martingale - doppelte Losgröße für schwebende Aufträge. *(Kein Martingale = 1.00) TotalGridEachSide - Einheit für jede Seite der schwebenden Aufträge. SpaceOfFirstOrder - Abstand für die erste Order in Punkten. Take Profit - Gewinn in Punkten. Stop Loss - Verlust in Punkten. Die gesamte Positionierung verwendet nur PUNKTE. (10 Punkte = 1 Pip)
und Sie können Aufträge BUYLIMIT, SELLLIMIT, ALLBUYANDSELL eröffnen Sie können Pending, Close order

Die Arbeit des Beraters stützt sich auf die nachlaufenden Eigenschaften der Trendindikatoren. Wenn sich der Preis in den Konsolidierungszonen befindet und die Daten der technischen Indikatoren nicht mit den aktuellen Preisformationen übereinstimmen, entscheidet der Berater über den Einstieg in den Markt.
Jede Transaktion hat einen festen Stop-Loss und Take-Profit.
Jeder Handel wird durch einen Trailing-Stop kontrolliert. Empfohlene Handelsinstrumente: EURUSD 5m, GBPUSD 5m, USDJPY 5m. Einstellu
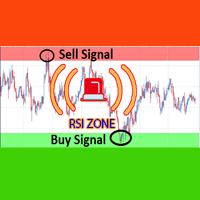
Over BS RSI Zone Alarm ist ein Oszillator-Indikator, der auf dem RSI-Oversold/Overbought-Indikator basiert.
Er alarmiert bei der nächsten Bar-Eröffnung mit einem Audio- oder Pop-up-Signal auf dem Chart.
Wenn RSI über 70, dass das Signal überverkauft Alarm.
Und RSI unter 30, dass das Signal überkauft Alarm.
Der Indikator kann das Niveau des Relative Strength Index anpassen. Messages/Sounds (Benachrichtigungen und Toneinstellungen) RSI_Period - Periode des Relative Strength Index.
Level_Overbough

AlfredsSoft ist ein einzigartiges Handelssystem, das aus mehreren Beratern besteht. Es wurde als ein sicheres Portfolio für langfristige Investitionen konzipiert. Es umfasst Scalp-, Flat- und Trend-Berater. Kein Martengel, kein Raster, kein Hedging. Verwendet immer einen Stop-Loss und Take-Profits, oder legt die Bedingungen für den Ausstieg aus der Position fest. Verwendung für das Paar EURUSD. Zeitrahmen H1. Einzahlung 300 $ für 0,01 Lot! Hat den Test seit 2008 mit einem Spread (20) erfolgreich

Der Endpunkt-Indikator ist ein Indikator, der vorhersagt, dass der müde Trend jetzt zurückkehren sollte. In diesem Indikator Gesetz, können wir leicht verstehen, dass der Trend, der in konstanten oder kontinuierlichen Rückgang ist jetzt umgekehrt werden sollte.
Unsere beliebten Produkte Super Oszillator HC Kreuz Signal Super Cross Trend Starker Trend Super Signal Vorschläge Empfohlenes Zeitintervall: M30, H1 Arbeiten Sie mit mindestens 20 Paaren. Betrieb mit maximal zwei Paaren. Für jedes Paar
FREE

Dieser Indikator zeigt die Trendbewegung an und berechnet automatisch die Balken . Eigenschaften
FiltPer -. zeigt den Zeitraum des Indikators an. Multiplikator - zeigt den Multiplikator des Indikators an. Wie der Status zu verstehen: Wenn der Indikatorbalken höher ist ist der Trend steigend. Wenn der Indikatorbalken niedriger ist , ist der Trend abwärts gerichtet. IIIIIIIIIIIIIIIIIIIIIIIIIIIIIIIIIIIIIIIIIIIIIIIIIIIIIIIIIIIIIIIIIIIIIIII
Der Algorithmus des Indikators bildet Unterstützungs- und Widerstandsniveaus. Auf der Grundlage dieser Niveaus sucht der Indikator nach einem falschen Durchbruch eines der Niveaus. Wenn die Bedingung erfüllt ist, wartet der Indikator auf eine Rückkehr in die Zone des falschen Durchbruchs. Wenn die Rückkehr erfolgt ist, gibt der Indikator ein Signal. Der Indikator wird nicht neu gezeichnet. Ein akustisches Signal ist eingebaut. Eine Informationstafel über den Handel ist verfügbar. Es ist möglich,

Der Trend Confirm Indikator ist eine Reihe von Indikatoren und eine Reihe von Kanalbewegungen. Der Zweck des Indikators ist es, einen gesunden Trend zu finden und entwickelt, um diese Trends zu bestätigen. Es gibt zwei Kanäle im Trend. Die blaue Kanallinie wird verwendet, um den aufsteigenden Trend zu bestätigen. Die grüne Trendlinie wird verwendet, um den Abwärtstrend zu bestätigen.
Wie wird er verwendet? Wenn die Trendlinie im Indikator über die blaue Kanallinie steigt, beginnt der Trend zu s
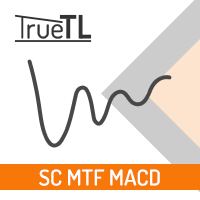
Hochgradig konfigurierbarer Macd-Indikator.
Merkmale: Hochgradig anpassbare Alarmfunktionen (bei Levels, Kreuzen, Richtungsänderungen per E-Mail, Push, Sound, Popup) Multi-Timeframe-Fähigkeit Farbanpassung (bei Pegeln, Kreuzen, Richtungsänderungen) Optionen für lineare Interpolation und Histogramm-Modus Funktioniert im Strategie-Tester im Multi-Timeframe-Modus (auch am Wochenende ohne Ticks) Einstellbare Levels Parameter:
Macd Timeframe: Sie können die unteren/höheren Zeitrahmen für Macd einst
FREE

Eine Informationstafel, die Kauf- und Verkaufsniveaus und Gewinnziele für den aktuellen Tag festlegt. Die Niveaus werden entsprechend der Bewegung der Währung für den gestrigen Tag festgelegt. Das Panel enthält Informationen über das Währungspaar, Markttrends, Zeit zum Schließen des Balkens, Geldmanagement, empfohlenes Lot, Gewinn in Pips sowie Niveaus für den Kauf und Verkauf des Instruments. Verwenden Sie nur schwebende Ausbruchsaufträge, um Geschäfte zu tätigen. Eingabeparameter Lots - legen
FREE

Wie der exponentielle gleitende Durchschnitt (EMA) reagiert er stärker auf alle Preisschwankungen als der einfache gleitende Durchschnitt (SMA), so dass der DEMA Händlern helfen kann, Umkehrungen früher zu erkennen, da er schneller auf Veränderungen der Marktaktivität reagiert. Der DEMA wurde von Patrick Mulloy in dem Bestreben entwickelt, die Verzögerungszeit der traditionellen MAs zu verringern. ( TASC_Feb. 1994 ). Der DEMA kann auch als Komponente in vielen Indikatoren wie dem Moving Average
FREE

3S-Indikator, der für die Trenderkennung ohne die Auswirkungen zufälliger Kurssprünge entwickelt wurde. Er verwendet Preisreihen und einige gleitende Durchschnitte zur Rauschunterdrückung. Er funktioniert auf mehreren Zeitrahmen, sogar auf M1. Um die Effektivität zu erhöhen, empfiehlt es sich, die Standardparameter für die M1-Grafik zu verwenden (siehe Screenshots). Sie können die Einstellungen für andere Zeitrahmen ändern. Beispiel für die Verwendung dieses Indikators : Wenn Gold zu Blau nach u

Dieser Expert Advisor handelt mit den Trends, Long und Short. Sobald das Momentum groß genug ist, wird ein Handel eingegangen. Wenn das Momentum schwächer wird, wird der Handel geschlossen. Der Stop-Loss und der Take-Profit sind also das Momentum.
Es ist am besten für das Währungspaar EURJPY im H1-Zeitrahmen geeignet.
Eingaben:
Lotsize: Die Losgröße für den Handel StopLoss: Hier können Sie das S/L-Niveau einstellen (Standard: 0 = nicht aktiv)
TralingStop: Hier können Sie den T/S setzen (Standa

Der Trend ist Ihr Freund! Das ist es, worum es bei diesem Indikator geht. Befolgen Sie diesen berühmten Spruch und seien Sie sicher.
Merkmale:
Kauf-/Verkaufssignale, die auf den Abschluss eines Balkens festgelegt sind. Funktioniert für alle Symbole und alle Zeitrahmen. Klare visuelle Markttrend-Laserlinie, Kauf-/Verkaufssignalpfeile, Marktstärkemesser, TP1 & TP2 Boxen. Visuelle Signale für den Einstieg und den Ausstieg aus dem Markt. Kein Nachmalen. Kompatibel mit Flexible EA für die Handelsau
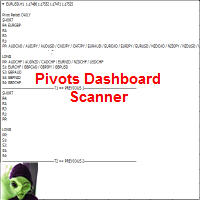
Dieser Indikator scannt und zeigt an, wo sich die Währungspaare derzeit in Bezug auf die Pivot-Levels befinden. Sie haben die Möglichkeit, zwischen täglichen, wöchentlichen, monatlichen, vierteljährlichen und jährlichen Pivots zu wählen. Die Formeln für Standard Pivot Levels und Camarilla Pivot Levels stammen aus dem Buch Secrets of a Pivot Boss: Revealing Proven Methods for Profiting in the Market von Frank O. Ochoa. Es enthält auch alle Arten von Alarmoptionen.
Funktionen Hängt an einem Chart

Dies ist die FXTraderariel TrendTrader .it Analyse der Trend und zeigt es, durch die Änderung der Änderung der Kerze Farbe. Ich habe über 12 Jahre gebraucht, um dieses System zu entwickeln. Aber es zeigt den Markt perfekt an. Sehr einfach zu folgen, auch für Anfänger.
Es funktioniert auf allen Paaren und allen Timeframes (allerdings raten wir nur professionellen Händlern, kleinere Timeframes zu handeln, Anfänger sollten sich an höhere TF wie H4 und D1 halten).
Abhängig von den Einstellungen un

CloseDelet_Orders CloseAtProfit ist ein EA, den ich nur verwende, um Aufträge nach einem definierten Gewinn oder Verlust zu schließen, alle Aufträge zu schließen und auch schwebende Aufträge zu löschen.
Die Geschwindigkeit der Schließung hängt von der Zeit ab, zu der gehandelt wird, vom Broker, den Sie benutzen und von den Symbolen, die Sie handeln. INPUTS:
win_USD_All = schließt alle Orders (Verkauf+Kauf), wenn der Gewinn größer ist als der definierte Gewinn zum Schließen; win_USD_BUY = schlie

Ein Trendmarkt ist ein Markt, auf dem sich die Preise im Allgemeinen in eine Richtung bewegen. ... Beim Handel mit einer trendbasierten Strategie wählen Händler in der Regel die Hauptwährungen sowie alle anderen Währungen, die den Dollar nutzen, weil diese Paare tendenziell im Trend liegen und liquider sind als andere Paare.
Bester Trendindikator, der Ihnen die Richtung des Trends anzeigt
Trend MagicX_v1.1 zeigt die Trendrichtung, Dauer, Intensität und die daraus resultierende Trendbewertung f

Der MultiTimeframe (MTF) Unterstützungs- und Widerstandsindikator wird verwendet, um die letzten 320 Bar (Benutzereingabe) der Unterstützung und des Widerstands des entsprechenden Zeitrahmens zu messen. Der Benutzer kann diesen Indikator mit jedem gewünschten Zeitrahmen verbinden.
Merkmale: Benutzereingabe des gewünschten Zeitrahmens (Standardzeitraum H4) Benutzereingabe der Anzahl der letzten Balken (Standardwert 320 Balken) Benutzereingabe der Messung der letzten HH und LL (Standardwert 10 B
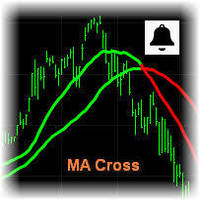
MA Cross Signal Alerts_v1.0 Der gleitende Durchschnitt Cross zeigt einen schnellen und einen langsamen gleitenden Durchschnitt (MA) an. Ein Signalpfeil wird angezeigt, wenn sich die beiden MAs kreuzen. Ein Aufwärtspfeil wird angezeigt, wenn der schnelle MA über dem langsamen MA kreuzt, und ein Abwärtspfeil, wenn der schnelle MA unter dem langsamen MA kreuzt. Der Benutzer kann die Eingaben (Schlusskurs), die Methoden (EMA) und die Periodenlänge ändern.
Wenn sich zwei gleitende Durchschnitte kr

SELL-Aufträge modifizieren v1.0 Verwaltung von Aufträgen Während des Handels kann es vorkommen, dass Sie Aufträge ändern müssen, z.B. um Stop Levels oder Take Profits zu ändern. Dies können Sie mit einem Klick mit dem Skript SELL-Aufträge modifizieren v1.0
Das Skript ändert alle Aufträge (Markt) mit angegebenem Take Profit und Stop Loss (Pip oder Preis). Wenn der Take Profit oder (und) Stop Loss falsch ist, wird der Wert nicht geändert.
Parameter Skript : Gewinnmitnahme (PIP) Stop Loss (PIP)

Mantis EA ist ein Ausbruchssystem, das Algorithmen des maschinellen Lernens und der künstlichen Intelligenz verwendet, um die tägliche Unterstützung und den Widerstand für EURUSD zu bestimmen.
Es bietet auch eine Risikomanagement-Methodik durch die Einstellung Losgröße nach dem Kapital Risiko Prozent.
Die Parameter des EA sind: MagicNumber - muss für jede EA-Instanz eindeutig sein UseFixedLots - true/false für die Auswahl der Losgrößenmethode FixedSize - wenn UseFixedLots = true, dann ist die

BUY Aufträge ändern_v1.0 Verwalten von Aufträgen Während des Handels kann es vorkommen, dass Sie Aufträge ändern müssen, z.B. um Stop Levels oder Take Profits zu ändern. Mit THE SCRIPT können Sie dies mit einem Klick erledigen BUY-Aufträge ändern v1.0
Das Skript ändert alle Aufträge (Markt) mit angegebenem Take Profit und Stop Loss (Pip oder Preis). Wenn der Take Profit oder (und) Stop Loss nicht korrekt ist, dann wird der Wert nicht geändert.
Parameter SCRIPT; Gewinnmitnahme (PIP) Stop Loss
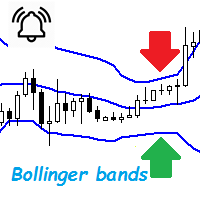
Bollinger Bands sind ein sehr verbreiteter Indikator in der Welt des Online-Handels. Dieser Indikator liefert sehr nützliche Informationen für viele Forex-Handelsstrategien, aber auch für alle anderen Arten von Strategien wie Scalping und sogar den mittel- und langfristigen Handel. Er wird aus einem gleitenden Durchschnitt berechnet, der über n Perioden (standardmäßig 20) berechnet wird. Aus diesem gleitenden Durchschnitt wird eine Standardabweichung berechnet. Wenn wir diese Standardabweichung

Der Sensitive Volume Indikator ist ein Indikator, der dazu dient, Handelssignale zu generieren. Der Zweck dieses Indikators ist es, Signale mit der höchsten Wahrscheinlichkeit für den Handel zu erzeugen. Er verwendet eine Reihe von Preisbewegungen und eine Reihe von Indikatoreigenschaften, um diese Signale zu erzeugen.
Leicht zu bedienen, einfach und verständlich für den Benutzer. Mit Alarmfunktionen können die Signale schnell erreicht werden. Optisch kann der Benutzer die Signale leicht erkenn
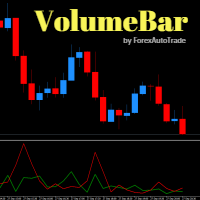
VolumenBar Hola Traders. Dieser Indikator zeigt ein Liniendiagramm des Volumens eines jeden Balkens. Zeigt das Volumen der Käufe und Verkäufe eines jeden Balkens an. Sie können diesen Indikator mit jedem Währungspaar und jedem Zeitrahmen verwenden. Die Anzeigeparameter sind farblich anpassbar.
Ursprüngliche Parameter: FarbeGrün - Kaufvolumen. FarbeRot - Verkaufsvolumen.
Danke Traders
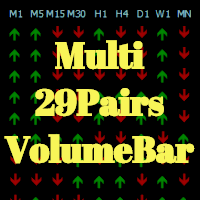
Hola Traders. Dieser Indikator hat sich aus dem VolumeBar Indikator entwickelt. Durch das Signal zeigen von der letzten Bar abgeschlossen. Zeigen 9 Zeitrahmen und 29 Paare Währung. XAU,USD,EUR,GBP,AUD,NZD,CAD,CHF,JPY
Die Anzeigeparameter sind farblich anpassbar. Original-Parameter: FarbeGrün - Kaufsignal. FarbeRot - Verkaufssignal. Font29PairsColor - Farbe der Schrift 29 Paare Währung.
Danke Traders

Oszillator Trend Indikator macd, Divergenz und eine Reihe von Algorithmen ist ein Trendindikator. Das Ziel des Indikators ist es, mit Hilfe der oben genannten Berechnungen Signale mit hoher Zuverlässigkeit zu generieren.
Der Indikator ist sehr einfach zu bedienen. Rote Pfeile geben ein Verkaufssignal. Die Aqua-Pfeile geben ein Kaufsignal. Dank der Warnfunktion können Sie die Signale leicht erreichen. Er funktioniert ohne jegliche Einstellung. Er kann in allen Zeitrahmen verwendet werden. Die em

BB SCALPER Der BB Scalper Expert Advisor basiert auf hohen Kursbewegungen, um die Gelegenheit zum Kauf oder Verkauf zu erkennen. Merkmale Spread-Schutz Slippage-Schutz kein Raster kein Martingal ein kleiner SL für jeden Handel EINSTELLUNG StopLoss: Stop-Loss-Wert für jede Order zum Schutz des Saldos. MitnahmeGewinn: TakeProfit-Wert, um den Auftrag zu schließen, wenn er das Ziel erreicht. MagischeZahl: Magische Zahl für jeden Auftrag. StartAbstand: Der Abstand für die Pending Order mit Preis. Max

Der MESA-Spektrum-Indikator berechnet das Leistungsspektrum einer Datenreihe mithilfe der Maximum-Entropie-Spektrum-Schätzmethode und erstellt ein Leistungsspektrum-Diagramm. Der Maximum-Entropie-Algorithmus umfasst im Gegensatz zu einer einfachen FFT-Transformation Frequenzen aus der gesamten komplexen Frequenzebene und nicht nur aus dem Nyquist-Intervall , was im Allgemeinen bedeutet, dass er Zyklusperioden auflösen kann, die größer sind als das an die Funktion übergebene Datenfenster. Darüber

Version 1.05 - Option zum Setzen des Daten-Offsets (Anker) mit der Maus hinzugefügt. Halten Sie einfach die SHIFT-Taste gedrückt, doppelklicken Sie auf eine beliebige Stelle im Chart und lassen Sie dann die SHIFT-Taste los. Der Anker wird auf den Balken gesetzt, der dem Doppelklick am nächsten liegt.
Version 1.04 - Korrektur für den Demomodus (d.h. den Betrieb im Strategietester) hinzugefügt. Verwenden Sie nur offene Kurse und aktivieren Sie Datum verwenden (wählen Sie einen Datumsbereich)
Der M

BeST_Visual MAs Signal Generator MT4 Indicator ist ein sehr nützliches visuelles Tool , das im Chart alle ENTRY-Signale (BUY und SELL) und auch jedes entsprechende EXIT-Signal anzeigen kann, basierend auf insgesamt 12 gemeinsamen, aber auch unterschiedlichen Handelsstrategien, bei denen die Entry- und Exit-Signale ausschließlich durch die Verwendung von Moving Averages (MAs) abgeleitet werden. Die zwei Hauptgruppen von MAs-Strategien, die in diesem Tool enthalten sind, sind: A) Crossover-Signale
Dieser Expert Adviser verwendet eine Oszillation des Indikators iStochastic, um Trades in Form von Pending Orders einzugehen und zu beenden, während er sie nachverfolgt. Er sendet auch E-Mails, wenn ein Trade long oder short eröffnet wird, und erstellt Euro-Objekte der Größe 200.200 in der oberen linken Ecke des Charts, in dem Sie handeln. Hier sind die Parameter, die in dem EA verwendet werden double stop loss=50; double Take profit=50; double lot=1; double Trailing stop=30; double ISTOCHMINLEV

Der Expert Advisor bestimmt die Flat und legt die Levels für die Eröffnung von Orders fest. Basierend auf einer Vorlage mit einem fortschrittlichen Rasteralgorithmus und Schutz vor erhöhter Volatilität bei Pressemitteilungen. Wendet dynamische Level für das Setzen neuer Orders, Stop Loss, Take Profit und Trailing Stop an, die für den Broker unsichtbar sind.
Wenn Sie MagicNumber = 0 setzen, kann der EA im halbautomatischen Handel verwendet werden. Eine Position kann manuell eröffnet werden un

Das Skript öffnet ein separates Fenster und zeigt darin Informationen über die aktuell offenen Positionen an.
Der Informator wird für diejenigen nützlich sein, die mit einer großen Anzahl von offenen Positionen auf verschiedenen Instrumenten in verschiedenen Richtungen arbeiten.
Es ermöglicht Ihnen, die Belastung des Depots nach Instrumenten schnell zu zerlegen, die angespanntesten Stellen in der Gesamtposition visuell zu identifizieren. Für die exponierten Stop-Orders berechnet es die Gesamtr
Der MetaTrader Market ist die beste Plattform für den Verkauf von Handelsroboter und technischen Indikatoren.
Sie brauchen nur ein gefragtes Programm für die MetaTrader Plattform schreiben und schön gestalten sowie eine Beschreibung hinzufügen. Wir helfen Ihnen, das Produkt im Market Service zu veröffentlichen, wo Millionen von MetaTrader Benutzern es kaufen können. Konzentrieren Sie sich auf dem Wesentlichen - schreiben Sie Programme für Autotrading.
Sie verpassen Handelsmöglichkeiten:
- Freie Handelsapplikationen
- Über 8.000 Signale zum Kopieren
- Wirtschaftsnachrichten für die Lage an den Finanzmärkte
Registrierung
Einloggen
Wenn Sie kein Benutzerkonto haben, registrieren Sie sich
Erlauben Sie die Verwendung von Cookies, um sich auf der Website MQL5.com anzumelden.
Bitte aktivieren Sie die notwendige Einstellung in Ihrem Browser, da Sie sich sonst nicht einloggen können.