FXTraderariel Psychology Levels
- Indikatoren
-
Ariel Capja
 I am professional trader with over 10 years expericence in the stock market. I offer several services to help other traders become successful. You can get my signal and indicators based on my knowledge. Feel to contact me.
 - Version: 3.0
- Aktualisiert: 2 Februar 2019
- Aktivierungen: 5
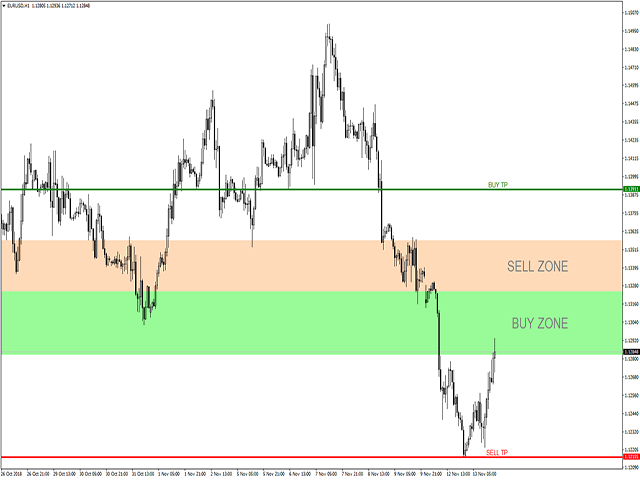
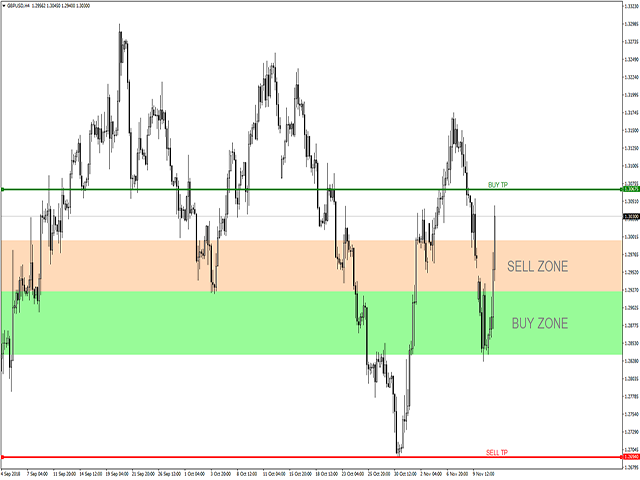
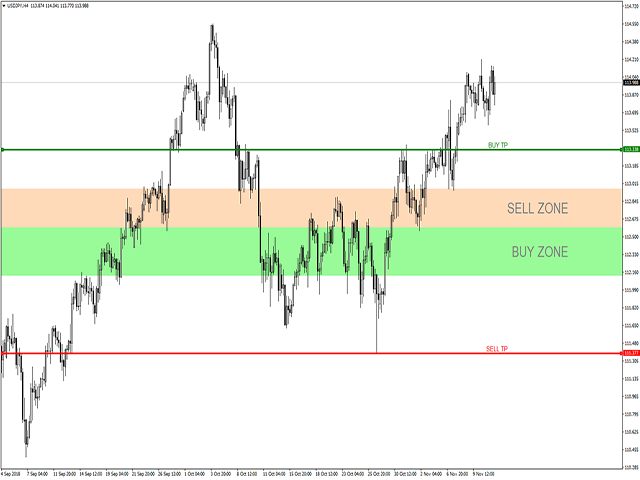
Dies ist der FXTraderariel Psychologie-Indikator, der anhand von Psychologie-Levels eine Verkaufs- und Kaufzone berechnet. Der Indikator zeigt auch potenzielle Take-Profit-Ziele an. Je nach Einstellung und Handelsstil kann er für Scalping oder langfristigen Handel verwendet werden. Der Indikator kann auf jedem Zeitrahmen verwendet werden, aber wir empfehlen, ihn auf H1, H4 und D1 zu verwenden. Vor allem, wenn Sie ein Anfänger im Handel sind. Professionelle Trader können ihn auch für Scalping in kleineren Zeitrahmen (M1, M5 und M15) verwenden. Dieser Indikator ist kein vollständiges Handelssystem, es sollte nicht jedes Signal gehandelt werden. Die Trades sollten genau beobachtet werden.
Für Details kontaktieren Sie mich bitte hier oder auf instagram.
Erläuterung der Parameter
- text_indent_in_bars: Dieser Wert legt den Abstand für das Label buy und sell zone fest
- label_font_size: Legt die Schriftgröße für das Label buy und sell zone fest
!!!!!!!!!! Es gibt keinen Gruppenzugang für 1 Monat Miete und keine Mac-Versionen für 1 Monat Miete! ! !!!!!!!!!
!!!!!!!!!! WENN SIE PROBLEME BEI DER INSTALLATION DES INDIKATORS HABEN, KONTAKTIEREN SIE UNS BITTE. WIR HELFEN IHNEN GERNE UND LÖSEN JEDES PROBLEM !!!!!!!!!!

Worthless don't buy it