Neue Handelsroboter und Indikatoren für den MetaTrader 4 - 283
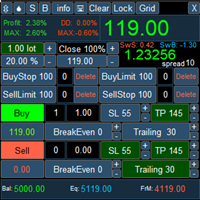
PanelLongProfit-Multifunktionspanel der neuen Generation. Merkmale: Ermöglicht es Ihnen, schnell auf starke Marktbewegungen zu reagieren, die gesamte Steuerung ist im Panel an einer Stelle auf dem Bildschirm konzentriert Auswahl der Nachrichtensprache (RUS, ENG) Die Schaltfläche "Clear" löscht unnötige und nicht benötigte Objekte aus dem Chart. Die Schaltfläche "Lock" sperrt alle Trades. Wenn die Schaltfläche aktiviert ist, sperrt der Expert Advisor die Positionen ständig. Mit der Schaltfläche "

Wenn Sie mehr als 1 offene Position verfolgen müssen, sollten Sie diesen einfachen TrailingStop EA verwenden.
Eingabe 1 Sie haben 4 Optionen, um den TrailingStop zu setzen, Folgen Sie den Positionen des Symbols des Diagramms. Folgt einer Position, die eine bestimmte Ticketnummer hat. Folgt den Positionen, die eine bestimmte Magic-Nummer haben. Allen Positionen folgen. Eingabe 2 Ticketnummer (wenn die 2. Option als Eingabe 1 gewählt wurde) Eingabe 3
Magic Number (wenn die 3. Option als Eingang
FREE

Sell Bot ist ein vollautomatischer Expert Advisor für den Handel im Abwärtstrend. Er verwendet Elemente von Grid-Strategien, Scalping, No-Loss, Stop-Loss- und Take-Profit-Setzung . Handel auf Nachrichten. Der Expert Advisor zeigt Nachrichten an und speichert sie auf dem lokalen Computer für 1 Jahr. Die Nachrichten werden alle 60 Minuten oder durch Drücken der Schaltfläche "Update News" aktualisiert. Die Nachrichten werden von http://www.investing.com/economic-calendar/ heruntergeladen . Damit de

Alle Händler wissen, dass es unmöglich ist, ohne Statistiken zu arbeiten und Statistiken auf Papier zu führen oder Internetressourcen zu nutzen. Der Indikator "VG-Statistik" erstellt Statistiken über die Geschichte Ihrer Geschäfte. Um korrekt zu arbeiten, müssen Sie den gewünschten Zeitraum in der Historie der Transaktionen auswählen und auf die Schaltfläche "Erweitern" in der linken Ecke des Charts klicken. alle in Ihr Terminal geladenen Geschäfte mit Kommission und Swap berücksichtigt werden,
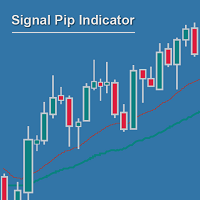
Die Messung des Abstands zwischen zwei MAs kann viel leistungsfähiger und zuverlässiger sein als das Warten auf sich kreuzende MAs, und dann wieder auf bestätigende Setups... Wenn Sie nicht mehr auf MA-Kreuzungen warten wollen, weil es für gute Einstiegspositionen zu spät ist, liegen Sie mit dem Signal Pip Indicator richtig.
Sie sollen einen Alarm für den Abstand zwischen zwei MAs, schnell & langsam, einstellen, wobei ein dritter bestätigender MA als zusätzlicher Auslöser & ein vierter zum Hera
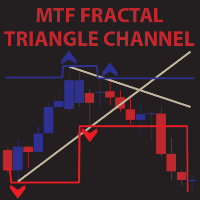
MTF Fractal Triangle Channel ist ein komplettes Set von Fraktal-Indikatoren, die nicht nur aufsteigende, absteigende und flache Fraktalkanäle anzeigen, sondern auch Dreieckskanäle mit eingebautem Trenddetektor, der Sie per E-Mail, Push-Benachrichtigung und Pop-up-Fenster benachrichtigen kann, sobald er ein Dreieck oder eine beliebige Art von Kanal erkannt hat, den Sie mit dem Trend kombinieren möchten. Zum Beispiel, dieser Indikator gefunden ein neues Dreieck Kanal und es warten auf bestimmte Tr

Suchen Sie nach einem leistungsstarken Indikator für den Devisenhandel, der Ihnen dabei helfen kann, profitable Handelsmöglichkeiten mit Leichtigkeit zu erkennen? Suchen Sie nicht weiter als das Beast Super Signal. Dieser benutzerfreundliche trendbasierte Indikator überwacht kontinuierlich die Marktbedingungen, sucht nach neuen sich entwickelnden Trends oder springt auf bestehende Trends ein. Das Beast Super Signal gibt ein Kauf- oder Verkaufssignal, wenn alle internen Strategien aufeinander ab
Dieser Berater ist ein Dashboard, mit dem Sie mehrere Paare mit einem Klick handeln können. klicken Offen Schaltfläche zum Öffnen der Bestellung für das ausgewählte Paar. klicken schließen Schaltfläche zum Schließen der Bestellung für das ausgewählte Paar. Das Bestelllos ist die vom Benutzer eingegebene Nummer. Positive Zahlen entsprechen Kaufaufträgen, negative Zahlen entsprechen Verkaufsaufträgen. Um die gesamte Bestellung statt nur teilweise zu schließen, klicken Sie
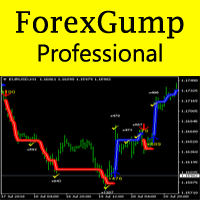
Jetzt ist ForexGump ein noch professionelleres Tool für den Forexhandel geworden. ForexGump Professional arbeitet an der Strategie, einem Trend zu folgen. Alle Filter-, Optimierungs- und Überwachungsfunktionen des Marktes sind in einem Indikator integriert. Vollautomatischer neuronaler Netzwerkalgorithmus mit Genauigkeit bestimmt die Richtung des Preises und die effektivsten Punkte der Öffnungs- und Schließungsaufträge. Alles, was Sie brauchen, ist den Anweisungen von ForexGump Professional zu f
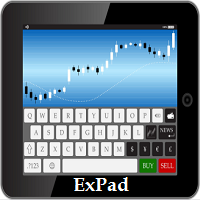
ExPad - ein Handels-Panel für den komfortablen Handel auf den Finanzmärkten. Geeignet für den Handel mit beliebigen Finanzinstrumenten. Im Allgemeinen kann das Panel die folgenden Funktionen ausführen: Eröffnen und Umkehren von Geschäften Handel mit sichtbaren und versteckten StopLoss und TakeProfit Unabhängige Verwaltung von sichtbaren und versteckten StopLosses Gewinnabsicherung durch Breakeven und Trailing Stop Wahl der Technik für Trailing Stop Abstand zum Marktpreis Gleitender Durchschnitt

Der Pinnacle Expert Advisor ist das Ergebnis umfangreicher Bewertungen und Rückmeldungen zum Three Peaks-Indikator. Nach langer Vorfreude freue ich mich, den Pinnacle Expert Advisor vorstellen zu können, der auf der Grundlage des Three Peaks-Indikators aufgebaut ist. Pinnacle ist ein vielseitiger Expert Advisor, der sowohl in Aufwärts- als auch in Abwärtsrichtung handeln kann. Mit akribischer Forschung habe ich das optimale Verhältnis zwischen Take Profit und Stop Loss ermittelt. In Anlehnung a

Festlicher Verkauf -40% ist aktiv! Genießen Sie :) Frohes neues Jahr und frohe Weihnachten! EA Sapphire ist ein vollautomatischer Expert Adviser, der ein Modell für den Handel auf wichtigen Kursniveaus verwendet. Der Einstiegspunkt jedes Marktes wird von einem fortschrittlichen Selektionsalgorithmus analysiert, und je nach den festgelegten Kriterien wird eine Strategie des Rebounds oder des Ausbruchs aus dem Schlüsselniveau angewendet. Alle Handelspositionen enthalten eine schützende Stop-Order
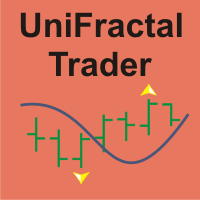
UniFractal Trader basiert auf einem proprietären 1-Balken-Fraktal-Algorithmus mit 5 Modi in Kombination mit dem Gleitenden Durchschnitt, der Signalfilterung durch den VMeter-Indikator, dem Trailing Stop und der Option, das Handelssignal umzukehren. Der Standard-Fraktal-Indikator verwendet einen 2-Balken-Verifizierungsprozess, was bedeutet, dass die Order erst ab dem 3. Balken nach dem Fraktal gesendet werden kann. Der Fraktal-Algorithmus dieses Experten ermöglicht den Handel am 2. Balken nach de

Funktion Anzeige von Kauf-Verkaufssignalen Stärke der Kauf-Verkauf-Signale anzeigen Dieses System ist für beide Arten von Händlern (Kurz- und Langfristig) Anstelle von anderen Berechnungen werden auch Parabolic Sar & Awesome verwendet In jedem Zeitrahmen kann dies verwendet werden. Was ist für Trader drin? Handelswechsel: Kurzfristig & Langfristig Schließlich, wir alle wissen, dass Forex Trading braucht völlig konzentrieren & richtige Cash-Management, so dass ich nie versprechen, dass mein Progr
FREE

FOLGEN SIE DER LINIE DIE VOLLVERSION ERHALTEN SIE HIER: https://www.mql5.com/en/market/product/36024 Dieser Indikator gehorcht der beliebten Maxime, dass: "DER TREND IST DEIN FREUND". Er malt eine GRÜNE Linie für KAUFEN und eine ROTE Linie für VERKAUFEN. Er gibt Alarme und Warnungen aller Art aus. Er wiederholt sich nicht und kann für alle Währungspaare und Zeitrahmen verwendet werden. Ja, so einfach und simpel ist das. Selbst ein Neuling kann damit großartige und zuverlässige Geschäfte machen.
FREE
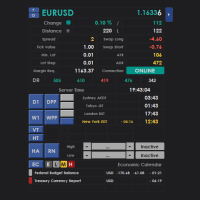
Intraday Dashboard für MetaTrader 4 Das Intraday Dashboard besteht aus umfassenden Daten, die nur mit der Umschalttaste angezeigt werden können. Viele Händler mögen keine unübersichtlichen Charts, aber es kommt manchmal vor, dass Händler einen Blick auf Daten wie die Sitzung und den Wirtschaftskalender werfen müssen, um eine bessere Entscheidung beim Handel zu treffen. Dieser Indikator ist die Lösung für diese besondere Situation, um Marktinformationen nur bei Bedarf zu liefern. Merkmale Separat
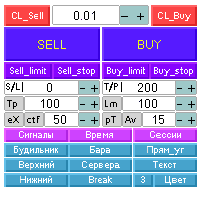
Automatisiertes Panel "panel_kjutaMultiTS_l" für den Handel. Eröffnet, ändert, schließt und löscht Handels- und schwebende Aufträge auf dem Chart mit Hilfe von virtuellen Linien, Schaltflächen und einem aktiven Informationsterminal. Eröffnet automatisch Aufträge nach Raster, Martingale und Indikatorstufen. Hinweise in Russisch, Englisch oder deaktiviert. Verfügt über eine Reihe von Funktionen für das Aufspüren von virtuellen Linien Take Profit und Limit-Orders. Gibt Informationen über das aktive

BSS SCALPING EA FÜR MT4
EA arbeitet auf der Grundlage von HFT (High Frequency Trading) Algorithmus. Seine mittlere Trades durchschnittliche Haltezeit bleibt in Sekunden. EA setzen zwei Stop-Aufträge 1 kaufen stoppen und 1 verkaufen oben in der Nähe des aktuellen Preises. Und diese beiden Stop-Aufträge häufig halten Änderung an vordefinierten Timer in Sekunden bei vordefinierten Abstand vom aktuellen Preis. Und während Nachrichtenereignissen und plötzlichen Ereignissen mit hoher Volatilität nahm

Volumina - einer der wichtigsten Indikatoren für den Handel, da es hohe Volumina sind, die den Markt in die eine oder andere Richtung bewegen. Dieser Berater handelt nach Volumen und analysiert die Kerzen. Davon hängt ab, wie stark der Trend beginnen kann. Zur Verbesserung der Qualität der Transaktionen, verwendet viele andere Indikatoren (Gleitender Durchschnitt, RSI, ATR, ADX) und kann die Höhe der Take-Profit und Stop-Loss, je nach der Stärke der vorherigen Bewegung zu bestimmen. Empfohlene Z

Der Algorithmus des Tic Tac Toe-Indikators unterscheidet sich von den üblichen Indikatoren auf den Preisdiagrammen dadurch, dass er den Zeitablauf völlig ignoriert und nur die Preisänderungen wiedergibt. Anstatt die Zeitintervalle auf der X-Achse und den Preiswert auf der Y-Achse anzuzeigen, zeigt der Tic Tac Toe-Indikator Preisänderungen auf beiden Achsen an. Der Indikator zeigt rot an, wenn die Preise um einen bestimmten Basiswert (TicTacToe) steigen, und blau, wenn die Preise um denselben Wer

YinYang-Absicherung Die Parameter sind einfach und anpassungsfähig, der EA kann mit jeder Art von Markt umgehen, und die Leistung ist stabil. Anforderungen: Run timeframe: H1; EA-Ladewährung: Währung A, Währung B müssen nicht zum Laden des EA; Mindestkontoguthaben: $1000; Bei der Verwendung sollten die Parameter "Test" von "true" auf "false" eingestellt werden; VPS-Hosting 24/7 wird dringend empfohlen; Währungspaare werden empfohlen:A-GBPUSD,B-EURUSD;A-AUDUSD,B-NZDUSD;A-EURCAD,B-USDCAD;A-GBPJPY,
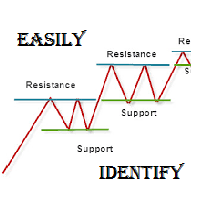
Wie der Name leicht erkennen lässt, ist dieser Indikator ein erschwingliches Handelsinstrument denn mit der Hilfe von Beliebte Entwickler & Unterstützung der M Q L Plattform Ich habe diese Strategie programmiert. Ich habe versucht, 4 Arten und 3 Perioden der Berechnung in Bezug auf Support Resistance, Darüber hinaus habe ich auch Pflege über Trendlinien dass Trader auch auf andere Weise leicht mit dem Markt in Kontakt kommen können. Was ist für Trader drin?
Trading Modes: Diese Auswahl ist für
FREE

Stronger Trend ist ein Indikator, der Trendsignale erzeugt. Er erzeugt Trendsignale mit seinem eigenen Algorithmus. Diese Pfeile geben Kauf- und Verkaufssignale. Der Indikator malt natürlich nicht nach. Er kann für alle Paare verwendet werden. Sendet ein Signal an den Benutzer mit der Alarmfunktion.
Handelsregeln Geben Sie das Signal ein, wenn das Kauf- und Verkaufssignal eintrifft. Die Verarbeitung sollte nur dann eingeleitet werden, wenn Signalwarnungen empfangen werden. Es ist unbedingt notw
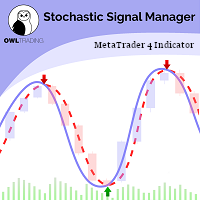
Stochastik-Warnungs-Manager Einführung: Der Stochastic Alert Manager ist ein anpassbarer Indikator, der bei Handelssignalen Warnungen sendet. Er gibt dem Benutzer auch einen Überblick über die Tendenz in allen Zeitrahmen durch ein Panel, um das globale Marktverhalten im Auge zu behalten. Er basiert auf der Strategie des stochastischen Crossovers. Der Stochastic Alert Manager ist vorerst nicht für die Eröffnung von Geschäften gedacht. - Einfach - Konfigurierbar - Reagiert schnell - Überwachen Sie

Der ATR Accelerator Indicator informiert Sie über starke Kursbewegungen auf der Grundlage des ATR-Indikators. Dieser Indikator funktioniert für alle Timeframes und Symbole, die Stärke der Bewegungen kann konfiguriert werden.
Wichtig! Um über neue Produkte informiert zu werden, treten Sie unserem MQL-Kanal bei: h ttps:// www.mql5.com/en/channels/etradro
Verwendung Dieser Indikator funktioniert für alle Timeframes und Symbole, die Stärke der Bewegungen kann konfiguriert werden. Eigenschaften fun
FREE

LookOut ist ein EA, der auf einem Algorithmus basiert, der neben der standardmäßigen technischen Analyse, wie der Momentum-Bewertung , kurz- und mittelfristigen Markttrends oder der vorübergehenden und strukturellen Volatilität , eine exklusive intelligente Identifizierung typischer Risikomuster des EURUSD-Paares beinhaltet.
Es nutzt einen adaptiven Martingale-Handel , auf intelligente und dynamische Weise, weit entfernt von der klassischen und mechanischen Konzeption dieser Technik.
Ein engma

Der Magneto BCS-Indikator arbeitet auf der Grundlage der Candlestick-Analyse. Bestimmt Umkehrpunkte und Trendfortsetzungen. Basiert auf einer einfachen und stabilen Strategie für die Intraday- und mittelfristige Arbeit. Passt sich an die aktuelle Volatilität des Instruments an.
Einstellung und Arbeit mit dem Indikator Die Einstellung des Indikators beschränkt sich auf die Auswahl der Parameter Gate und Size detect . Je höher der Gate-Wert ist, desto weniger Signale gibt es. Die Größenerkennung

Dieser Indikator scannt und zeigt Währungspaare an, deren gleitende Durchschnitte sich kürzlich in einem bestimmten Zeitrahmen angeglichen haben. Sie können konfigurieren, welche Paare der Indikator scannen soll. Er umfasst auch alle Arten von Warnoptionen. Bullische MA-Ausrichtung = MA1>MA2>MA3>MA4>MA5
Bären-MA-Ausrichtung = MA1<MA2<MA3<MA4<MA5
Merkmale Kann an einen Chart angehängt werden und scannt alle konfigurierten und im Market Watch Window sichtbaren Währungspaare Es kann alle verfügbar
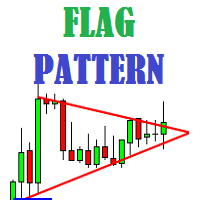
Der Flag Pattern Indikator ist ein Indikator zum Auffinden von Flaggenmustern. Bullish und Bear finden Flaggenmuster. Er findet diese Muster durch seinen eigenen Algorithmus. Die Anzeige ist leicht zu bedienen und einfach.
Eigenschaften Bullish und Bear finden Flaggenmuster. Zeichnen von Mustern auf dem Grafikbildschirm. Ungültige Flaggenmuster. Warnung des Benutzers mit der Warnfunktion. Flaggenmuster haben die Möglichkeit, die Farben zu ändern. Parameter MinSplashHeight - Min. Höhe des Splash
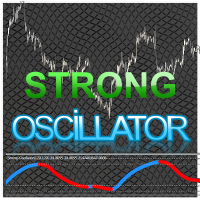
Strong Oscillator ist ein Indikator, der entwickelt wurde, um Indikator-Trends zu finden. Er findet Trends mithilfe einer Reihe von Algorithmen und einer Reihe von Indikatoren.
Dieser Indikator ist ein Trendindikator. Er hilft Ihnen, Trends leicht zu finden. Sie können diesen Indikator allein verwenden oder ihn als Hilfsindikator für andere strategisch geeignete Indikatoren einsetzen. Sie können ihn als Trendbestätigungsindikator verwenden.
Vorschläge und Merkmale Der Indikator verfügt über 4

NewsReleaseEA ist ein Experte für den Handel mit Wirtschaftsnachrichten, der Pending Orders verwendet. Der Experte erhält Daten für Ereignisse von 'http://forexfactory.com' ." Der Experte kann bis zu 28 (31 mit Yuan) Paare aus einem Chart handeln. Experte hat die Möglichkeit für manuelle Strategie (Benutzer-Strategie) oder verwendet eine der fünf enthaltenen Strategien. Der Experte verfügt über einen Analysator für jeden Handel, der Informationen für jede Währung und jedes Paar anzeigt, um dem
FREE

Eigenschaften Dieser EA ist ein vollautomatischer EA für den Devisenhandel. Dieser EA wird eingesetzt, wenn die Volatilität des Marktes zunimmt. Die Zielwährung ist GBPJPY. Dieser EA nimmt bis zu zwei Positionen ein. Die Eingabeparameter sind für H4, H1 und M30 optimiert. Der maximale Gewinn ist auf 300 Pips festgelegt. Die maximale Verlustbegrenzung ist auf 100 Pips festgelegt.
Parameter FUNDA - Wenn Sie nur kaufen wollen, stellen Sie bitte 1 ein. Wenn Sie nur verkaufen wollen, setzen Sie bitt
FREE
Hochgradig konfigurierbarer RSI-Indikator. Merkmale: Hochgradig anpassbare Alarmfunktionen (bei Levels, Kreuzen, Richtungsänderungen per E-Mail, Push, Sound, Popup) Multi-Timeframe-Fähigkeit Farbanpassung (bei Pegeln, Kreuzen, Richtungsänderungen) Optionen für lineare Interpolation und Histogramm-Modus Funktioniert im Strategie-Tester im Multi-Timeframe-Modus (auch am Wochenende ohne Ticks) Einstellbare Levels Parameter:
RSI Timeframe: Sie können den aktuellen oder einen höheren Zeitrahmen für
FREE

Dieser Indikator wurde entwickelt, um die Differenz zwischen dem MOMENTUM-Kurs und dem Indikator zu ermitteln. Dieser Indikator zeigt die Differenz zwischen Kurs und Indikator auf dem Bildschirm an. Der Benutzer wird mit der Funktion zum Senden eines Alarms benachrichtigt. Unsere beliebten Produkte Super-Oszillator HC Kreuzsignal Super Cross Trend Starker Trend Super Signal Parameter divergenceDepth - Tiefe der Suche des 2. Referenzpunktes Momentum_Period - Zweiter Berechnungszeitraum indApplied
FREE

Dieser klassische "old school" MAGIC MACD Indikator gibt Ihnen das Kreuz der Parameter, die Sie einstellen. Die Standardeinstellung ist (12,26,9). Die Pfeile zeigen Ihnen eine mögliche Trendänderung an. Seien Sie vorsichtig und verwenden Sie diesen Indikator nicht als einzige Signalquelle.
Kostenlose Version Bitte schauen Sie sich auch unsere anderen REX-Indikatoren an. Wir haben auch andere kostenlose Indikatoren.
"OLD BUT GOLD"
FREE

Das Dienstprogramm " Loss Control Panel " ist ein Informationspanel für die Verlustkontrolle. In den Eingabeparametern legt der Benutzer die anfängliche Einlage und die zulässige Mindestgröße des Eigenkapitals fest, bei deren Erreichen alle Aufträge, einschließlich der schwebenden Aufträge, zwangsweise geschlossen werden, um den Verlust von Geldern zu verhindern. Es ist auch möglich, das Farbschema des Panels im Detail festzulegen. Das Panel zeigt die folgenden Daten an: Starteinlage Starteinlag
FREE

Der Indikator "AutoDiMA " zeichnet einen gleitenden Durchschnitt mit einer dynamischen Periode, die durch den Standardindikator "Average True Range (ATR) " auf dem Chart im Hauptfenster berechnet wird. Wenn sich "ATR " im Wertebereich zwischen dem oberen und dem unteren Niveau ändert, dann ändert sich die Variationsperiode des gleitenden Durchschnitts in dem angegebenen Bereich. Das Prinzip der Beschleunigung oder Verlangsamung des gleitenden Durchschnitts wird in den Einstellungen durch den Par
FREE
Trading System Signals ist ein Indikator, der Handelspfeile erzeugt. Er generiert Handelspfeile mit seinem eigenen Algorithmus. Diese Pfeile geben Kauf- und Verkaufssignale. Der Indikator malt natürlich nicht nach. Er kann für alle Paare verwendet werden. Sendet ein Signal an den Benutzer mit der Alarmfunktion.
Handelsregeln Geben Sie das Signal ein, wenn das Kaufsignal eintrifft. Um aus der Transaktion auszusteigen, muss ein gegenteiliges Signal empfangen werden. Es ist unbedingt notwendig, di
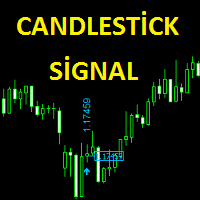
Der Candlestick-Signal-Indikator generiert Signale anhand einer Reihe von Indikatoren und einer Reihe von Kerzenmustern. Er ermöglicht es Ihnen, mit diesen Signalen zu arbeiten. Merkmale
Funktioniert bei allen Währungspaaren. Funktioniert in allen Perioden. Einstellung der Empfindlichkeit. Sie können die Signalfrequenz einstellen. Verwenden Sie die empfohlenen Standardeinstellungen. Die größte Besonderheit dieser Anzeige ist die Möglichkeit des manuellen Martingals.
Der Bereich der Signalintensi
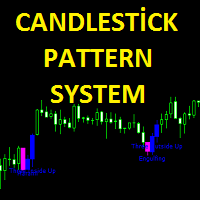
Das Candlestick-Muster-System findet 40 Kerzenformationen. Funktionen Verfügt über die Funktion, eine Benachrichtigung zu senden. Es hat Candlestick-Muster-Funktion. Bullish Muster Funktion. Funktion für bärische Muster. Trendfilter und Zuverlässigkeitsfunktionen.
Parameter Alarm anzeigen - Alarm senden E-Mail senden - Alarme an eine E-Mail-Adresse senden. Rückblick - Rückwirkende Berechnung ===MUSTER-EINSTELLUNG=== Bullische Muster anzeigen - Open-Close-Funktion Baisse-Muster anzeigen - Öffnen
Tapferer Mann EA Brave man EA ist ein Martin-ähnliche EA, von Martin's Theorie, aber das Risiko ist viel niedriger als Martin's, integrierte Risikokontrolle, so dass Sie nicht wie reine Martin EA, nach zehn Jahren historischer Daten Überprüfung, wiederholte Revision Strategie, habe ich gerade veröffentlicht, im Einklang mit Investoren und Nutzer verantwortlich für Vorsicht ist klug. Über die Parameter
Steuerung : Sie können diesen EA steuern, wie Sie möchten. Reap profit1 und Reap profit1 :Profi
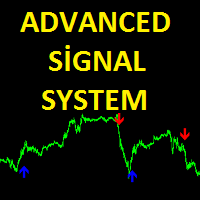
Advanced Signal System ist ein Indikator, der Handelspfeile erzeugt. Er generiert Handelspfeile mit seinem eigenen Algorithmus. Diese Pfeile geben Kauf- und Verkaufssignale und können für alle Paare verwendet werden. Sendet ein Signal an den Benutzer mit der Alarmfunktion. Der Indikator wird natürlich nicht neu gezeichnet.
Handelsregeln Geben Sie das Signal ein, wenn das Kaufsignal eintrifft. Um aus der Transaktion auszusteigen, muss ein entgegengesetztes Signal empfangen werden. Es ist unbedin
Tai Chi EA Tai Chi EA ist nach dem systemeigenen Indikator Written。Strong trend capability,you can be try. Als die kenntnisreichste Person der Welt, habe ich die Parameter auf die optimalen Parameter eingestellt, können Benutzer direkt verwenden, ohne Änderung. Verwenden Sie die Standardeinstellungen. Broker: ECN-Broker, niedrige Kommunikation / Kommission, 1:400 Leverage, nicht FIFO oder FIFO. Wenn Sie mit verschiedenen Währungspaaren handeln möchten, ändern Sie bitte die Parameter BM und SM. B
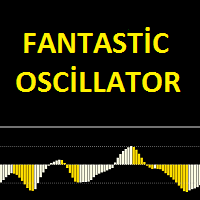
Der Indikator Fantastic Oscillator ist ein Oszillator zur Berechnung von Trendumkehrpunkten. Eine Reihe von Balkenberechnungen und eine Reihe von Algorithmen zur Berechnung von Trendumkehrpunkten. Level-Sondierungssystem mit hoher Trendwahrscheinlichkeit. All diese Funktionen machen es den Anlegern leichter, Trends zu finden.
Vorschläge und Funktionen Der fantastische Oszillator-Indikator verfügt über zwei Niveaus. Sie liegen bei den Werten 0,5 und -0,5. Der Oszillatorbalken sollte unter -0,5 l
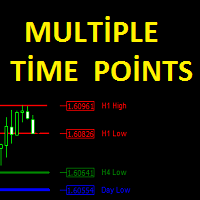
Der Indikator "Multiple Time Points" zeigt die Hoch- und Tiefpunkte der Kerzen an. Er zeigt auch die Hoch- und Tiefpunkte von 4 verschiedenen Zeiträumen an. Alle Grafiken erscheinen auf einem einzigen grafischen Bildschirm. Die derzeit verwendeten Zeitfenster sind H1, H4, D1, W1. Parameter Linienstil - Einstellung des Linienstils. H1 Farbe - Einstellung der H1 Farbe. H4-Farbe - Einstellung der H4-Farbe. Farbe Tag - Einstellung der Farbe D1 Farbe der Woche - Einstellung der Farbe W1. H1-Breite -

Dieser Indikator wurde entwickelt, um die Differenz zwischen dem RSI-Kurs und dem Indikator zu ermitteln. Dieser Indikator zeigt die Differenz zwischen Kurs und Indikator auf dem Bildschirm an. Der Benutzer wird mit der Funktion zum Senden von Alarmen benachrichtigt. Unsere beliebten Produkte Super Oszillator HC Kreuzsignal Super Cross Trend Starker Trend Super Signal
Parameter divergenceDepth - Tiefe der Suche des 2. Referenzpunktes RSI_Period - Zweiter Berechnungszeitraum indAppliedPrice - An
Dieser Indikator wurde entwickelt, um die Differenz zwischen dem MACD-Kurs und dem Indikator zu ermitteln. Dieser Indikator zeigt die Differenz zwischen Kurs und Indikator auf dem Bildschirm an. Der Benutzer wird mit der Funktion zum Senden von Alarmen benachrichtigt. Unsere beliebten Produkte Super-Oszillator HC Kreuz-Signal Super Cross Trend Starker Trend Super Signal
Parameter divergenceDepth - Tiefe der Suche des 2. Referenzpunktes Schnelles Ema - Einstellung des schnellen Ema Slow ema - Ei

Volatilitätsjäger
VolatilityHunter ist ein intelligenter Expert Advisor, der ungewöhnlich hohe Bewegungsbalken in einer csv-Datei aufzeichnet.
Die von VolatilityHunter generierte csv-Datei finden Sie in:
Dateien/VolatilityHunter/{BROKER_NAME}/{PAIR_NAME} [{TIME_FRAME}].csv
Anschließend ist es möglich, die csv-Daten mit einem Wirtschaftskalender wie z.B.:
https://www.investing.com/economic-calendar/ für weitere Analysen.
EMPFEHLUNGEN:
Verwenden Sie die in die GMT-Zeitzone umgewandelten Histor
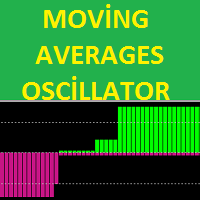
Der MA-Oszillator-Indikator ist ein Trendindikator, der aus gleitenden Durchschnittsindikatoren besteht. Er wurde aus 4 gleitenden Durchschnittsindikatoren gebildet. Dieser Indikator wird verwendet, um Trends zu finden. Er ist auch mit anderen Indikatoren kompatibel, die sich zum Strecken eignen. Der Indikator ist außerdem mehrzeitrahmenfähig (MTF).
Merkmale Auf der Anzeige befinden sich zwei Kanallinien. Dies sind die Kanallinien 3,5 und -3,5. Das 3,5er-Niveau ist der überkaufte Bereich Das Ni

EZT_Stochastisch Dies ist ein Multi Timeframe Stochastik Indikator, mit farbigem Hintergrund. Der farbige Hintergrund kann auf verschiedene Farben eingestellt werden, basierend auf der K- und D-Linie (auf- oder absteigend), und auch über die Position der Linien. In den überverkauften oder überkauften Zonen können Sie verschiedene Farben wählen. Einstellungen: Sie können den Zeitrahmen wählen, in dem Sie die Stochastik sehen möchten. Stellen Sie die regulären Parameter auf die gleiche Weise ein w

Dieser Cross-Trend-Signalindikator verwendet Donchian-Kanal- und ATR-Indikatoren. Dieses Trendfolgesystem verwendet historische Daten zum Kauf und Verkauf. Dieser Indikator malt nicht neu. Der Punkt, an dem das Signal gegeben wird, ändert sich nicht. Sie können ihn in allen Grafiken verwenden. Sie können ihn für alle Paare verwenden. Dieser Indikator zeigt die Eingangs- und Ausgangssignale als Pfeile und Alarm an. Offene Long-Geschäfte bei blauen Pfeilen Offene Short-Geschäfte durch rote Pfeile
Der Channel Trade System Indikator ist ein Indikator, der für den Handel mit Kanälen entwickelt wurde. Nur durch diesen Indikator kann schön von selbst getan werden. Dieser Indikator besteht aus einem gleitenden Durchschnitt und einigen Algorithmen.
Eigenschaften und Vorschläge Die Anzeige hat 4 Kanäle. Es gibt eine Haupttrendlinie. Die Signallinie ist der dicke Kanal mit der Farbe Magenta. Um zu handeln, ist es ratsam, mit der magentafarbenen Kanallinie zu beginnen. Es wird eine Kanalberechnun

TREND REBORN ist ein nicht nachzeichnender Indikator, der Ihnen den Trend des Marktes anzeigt kann als Trendfilter oder als Einstiegs- oder Ausstiegshilfe verwendet werden KAUFEN, wenn der Indikator blau ist und VERKAUFEN, wenn der Indikator nur orange ist Der Indikator kann allein oder zusammen mit einem anderen Indikator verwendet werden, je nach Ihrer Handelsstrategie
Zeitrahmen Alle Timeframes können gehandelt werden Währungspaare Alle Währungspaare können gehandelt werden

Grade Day Der Indikator für Trendlinien von Unterstützung und Widerstand, berechnet für einen Tag. Der Indikator zeigt seine Messwerte nicht in einer Chartperiode von mehr als 4 Stunden an. Beschreibung der Einstellungen color_1 - Farbe der dritten Hilfslinie width_1 - Dicke der dritten Stützlinie style_1 - Stil der dritten Supportlinie color_4 - Farbe der zweiten Unterstützungslinie width_4 - Dicke der zweiten Stützlinie style_4 - Stil der zweiten Unterstützungslinie color_6 - Farbe der erste

Markt Skanner Baks ist ein neuer Indikator für Markt-Scanner. Dieser Indikator ist mit einem neuen Algorithmus zur Bestimmung des Trends ausgestattet. Jetzt muss der Händler nicht Dutzende verschiedener Indikatoren analysieren, um die Richtung der Preisbewegung zu bestimmen. Es reicht aus, auf das Market-Scanner-Baks-Diagramm zu setzen und zu sehen, wo der Pfeil in den großen und kleinen Zeitrahmen angezeigt wird. So kann man die kurzfristige und langfristige potentielle Preisbewegung verstehen.

MT5-Version hier
Der Flexible Grid EA verwendet den RSI-Indikator, um den Handel einzugehen. Um in den Kauf einzusteigen, muss der RSI den in den EA-Parametern angegebenen Wert von unten nach oben kreuzen (für den Verkauf hingegen von oben nach unten).
Im Falle eines erfolgreichen Einstiegs wird die Transaktion entweder mit dem Take Profit oder dem Trailing Stop geschlossen.
Wenn sich der Markt in die entgegengesetzte Richtung bewegt, wird das Order-Gitter in einem bestimmten Abstand zum Dur

ClosureMaster Utility schließt alle Aufträge und bietet 7 zusätzliche Modi. Wenn Sie Dutzende oder gar Hunderte von Aufträgen haben und diese alle oder einige davon selektiv nach Kommentar, magischer Zahl, nur Kauf, nur Verkauf, wenn kein Stop Loss gesetzt ist, nur profitable oder nur Verlustgeschäfte schließen wollen, dann kann ClosureMaster Utility diese Aufgabe übernehmen.
Externe Parameter:
Alle verlierenden Trades schließen Alle gewinnbringenden Geschäfte schließen Alle Aufträge ohne Stop L
FREE
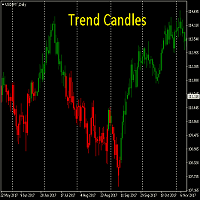
Erkennen Sie den TREND auf den ersten Blick. Die Fähigkeit, sofort zu erkennen, in welche Richtung sich der Markt bewegt. Dies ist ein Muss für alle Trendhändler. Funktioniert auf allen Zeitrahmen. Kein Optimieren erforderlich
Wiederholt sich nicht, wenn die Kerze geschlossen ist Die Trendkerzen sind ein großartiges Werkzeug, um die Standardkerzen zu ersetzen. Sie helfen auch, die Unordnung auf Ihren Charts zu reduzieren und zeigen Ihnen, was Sie sehen müssen - RICHTUNG
Werden Sie Mitglied in m

Dieser äußerst informative Indikator verwendet überkaufte/überverkaufte Niveaus für eine genauere Darstellung der Marktsituation. Alle Einstellungen des gleitenden Durchschnitts sind verfügbar, einschließlich der Art des Durchschnitts und des Preises, auf dem er basiert. Es ist auch möglich, das Aussehen des Indikators zu ändern - Linie oder Histogramm. Zusätzliche Parameter ermöglichen eine noch feinere Abstimmung, wobei der Handel innerhalb des Kanals und entlang eines Trends erfolgen kann.
B

Einfachheit ist eine notwendige Bedingung für Schönheit (c)
Leo Tolstoi
Dieser Experte wurde für die Meisterschaft 2008 entwickelt. In jenem Jahr belegte er Platz 25.
Das empfohlene Instrument ist GBP, Zeitrahmen M30.
Es werden Transaktionen eröffnet, um zur berechneten Mittellinie zurückzukehren.
Experten-Optionen:
minlot - das minimale Lot;
maxlot - das maximale Lot;
UseEquityStop - Stop nach Eigenkapital verwenden;
TotalEquityRisk - Prozentsatz des Drawdowns;
slip - Schlupf.

Bollinger Bands Breakout Alert ist ein einfacher Indikator, der Sie benachrichtigen kann, wenn der Preis aus den Bollinger Bands ausbricht. Sie müssen nur die Parameter der Bollinger Bands festlegen und bestimmen, wie Sie benachrichtigt werden möchten.
Parameter: Name des Indikators - wird als Referenz verwendet, um zu wissen, woher die Benachrichtigungen kommen Bands Periode - ist die Periode, die für die Berechnung der Bollinger Bands verwendet wird Bands Shift - ist die Verschiebung, die für
FREE

Binäre Optionen Tester Trading-Panel, um Ihre Strategien nach den Regeln der binären Optionen zu testen. Umfang: Legen Sie den Prozentsatz der Gewinn aus der Transaktion. Legen Sie die Ablaufzeit in Sekunden. Legen Sie die Wette GrößeSetzen Sie den Einzahlungsbetrag. Machen Sie mehrere Geschäfte in einer Reihe. Behalten Sie den Überblick über die Zeit vor Ablauf. Die Tick-Chart mit Handel Ebenen wird auf ein zusätzliches Fenster für die Genauigkeit dupliziert. Es ermöglicht Ihnen, sowohl in der
FREE

Needle ist ein Berater, der auf den Ausbruch von Unterstützungs- und Widerstandsniveaus handelt. Der Handel erfolgt mit schwebenden Aufträgen. Um die Position zu stützen, wird ein Trailing-Stop verwendet.
Empfehlungen Währungspaar: EURUSD; Genauigkeit: 5 Zeichen; Zeitrahmen: M5, M15, M30, H1; Empfohlener Leverage: ab 1:100 und höher; Mindesteinlage: $ 100; Vor der Installation auf einem Live-Konto, testen Sie mit minimalem Risiko; Broker mit niedrigen Spreads und niedriger Kommission.
Einst

Der Indikator Universal Main Window arbeitet nach Ihren Regeln. Es reicht aus, eine Formel einzugeben, entlang derer die Linie des Indikators gezeichnet werden soll.
Dieser Indikator ist für die Verwendung im Hauptdiagrammfenster vorgesehen.
Alle Indikatoren der Serie Universal :
Hauptfenster Separates Fenster Kostenlos MT4 Universal Hauptfenster Frei MT5 Universelles Hauptfenster Free MT5 MT4 Universal Separates Fenster Frei MT5 Universelles separates Fenster Frei MT5 Vollständig MT4 Universal

Der Indikator Universal Separate Window arbeitet nach Ihren Regeln. Es reicht aus, eine Formel einzugeben, entlang derer die Linie des Indikators gezeichnet werden soll.
Dieser Indikator ist für die Verwendung im separaten Chartfenster vorgesehen.
Alle Indikatoren der Serie Universal :
Hauptfenster Separates Fenster Kostenlos MT4 Universal Hauptfenster Frei MT5 Universelles Hauptfenster Free MT5 MT4 Universal Separates Fenster Frei MT5 Universelles separates Fenster Frei MT5 Vollständig MT4 Uni
Dieser Scanner ist ein Werkzeug, das zur Unterstützung des Handels verwendet wird. Der Scanner sucht auf einem breiten Markt in Echtzeit nach Setups, die durch gegenseitige Anordnung von Kerzen (Kerzenmuster) entstehen. Seine Hauptmerkmale sind: 8 implementierte Handels-Setups (es ist möglich, weitere Setups, zusätzliche Versionen des Scanners hinzuzufügen), die Möglichkeit des gleichzeitigen Scannens aller Finanzinstrumente, die auf der Plattform verfügbar sind, die Möglichkeit des gleichzeitig
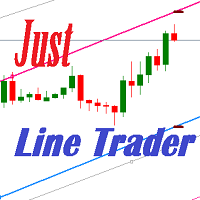
JustLineTrader ist ein EA für den manuellen Handel mit einfach zu bedienenden grafischen Objekten. Es gibt 6 Linien, nämlich Buy Line, TP Buy Line, SL Buy Line, Sell Line, TP Sell Line und SL Sell Line. 6 Die Linie ist eine Trendlinie, die wir manuell auf dem Chart installiert haben. Wenn der Kurs die Linie erreicht, wird die Order auf dem Panel Line Day Trade ausgeführt. JustLineTrader besteht aus einem Panel-Bereich für den manuellen Handel und Teil 6 Linien für die Installation von Trendlinie
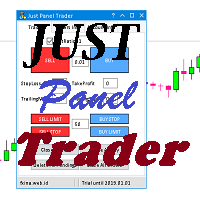
JustPanelTrader ist ein EA für den manuellen Handel mit grafischen Objekten, der einfach zu bedienen ist. Der Handel erfolgt durch Anklicken der Schaltfläche auf dem Panel Die Schaltfläche besteht aus Verkaufen: Um einen Verkaufsauftrag zu erteilen Kaufen: Zum Platzieren eines Verkaufsauftrags SellLimit: Zum Einrichten eines Verkaufsauftrags SellStop: Zum Einrichten einer schwebenden Verkaufsorder CloseAll: Schließt alle Orders und Pending Orders SchließenAnhängigeOrder: Zum Löschen aller schweb

Dieser Indikator zeigt nicht nur eine Linie des Preisgleichgewichts an, sondern prognostiziert es auch für die angegebene Anzahl von Balken in der Zukunft. Das heißt, das Niveau des wahrscheinlichen Gleichgewichts des Preises spiegelt sich auf dem Diagramm in der Zukunft wider. Das Niveau des Gleichgewichts wird mit dem Parameter Balance festgelegt, d.h. es kann auf einem beliebigen Niveau gezeichnet werden. Vorhersage der Zukunft mit dem Parameter Shift . Der Indikator gibt Informationen in vis

Dies ist das komplette REX-Paket. Es besteht aus der Lite-, Pro- und ULTRA-Version.
Perfekt für Anfänger und Fortgeschrittene. REX complete ist zu 100% nicht nachgezeichnet. Die Strategie basiert auf einer Mischung aus verschiedenen Strategien, Statistiken, einschließlich Pivotpunkten, Oszillatoren und Mustern. Da die Handelsidee aus einer Vielzahl von einigen klassischen Indikatoren wie Momentum, Williams Percent Range, CCI, Force Index, WPR, DeMarker, CCI, RSI und Stochastic besteht, ist es k
Erfahren Sie, wie man einen Handelsroboter im MetaTrader AppStore, dem Shop für Applikationen für die MetaTrader Handelsplattform, kaufen kann.
Das Zahlungssystem der MQL5.community ermöglicht Zahlungen mit PayPal, Kreditkarten und den gängigen Zahlungssystemen. Wir empfehlen Ihnen eindringlich, Handelsroboter vor dem Kauf zu testen, um eine bessere Vorstellung von dem Produkt zu bekommen.
Sie verpassen Handelsmöglichkeiten:
- Freie Handelsapplikationen
- Über 8.000 Signale zum Kopieren
- Wirtschaftsnachrichten für die Lage an den Finanzmärkte
Registrierung
Einloggen
Wenn Sie kein Benutzerkonto haben, registrieren Sie sich
Erlauben Sie die Verwendung von Cookies, um sich auf der Website MQL5.com anzumelden.
Bitte aktivieren Sie die notwendige Einstellung in Ihrem Browser, da Sie sich sonst nicht einloggen können.