First Derivative of MACD
- Indikatoren
- Version: 1.1
- Aktualisiert: 11 November 2018
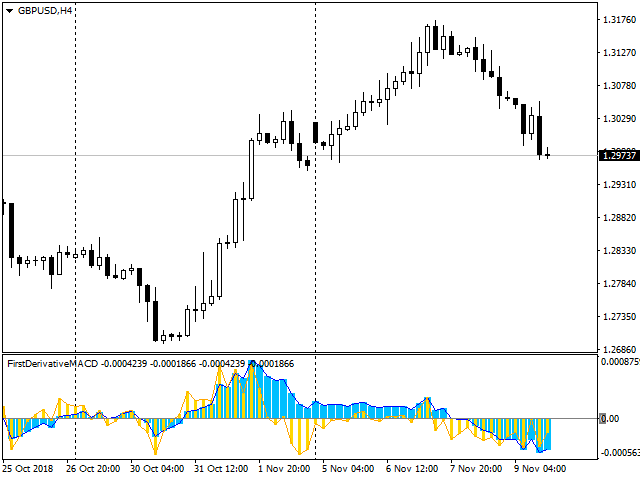
Der Indikator zeigt die ersten Ableitungen der beiden MACDs an. In der Standardeinstellung ist der gelbe MACD schneller als der blaue MACD. In den Einstellungen können Sie die Parameter für jeden der MACDs nach Ihren Bedürfnissen einstellen. Ein gleichzeitiger Wechsel des Vorzeichens der Ableitungen kann ein zusätzliches Umkehrsignal sein.
Eingabe-Parameter
- Gelber MACD schnelle EMA-Periode
- Gelber MACD langsame EMA-Periode
- Blauer MACD schnelle EMA-Periode
- Blauer MACD langsame EMA-Periode