Momentum solo
- 指标
- 版本: 24.4
- 更新: 17 四月 2024
- 激活: 20

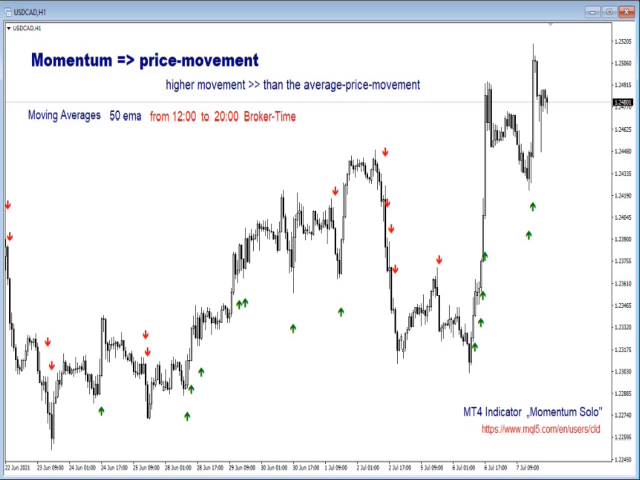
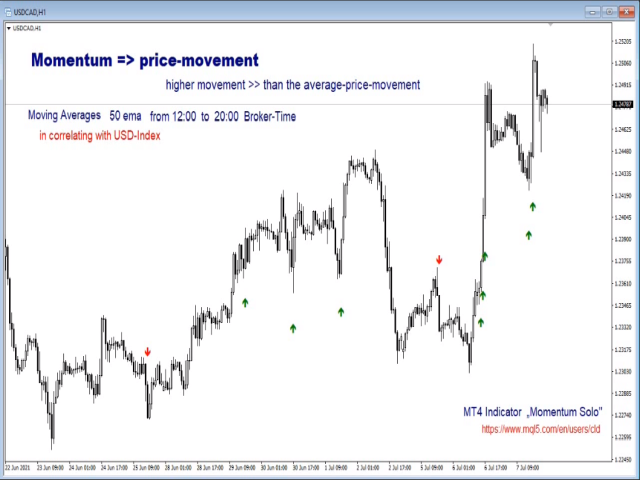
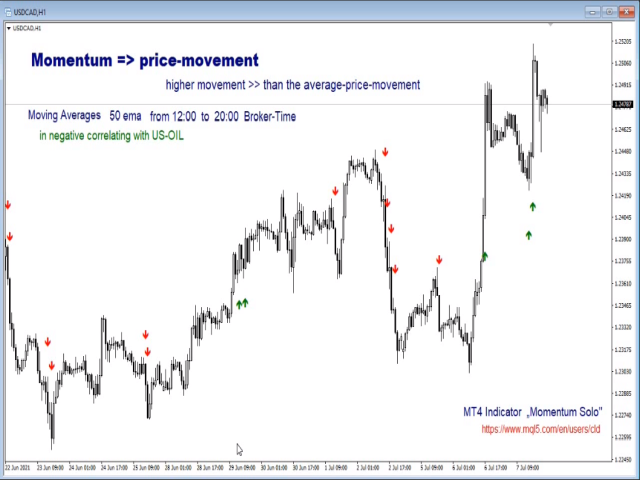
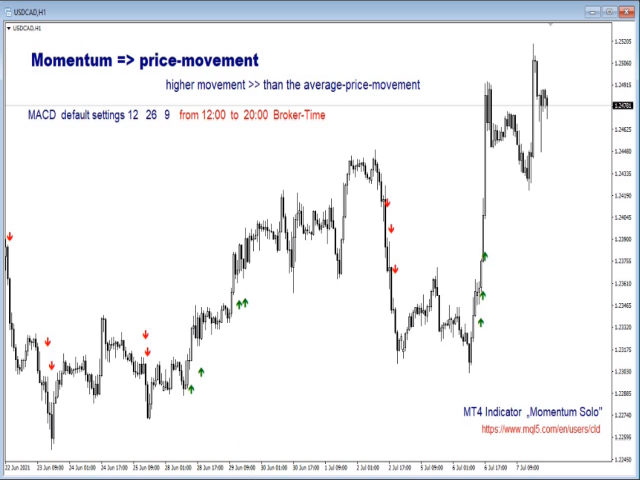
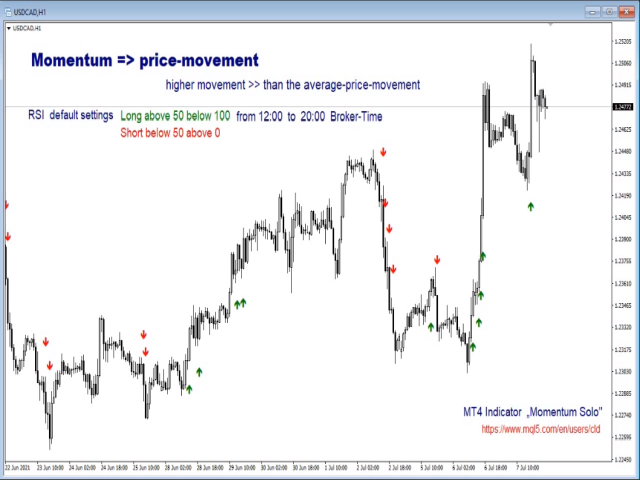
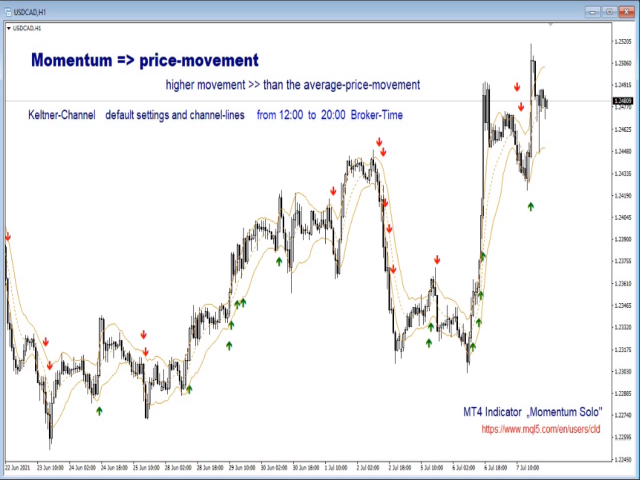
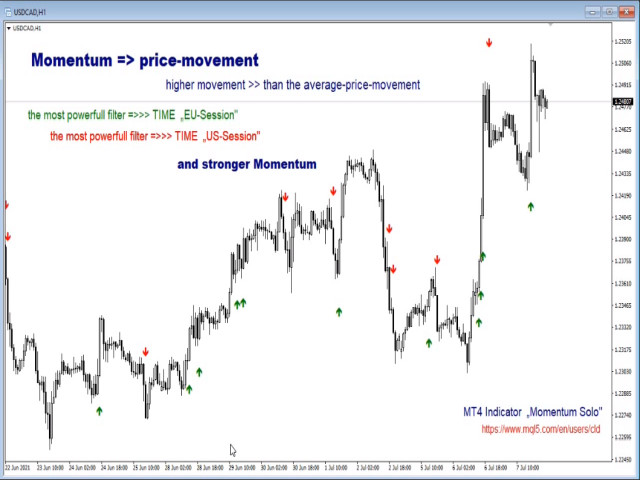
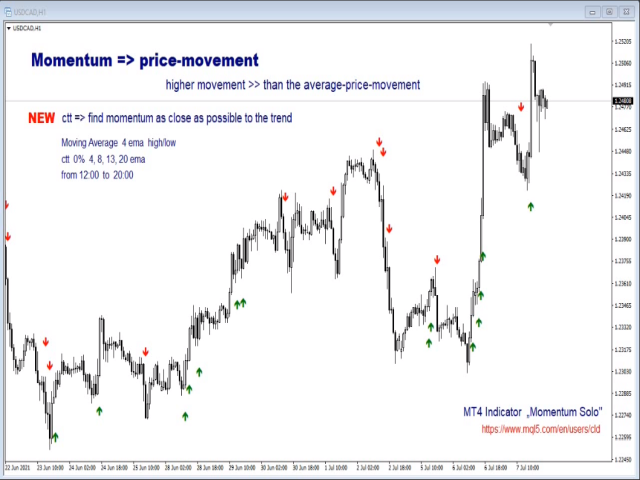
true Momentum - time-based Indicator
- it will inform about Momentum, a strong impulse in the appropriate direction
- it's based on a self-developed candle Pattern, in relation to the ATR (Average True Range)
- the indicator is ready to use
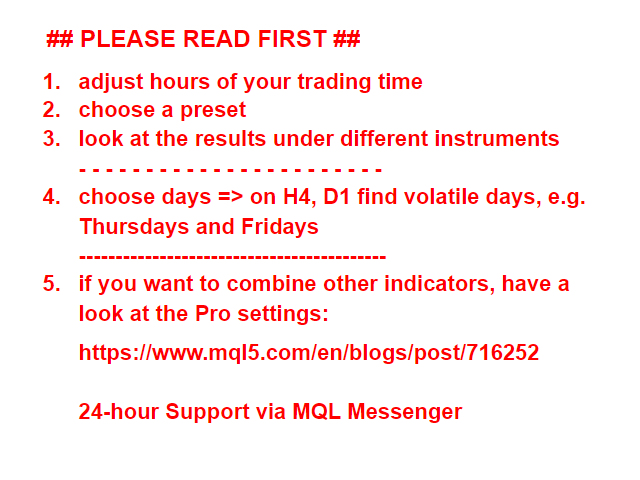
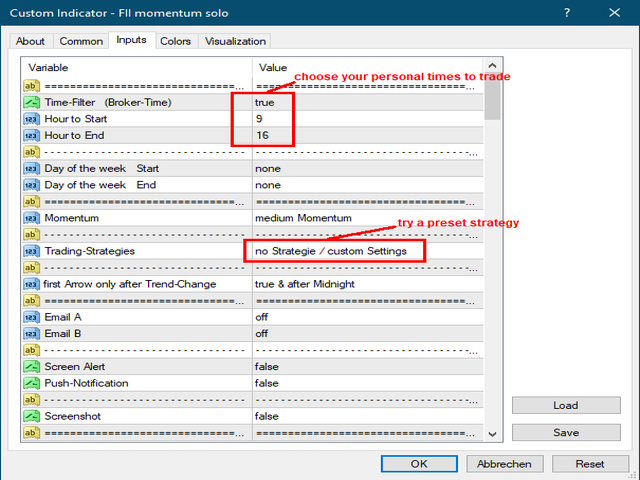
- choose your personal times to trade
Quick Start:
- try an indicator-preset
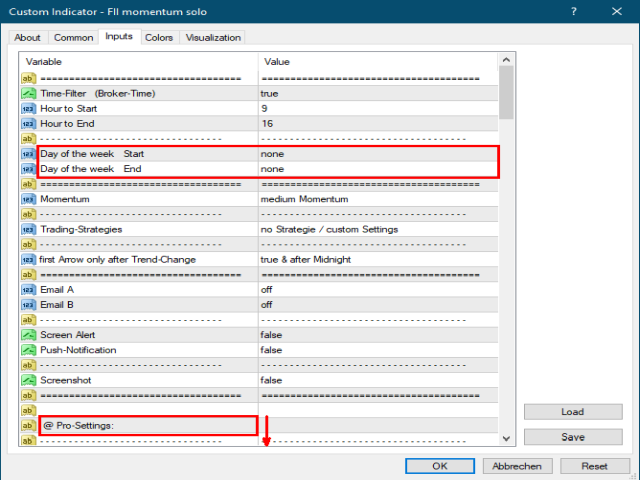
- or use an additional indicator, below the pro-settings
- Hours
- Weekdays
- Moving Averages
- Correlation Instruments - Moving Averages
- MACD
- RSI
- ADX
- PSAR
- Stochastic
- Bollinger Bands
- Keltner-Channel
- Change of Tick-Volume
- Coffee-Break, based on Rob Hoffman's Inventory Retracement Bar (IRB)
- Close to Trend => avoids too many signals while the trend runs, use 4 Moving Averages
- emails
- screenshot
- screen-alert
- push-notification
Alerts
Advantages
- select Hours and Weekdays
- Signal after close - no repaint
- send custom email header / content
- sideways movement will be hidden, as good as possible
- for more, please go to: https://www.mql5.com/en/blogs/post/716252


This indicator is my go-to. I have had it for years now, and Momentum Solo has stood the test of time. The author's constant upgrades speak to his dedication and conscientiousness. Five stars! Well deserved.