Statistics of price movements

How to find out where to expect a price reversal with a probability of 80% - 90%?

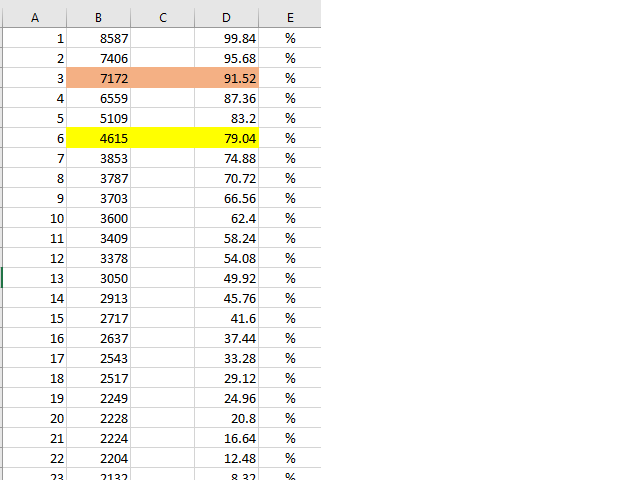
The "Statistics of Price Movements" indicator collects statistics of significant price movements, skipping all small pullbacks, for a certain period of time and displays them in
Excel file.

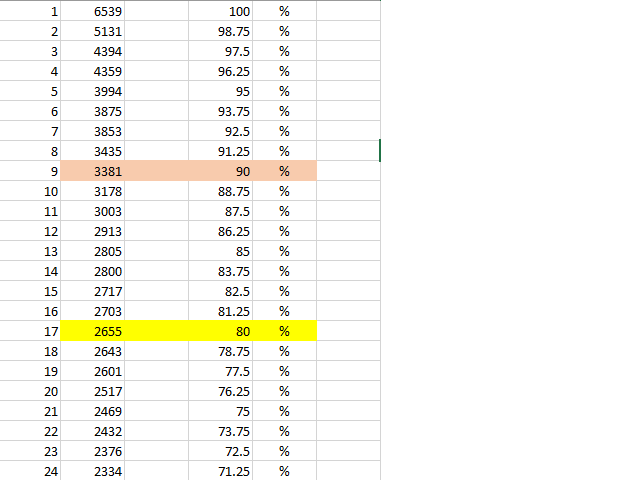
Sort the data in ascending order and get statistics of price reversals in 80%, 85%, 90%, 95% of all cases! (for example, in 2 years!)

After the reversal, the price will move from 1000 pips or more!

So...

Open the daily chart of the instrument. We set the indicator and set to watch the history for 2 years (for example. You can also 3, 4 years).

Set the Constant of the movement in pips (1000, 1500 or 2000 pips) and OK.

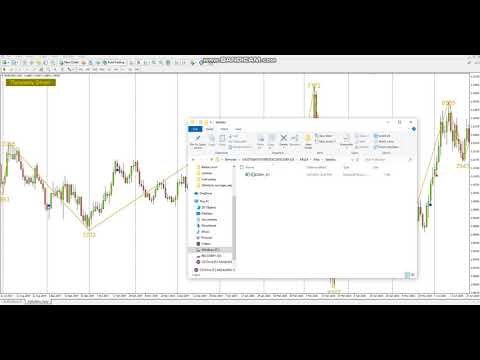
Click the "Get Report" button and open the Excel file.

Report files are saved along the path: "Open Data Folder \ MQL4 \ Files \ Statistic \ EURUSD_D1.csv",

Sort your data from great to small.

Divide 100% by the number of movements (1st column) and find out the percentage of one movement.

The resulting value is multiplied by an ordinal number. An example is below in the video.

We get the probability in which out of 100 percent there is a significant movement.

Thus, you can subtract a price reversal with a probability of 80 - 90 percent!

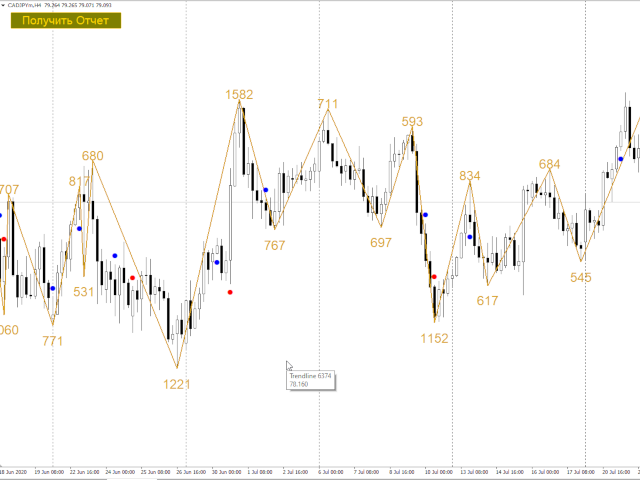
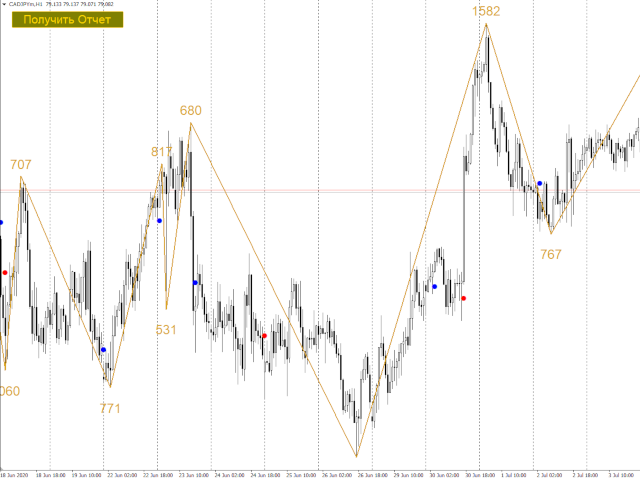
Thus, we have learned the motion value at 80% - This will be Level 1, and we enter the movement into level 2 with a 90% probability!

When the price reaches the 1st level, a dot will appear under (above) the price bar and there will be an alert! So it is with the 2nd level!

And it's all just math and numbers!

Trade with a probability of 80-90% !!!
推荐产品
Draw by Hand Tool
John Louis Fernando Diamante
This tool provides a freehand drawing method, to treat the chart space as a blackboard and draw by-hand. Drawings can be made to stick to the CHART (moves with chart scroll), or to stick to the WINDOW (does not move with chart scroll). Features: all drawings are individually styled, color, width show/hide each drawing type delete last drawing drawings, on chart and on window, remain through TF changes and terminal re-starts, until the indicator is removed Panel: stylable colors scalable in size
Trend Code
Ning Liu
4 (1)
Trend Code 趋势码指标 趋势码指标是个简单而有效的指标,能够捕捉价格趋势,检测趋势反转信号,计算入场价格及止损价格。 趋势码指标是由一序列的颜色块组成,浅蓝色代表牛市,红色代表熊市。熊市块指标开盘价是方块上边,指标收盘价是方块下边,牛市则相反。 主要参数 TrendOpenAdjustment   = 0.8, (range 0~1.0) TrendCloseAdjustment = 0.75, (range 0~1.0) TrendStopAdjustment = 0.5, (range 0~1.0) EnableKeyPriceLabel = true or false TrendOpenAdjustment 计算趋势快的开盘价 TrendCloseAdjustment 计算趋势快的收盘价 TrendStopAdjustment 计算推荐的趋势止损价 EnableKeyPriceLabel 选项为计算推荐关键价位 主要功能 一. 没有延迟,在一个图标时间周期内保持色彩形状不变。 二. 捕捉趋势 三. 检测趋势反转 四. 计算入场价 五. 计算止损价 六. 计算关键价,可
SpeedAngle
Davit Beridze
SpeedAngle 指标 是一款先进的 MetaTrader 4 工具,可计算价格运动角度,提供动态视觉提示和可自定义的警报,帮助交易者识别趋势反转和动量变化。 主要功能 基于角度的趋势分析: 通过用户定义的周期计算角度,显示价格动量和方向。 动态视觉效果: 显示根据角度阈值变化颜色的彩色圆圈: 高于 LevelMax: 表示强劲的上升动量。 低于 LevelMin: 表示强劲的下降动量。 在范围内: 表明价格整合或轻微波动。 可自定义警报: 提供“从极值”或“从中间”两种场景的警报,并支持声音、电子邮件和推送通知。 买入/卖出箭头: 可选箭头显示潜在交易信号。 高度可配置: 调整阈值、颜色、警报设置等。 优点 简化市场分析: 通过视觉提示和警报快速识别关键价格条件。 节省时间: 警报通知您交易机会,无需时刻监控图表。 适合任何策略: 可用于短线交易、波段交易和趋势跟随策略。 输入参数亮点 计算: 定义回溯周期( StartBar )和历史数据限制( MaxBarsHistory )。 视觉效果: 自定义圆圈和线条颜色。 警报: 启用声音、电子邮件或推送通知。 阈值: 设置 Leve
ADX arrow N
Pavel Shutovskiy
ADX arrow 该指标将 ADX indicator (平均方向移动指数)的信号显示为图表上的点。 这便于信号的视觉识别。 该指示器还具有警报(弹出消息框)和向电子邮件发送信号。          参数 Period   -平均周期。 Apply to -用于计算的价格:关闭,开放,高,低,中位数(高+低)/2,典型(高+低+关闭)/3,加权关闭(高+低+关闭+关闭)/4。 Alert   -启用/禁用警报。 EMail   -启用/禁用向电子邮件发送信号。 Push -启用/禁用发送信号推送 Period  - averaging period. Apply to  - price used for calculations: Close, Open, High, Low, Median (high+low)/2, Typical (high+low+close)/3, Weighted Close (high+low+close+close)/4. Alert  - enable/disable alerts. EMail  - enable/disable sen
Crypto_Forex 指标“上吊线和倒锤线形态”适用于 MT4。 - 指标“上吊线和倒锤线形态”是价格行为交易的非常强大的指标:无需重绘,无延迟。 - 指标可检测图表上的看涨倒锤线和看跌上吊线形态: - 看涨倒锤线 - 图表上的蓝色箭头信号(见图片)。 - 看跌上吊线 - 图表上的红色箭头信号(见图片)。 - 带有 PC、手机和电子邮件提醒。 - 指标“上吊线和倒锤线形态”非常适合与支撑/阻力位和挂单结合使用。 ................................................................................... Click here to see high quality Trading Robots and Indicators! 这是仅在此 MQL5 网站上提供的原创产品。
Rainbow Price Visualizer
Vincent Jose Proenca
Rainbow Price Visualizer v1.21 See where the market really breathes. Turns your MT4 chart into an ultra-precise heatmap that highlights price zones favored by big players. Why it matters 300 price levels at 0.2‑pip resolution — microscopic detail. 8 visual themes (Rainbow, Fire, Ocean…) for instant readibility. Smart opacity: low noise fades, real zones pop. Lightweight rendering with automatic cleanup. Fully customizable: saturation, opacity, resolution, history depth. Bands project into the f
ADX arrow
Pavel Shutovskiy
5 (1)
ADX arrow 该指标将   ADX indicator   (平均方向移动指数)的信号显示为图表上的点。 这便于信号的视觉识别。 该指示器还具有警报(弹出消息框)和向电子邮件发送信号。          参数 Period     -平均周期。 Apply to   -用于计算的价格:关闭,开放,高,低,中位数(高+低)/2,典型(高+低+关闭)/3,加权关闭(高+低+关闭+关闭)/4。 Alert     -启用/禁用警报。 EMail     -启用/禁用向电子邮件发送信号。 Period  - averaging period. Apply to  - price used for calculations: Close, Open, High, Low, Median (high+low)/2, Typical (high+low+close)/3, Weighted Close (high+low+close+close)/4. Alert  - enable/disable alerts. EMail  - enable/disable sending s
FreqoMeterForecast
Stanislav Korotky
The main idea of this indicator is rates analysis and prediction by Fourier transform. Indicator decomposes exchange rates into main harmonics and calculates their product in future. You may use the indicator as a standalone product, but for better prediction accuracy there is another related indicator - FreqoMaster - which uses FreqoMeterForecast as a backend engine and combines several instances of FreqoMeterForecast for different frequency bands. Parameters: iPeriod - number of bars in the ma
Naked Forex Big Shadow IndicatorBig Shadow Indicator is a pattern recognition indicator for Forex, Stocks, Indices, Futures, Commodities and Cryptos. When you have a Big Shadow on your chart then this is a strong signal meaning that you might be ahead of a reversal. You can take other elements (momentum, trend, volatility, price action, fundamentals) to build a complete strategy and confirm your entries. Beware that you might not make money just following the arrows generated by the pattern reco
Smart Reversal Signal
Evgeny Belyaev
3 (2)
Smart Reversal Signal  is a professional indicator for the MetaTrader 4 platform; it has been developed by a group of professional traders. This indicator is designed for Forex and binary options trading. By purchasing this indicator, you will receive: Excellent indicator signals. Free product support. Regular updates. Various notification options: alert, push, emails. You can use it on any financial instrument (Forex, CFD, options) and timeframe. Indicator Parameters Perod - indicator calculat
This is the Full Version, to get the free version please contact me. The free version works on “USDJPY” charts. All symbols and time frames scanner. Contact me after payment to send you the User-Manual PDF File. OVER and UNDER Over & Under pattern is an advanced price action trading concept in the trading industry. The Over & Under pattern is more than a confluence pattern or entry technique than a trading strategy. It is a reversal pattern that is created after a significant obvious trend. It
The indicator of a Professional Trader is an arrow indicator for predicting the direction of price movement. I have been working on this indicator since 2014. You can use this indicator as your main indicator, use its entry signals, and use it as your only indicator to find entry points. About the product: Recommended TF [H4-D1-W1]   . The indicator predicts the direction of the next candle. Fits a variety of tools; Flexibility in settings for different instruments and intervals through the MO
FREE
ForexFire Renkotrader Recognize profitable entries & trade with confidence! Highlights: Precise signals – Identifies reversal candles in the trend EMA filter - Uses Ema`s for reliable signals Intelligent signal limiting - Only qualified signals are displayed Easy to use – Perfect for beginners & professionals Visual support - arrows in the chart + SL display in the chart Notifications – Receive alerts & push notifications This is how the indicator works: Long Signal:
Aikido
MOHAMMED IMAD HUSSEIN BASSEE
This indicator gives you the strength of currencies according to multiple frames With this indicator, you can know the true direction of the currency pair This indicator gives you good advice to bet on the best fighter If you know how to use this indicator, you do not need any other indicators This indicator is suitable for working on long-term, short or medium-term trades. This indicator is your loyal friend
Crypto_Forex MT4 版“内柱线和外柱线形态专业版”指标。无需重绘,无延迟。 - “内柱线和外柱线形态专业版”指标对于价格行为交易非常强大。 - 指标可检测图表上的内柱线形态和外柱线形态: - 看涨形态 - 图表上显示蓝色箭头信号(见图)。 - 看跌形态 - 图表上显示红色箭头信号(见图)。 - 内柱线本身具有较高的 R/R 比率(回报/风险)。 - 提供 PC、手机和电子邮件提醒。 - “内柱线和外柱线形态专业版”指标非常适合与支撑位/阻力位结合使用。 - 指标具有信息显示功能 - 显示与其关联的外汇对的当前点差和隔夜利息。 - 信息显示还显示账户余额、净值和保证金。 - 信息显示可放置在图表的任意位置 . Click here to see high quality Trading Robots and Indicators! 本产品为独家产品,仅在本 MQL5 网站上提供。
Mastodon
Yvan Musatov
Mastodon - displays potential market entry points. According to the wave theory, Mastodon displays the course of a large wave, while the oscillator can specify the entry point, that is, catch the price movement inside it, i.e. small “subwaves”. By correctly understanding the wave nature of price movements and using the Mastodon indicator in conjunction with an oscillator, you can create your own trading system, for example, entering the market after a large wave has formed and then exiting whe
Crypto_Forex 指标“CCI 带动态超卖/超买区域”,适用于 MT4,无需重绘。 - 商品通道指数 (CCI) 非常适合顺势交易,顺势而为。 - 非常适合在动态超买区域设置卖出入场点,并在动态超卖区域设置买入入场点,顺势而为。 - 此指标也非常适合与价格行动入场点结合使用。 - 动态超买区域 - 黄线上方。 - 动态超卖区域 - 蓝线下方。 - CCI 震荡指标用于测量当前价格与历史平均价格之间的差额。 - 提供 PC 和移动端提醒。 ............................................................................. Click here to see high quality Trading Robots and Indicators! 本产品为原创产品,仅在 MQL5 网站上提供。
PZ 123 Pattern
PZ TRADING SLU
1 (1)
123模式 是最受欢迎,功能强大和灵活的图表模式之一。该模式由三个价格点组成:底部,峰值或谷值以及38.2%至71.8%之间的斐波纳契回撤位。当价格突破最后一个峰值或谷值时,该形态被认为是有效的,此时指标绘制箭头,发出警报并可以进行交易。 [ 安装指南 | 更新指南 | 故障排除 | 常见问题 | 所有产品 ] 清除交易信号 可自定义的颜色和尺寸 实施绩效统计 可定制的斐波那契回撤水平 显示适当的止损和获利水平 该指标可用于查找连续或反转形态 它是不可重涂和不可重涂的 它实现了电子邮件/声音/视觉警报 123模式 可以表现为连续或反转模式。为了简化操作,该指标使您可以选择要寻找哪种类型的形态,使其成为趋势或反转交易者的绝佳工具。 设置 将指标加载到任何图表时,将显示一组选项作为输入参数。如果您认为它们太多,请不要感到失望,因为参数被分组为不言自明的块。这就是每个参数块的作用。 幅度-幅度表示替代价格点之间的最小柱线量。要找到大图案,请增加幅度参数。要查找较小的模式,请减小幅度参数。 闵。回撤-形态中所需的最小斐波那契回撤。设置为零不对其进行评估。 最大。回撤-形态中可能的最大斐
The Icarus Auto Dynamic Support and Resistance  Indicator provides a highly advanced, simple to use tool for identifying high-probability areas of price-action automatically - without any manual input whatsoever. .  All traders and investors understand the importance of marking horizontal levels on their charts, identifying areas of supply and demand, or support and resistance. It is time-consuming and cumbersome to manually update all instruments, across all timeframes, and it requires regular
我们创新的基本烛台形态仪表盘专为自动识别图表上的盈利烛台形态而设计。该仪表盘使用先进的算法实时扫描价格图表,并检测从经典到复杂的各种烛台形态。此外,它还有一个易于使用的界面,允许您在不同的时间框架上对检测到的形态进行可视化,从而轻松做出明智的决策/ MT5 版本 免费指标: Basic Candlestick Patterns 包括谐波形态 看涨形态 Hammer  Inverse hammer Bullish engulfing Morning star 3 White soldiers 看跌形态 Hanging man Shooting star Bearish engulfing Evening star 3 Black crows 指标列 Symbol: 将显示所选符号 Pattern: 形态类型(锤子型、反向锤子型、看涨吞没型......) Bar: 自检测到该形态以来所经过的柱状图数量 Age (in minutes): 自检测到该形态以来的年龄 主要输入 Symbols : 从 "28 种主要货币对 "或 "选定符号 "中选择。 Selected Symb
Quantum Entry MT4
Aleksandr Makarov
Top Quantum Entry MT4 indicator that gives signals to enter trades. Perfect entry points for currencies, cryptocurrency, metals, stocks and indices. The indicator 100% does not repaint!!! If a signal appears, it does not disappear anymore! Unlike indicators with redrawing, which lead to loss of deposit, because they can show a signal, and then remove it. Trading with this indicator is very easy. Wait for a signal from the indicator and enter the deal, according to the arrow  (Blue arrow
Keris Keramat
Mohamed Faizal Bin Che Omar
Keris Keramat is an indicator that gives you signals when to buy or sell. It is a non repainting indicator. It can be used on almost all instruments. The time frame to use   is M15. For desktop MT4 only. It’s good for Intraday or Swing Traders. Very easy to use even for a rookie trader. No need to change any parameter setting. Just plug & play. The indicator will only paint arrows, whether upward pointing arrow (for buy) or downward pointing arrow (for sell).   All arrows that painted on the ch
GeoShowCond
Georgij Komarov
致蜡烛图与技术分析专业人士! 这是您的工具! 创新的 GeoShowCond 指标让您可以快速测试自己描述的蜡烛图形态! 您可以定义基于公式的买入和卖出条件,例如: B1=close[i] > high[i+1] && low[i] > low[i+2] S1=close[i] < low[i+1] && high[i] < high[i+2] B2=close[i] > high[i+2] S2=close[i] < low[i+2] B3=close[i] > high[i+1] && low[i] < low[i+1] && low[i] < low[i+2] && low[i] < low[i+3] S3=close[i] < low[i+1] && high[i] > high[i+1] && high[i] > high[i+2] && high[i] > high[i+3] 然后指标会在图表上用矩形标出参与条件的蜡烛,并用箭头标记它们。 该指标在图表上可视化您指定的蜡烛图形态! 不再有繁琐的工作!无需再花费数小时搜寻和观察蜡烛组合。 描述它们 – 您就能看到它们
动态振荡器 - 是一种高级自定义 Crypto_Forex 指标 - 适用于 MT4 的高效交易工具! .................................................................................................... - 新一代振荡器 - 查看图片以了解如何使用它。 - 动态振荡器具有自适应超卖/超买区域。 - 振荡器是一种辅助工具,用于从超卖/超买区域找到准确的切入点。 - 超卖值:低于绿线;超买值:高于红线。 - 它比标准振荡器准确得多。合适的时间范围:M30、H1、H4、D1、W1。 - 具有 PC 和移动警报。 点击这里查看高质量的交易机器人和指标! 它是仅在此 MQL5 网站上提供的原创产品。
AW Candle Patterns MT4
AW Trading Software Limited
AW 蜡烛形态指标是高级趋势指标与强大的蜡烛形态扫描仪的组合。它是识别和突出显示 30 个最可靠的烛台形态的有用工具。此外,它是一个基于彩色条的电流趋势分析器,带有   可调整大小和定位的插件多时间框架趋势面板。根据趋势过滤调整模式显示的独特能力。 优点: 轻松识别蜡烛形态 不重绘结果 内置多时间趋势面板 禁用模式类型(1、2、3 根蜡烛) 显示形态时趋势过滤的调整 MT5 version - >   HERE   / Instructions and description  -> HERE 显示模式列表: 锤模式 固定/固定 看跌 Harami / 看涨 Harami 看跌 Harami Cross / 看涨 Harami Cross 枢轴点反转向上/枢轴点反转向下 双柱低位收盘价较高/双柱低位收盘价较低 收盘价反转向上 / 收盘价反转向下 中性条 /     两个中性条 双内/内/外 向上推力杆/向下推力杆 晚星/晨星 晚上十字星 / 早上十字星 吞没看跌线/吞没看涨线 镜子酒吧 流星 乌云盖顶 十字星 输入变量: Main settings Trend Filtering Mo
Advanced Trend Breaker Free Dashboard!!!   Advanced Trend Breaker DashBoard: https://www.mql5.com/en/market/product/66336   Breaker's smart algorithm detects the trend,Support and resistance, filters out market noise and find entry signals!!! Test the demo version and explore its features, it would be useful tool added to your trading arsenal. Do not foget down load Free DashBoard!!!   Advanced Trend Breaker DashBoard !!! Advantages You Get Easy, visual and effective trend detection. Support an
MT4的 Binary HMA Levels 指标专为二元期权设计,但同样适用于外汇交易。它基于关键水平运作,在当前蜡烛收盘前发出箭头形式的信号,确认价格从关键水平反弹。为了确保指标正确运行,您需要下载并将 "MQL5" 文件夹安装到您的终端目录中。您可以通过此链接下载文件夹: https://disk.yandex.ru/d/DPyo0ntaevi_2A 该指标通用,适用于任何时间框架和货币对,但为了获得更准确的信号,重要的是选择最佳的到期时间和时间框架。它还会直接在图表上显示信号的成功率,帮助评估其有效性。默认到期时间为1分钟,适合短期交易,但您可以在指标设置中进行调整,以正确显示统计信息........
Towers
Yvan Musatov
Towers - Trend indicator, shows signals, can be used with optimal risk ratio. It uses reliable algorithms in its calculations. Shows favorable moments for entering the market with arrows, that is, using the indicator is quite simple. It combines several filters to display market entry arrows on the chart. Given this circumstance, a speculator can study the history of the instrument's signals and evaluate its effectiveness. As you can see, trading with such an indicator is easy. I waited for an a
Inside Bars
Paul Geirnaerdt
The Inside Bars indicator shows Inside Bars, the Breakout Zone and Breakouts thereof. Inside Bars are an important price action pattern. The price action of an Inside Bar is completely covered by the price action of the previous bar. Inside Bars are most often used on higher timeframes. Settings Inside Bars default settings are good enough most of the time. Feel free to fine tune them to your needs. ATR factor to skip large candles - very large candles should be filtered as they often cover othe
Powerful Binary Options
Ellan Dirgantara Tholkhah
This is the binary options signal you all have been looking for. This in a modified version of the Garuda Scalper, that has been modified for Binary Options traders. Signals are very unique! Why this is so effective for binary options is because  it is a trend following system, it understands that the trend is your friend. It takes advantage of the buying/selling after the pullback in continuation of the current trend wave.  Because  signals are generated after the pullback,   you can place shor
该产品的买家也购买
Neuro Poseidon MT4
Daria Rezueva
4.93 (30)
Neuro Poseidon is a new indicator by Daria Rezueva. It combines precise trading signals with adaptive TP/SL levels - creating best possible trades as a result! Message me and get  Neuro Poseidon Assistant  as a gift to automize your trading process! What makes it stand out? 1. Proven profitability on all assets and timeframes 2. Only confirmed BUY and SELL signals present on the chart 3. Adaptive TP & SL levels generated by the software for each trade 4. Easy to understand - suitable for all
M1 Sniper
Oleg Rodin
5 (23)
M1 SNIPER 是一款易于使用的交易指标系统。它是一个专为 M1 时间框架设计的箭头指标。该指标可以作为独立的系统在 M1 时间框架下进行剥头皮交易,也可以作为您现有交易系统的一部分使用。虽然该交易系统专为 M1 时间框架交易而设计,但它也可以用于其他时间框架。我最初设计此方法是为了交易 XAUUSD 和 BTCUSD。但我发现这种方法在其他市场交易中也同样有用。 指标信号既可以顺势交易,也可以逆势交易。我教授一种特殊的交易技巧,帮助您利用指标信号进行双向交易。该方法基于使用特殊的动态支撑位和阻力位区域。 购买后,您可以立即下载 M1 SNIPER 箭头指标。此外,我还为所有 M1 SNIPER 工具用户免费提供下方屏幕截图所示的 Apollo Dynamic SR 指标!这两个指标的组合可以帮助您更轻松、更准确地利用 M1 时间框架进行交易。 购买后请联系我,免费获取交易提示和奖励指标! 祝您交易成功!
Gann Made Easy
Oleg Rodin
4.84 (164)
Gann Made Easy 是一个专业且易于使用的外汇交易系统,它基于使用先生理论的最佳交易原则。 W.D.江恩。该指标提供准确的买入和卖出信号,包括止损和获利水平。您甚至可以使用推送通知在旅途中进行交易。 购买后请联系我,即可免费获得交易指导和超棒的额外指标! 您可能已经多次听说过江恩交易方法。通常 Gann 的理论不仅对于新手交易者而且对于那些已经有一定交易经验的人来说都是非常复杂的东西。这是因为江恩的交易方法在理论上并不那么容易应用。我花了几年时间来完善这些知识,并将最好的原则应用到我的外汇指标中。 该指标非常易于应用。您所需要的只是将其附加到您的图表并遵循简单的交易建议。该指标不断进行市场分析工作并寻找交易机会。当它检测到一个好的入口点时,它会为您提供一个箭头信号。该指标还显示止损和获利水平。 换句话说,当您像先生一样进行交易时,该指标会为您提供最佳江恩建议。江恩亲自告诉你此时此刻该做什么。但最好的部分是您不需要了解任何有关江恩交易原则的知识,因为该指标会为您完成整个市场分析工作。
Dynamic Forex28 Navigator
Bernhard Schweigert
4.43 (7)
Dynamic Forex28 Navigator - 下一代外汇交易工具。 当前 49% 折扣。 Dynamic Forex28 Navigator 是我们长期流行的指标的演变,将三种功能合二为一: 高级货币强度 28 指标 (695 条评论)+ 高级货币 IMPULSE 带警报 (520 条评论)+ CS28 组合信号(奖励)。 有关指标的详细信息 https://www.mql5.com/en/blogs/post/758844 下一代强度指标提供什么? 您喜欢的原始指标的一切,现在通过新功能和更高的精度进行了增强。 主要特点: 专有货币强度公式。  所有时间范围内的平滑和准确的强度线。 非常适合识别趋势和精确进入。 动态市场斐波那契水平(市场斐波那契)。  此指标独有的独特功能。 斐波那契应用于货币强度,而不是价格图表。 适应实时市场活动以获得准确的反转区域。 实时市场动量。  第 9 行显示市场是活跃还是被动。 对于定时交易至关重要。 全面的警报和显示。  每种货币最强的买入和卖出动量。 ​​28 对的双重动量买入和卖出。 超买/超卖警告外部范围和止损。 反转
Scalper Inside PRO
Alexey Minkov
4.74 (68)
Scalper Inside PRO Scalper Inside PRO 是一款适用于 MetaTrader 4 的日内趋势与剥头皮指标,使用专有算法快速识别市场方向和关键目标价位。它能够自动计算进场价、出场价以及多级止盈目标,并显示详细的绩效统计,让您了解不同交易品种和策略以往的表现情况,从而帮助您为当前的市场环境选择最合适的交易工具。此外,您还可以将自己的箭头指标轻松接入 Scalper Inside PRO,快速评估其统计数据和历史表现。 该指标可用于任何交易品种和任何周期(建议在 M5 上进行日内交易),并内置多种交易策略,因此既可以作为独立的剥头皮工具使用,也可以作为您交易系统中功能强大的分析组件。 主要功能 通过专有算法(Next‑Generation Trend Detection Algorithm,NG TDA)快速识别当前市场趋势。 自动计算日内交易的进场价、出场价和多级止盈目标。 内置策略与统计模块,用于评估不同市场环境下各品种的表现。 支持接入自定义箭头指标(PRO 模式),并计算其详细信号统计数据。 适用于外汇、金属、指数、股票、商品、期货和加密货币等各类市
Enigmera
Ivan Stefanov
5 (8)
ENIGMERA: 市场的核心 重要提示:MQL5.com 演示版本在策略测试器中运行,可能无法完全反映 Enigmera 的功能。请查看描述、截图和视频了解详细信息。如有任何问题,请随时联系我! 该指标的代码已完全重写。版本 3.0 增加了新功能并修复了自指标发布以来积累的错误。 简介 这个指标和交易系统是金融市场的一种独特方法。ENIGMERA 使用分形周期来精确计算支撑和阻力水平。它展示了真实的积累阶段,并提供了方向和目标。无论是在趋势中还是在修正中,这个系统都能工作。 它是如何工作的 指标的大部分功能通过图表左侧的按钮控制,使得能够快速响应不同的市场情况。 按钮 ON/OFF – 显示或隐藏整个指标。 Channel – 激活支撑通道,显示可接受的偏差范围。 Dev1 (第一偏差) – 指示价格在支撑偏差内的波动,信号表示市场正在整合或积累力量。 Dev2 (第二偏差) – 显示价格在偏差之间的波动,表示趋势形成和方向。 Dev3 (第三偏差) – 表示趋势的显著加速和高波动性。 45deg (45度) – 显示市场的节奏和相对于 45 度线的运动稳定性。 Tgt1/2
KT Alpha Hunter Arrows MT4
KEENBASE SOFTWARE SOLUTIONS
大多数箭头指标只给你一个信号,然后把剩下的判断全部留给你自己。KT Alpha Hunter Arrows 给你的,是一套完整的交易计划。 每一个信号箭头出现时,图表上都会同时绘制完整计划:入场线、止损位、四个止盈目标,以及实时 Edge 结论,告诉你当前品种和时间周期是否值得交易。套装中还包含 Trade Manager EA,在你手动入场后负责后续执行,让你在市场波动和情绪干扰下依然保持纪律。非重绘。只在K线收盘后给出信号。适用于 Forex、黄金、指数,以及你交易的其他任何品种。 核心功能 非重绘买入和卖出箭头,只在K线收盘后出现。 每个信号都带有入场线、结构性止损和四个止盈目标。 Edge Dashboard 会分别评估当前图表上的买入和卖出机会。 结论系统:No Edge、Marginal、Tradeable、Good 或 Strong。 一键 Auto Optimize 按钮,可根据当前品种和时间周期自动调整设置。 完整套装包含 Trade Manager EA,并内置五种专为本指标设计的交易管理方案。 Prop Firm Risk Panel 可在图表上实时追踪日内回撤
Trend Catcher ind
Ramil Minniakhmetov
5 (2)
趨勢捕捉指標 趨勢捕捉指標結合了作者獨有的客製化自適應趨勢分析指標,用於分析市場價格趨勢。它透過過濾掉短期噪音,並專注於潛在的動能強度、波動性擴張和價格結構行為,來識別真實的市場方向。此外,它還結合了平滑和趨勢過濾等客製化指標,例如移動平均線、相對強弱指標 (RSI) 和波動率過濾器。 您可以在這裡查看實際運行情況以及我的其他產品: https://www.mql5.com/en/users/mechanic/seller 請注意,我不會在 Telegram 上出售 EA 或任何設置,那是騙局。所有設定都可以在我的部落格上免費取得。 重要提示!購買後請立即聯繫我,以獲取使用說明和額外獎勵! 請注意,我不會在 Telegram 上出售 EA 或任何設置,那是騙局。所有設定都可以在我的部落格上免費取得。
PRO Renko System
Oleg Rodin
5 (30)
PRO Renko Arrow Based System for trading renko charts.  准确的信号交易任何外汇工具. 另外,我将免费提供系统的附加模块! PRO Renko系统是RENKO图表上高度准确的交易系统。该系统是通用的。 该交易系统可应用于各种交易工具。 该系统有效地中和了所谓的市场噪音,打开了获得准确反转信号的通道。 该指标易于使用,只有一个参数负责产生信号。 您可以很容易地使算法适应您感兴趣的交易工具和renko酒吧的大小。 我很乐意通过提供任何咨询支持来帮助所有客户有效地使用该指标。 祝您交易成功!购买后,立即写信给我! 我将与您分享我的建议和我的renko发电机。 另外,我将免费提供系统的附加模块!
Trend Lines PRO
Roman Podpora
5 (1)
TREND LINES PRO 帮助您了解市场真正的方向转变点。该指标显示真实的趋势反转点以及主要参与者重新入场的时机。 您可以看到 BOS线、 趋势变化和更高时间框架的关键水平——无需复杂的设置或不必要的干扰。信号不会重绘,并在K线收盘后仍然保留在图表上。 VERSION MT 5    -   与……搭配使用时,可发挥其最大潜力   RFI LEVELS PRO 指示器 该指标显示的内容: 实际变化 趋势(BOS 线) 一旦信号出现,它就始终有效!这与会重绘的指标有着重要的区别,后者可能会发出信号后又改变信号,从而导致资金损失。现在,您可以更精准、更准确地进入市场。此外,还有一个功能,会在箭头出现后为K线着色,直到达到目标价位(止盈)或出现反转信号为止。 重复条目   以及主要玩家的充值 为了提高寻找入场点时的视觉清晰度,我们创建了一个模块,该模块首先显示买入/卖出区域,并在该区域内寻找最佳入场点。此外,我们还加入了智能逻辑来管理止损位,该逻辑会随着时间的推移逐步降低止损位的大小,从而降低入场交易时的初始风险(移动止损位)。 信号强度水平(BOS) 该指标采用三个显著性等级来衡量
Genesis Matrix Pro is a professional multi-timeframe trend detection indicator designed to help traders identify high-quality market alignment with clarity and structure. It combines 12 different technical indicators into one visual alignment matrix, allowing traders to quickly see when market conditions are bullish, bearish, or neutral. A signal is generated only when the selected strategies are aligned, helping reduce noise and improve decision-making. PLEASE CONTACT ME AFTER PURCHASE TO GET
本产品已针对 2026 年市场进行更新,并针对最新 MT5 版本进行了优化。 价格更新通知: Smart Trend Trading System 目前价格为 $99 。 接下来的 30 次购买 后,价格将上涨至 $199 。 特别优惠: 购买 Smart Trend Trading System 后,请发送私信给我,即可免费领取 Smart Universal EA ,并将您的 Smart Trend 信号转换为自动交易。 Smart Trend Trading System 是一套完整的交易系统,具备不重绘、不回绘、不延迟的特点,专为希望获得更清晰信号、更准确趋势方向以及更有组织交易方式的交易者打造。 Online course , manual and download presets . 它将 10 多种交易工具 整合到一个系统中,包括趋势检测、反转区域、Smart Cloud、移动止损逻辑、支撑与阻力、K线着色、提醒以及多周期分析。 该系统旨在帮助您应对不同的市场环境: 趋势市场: 识别主要趋势,发现回调,跟随动能,并通过止损指导和移动止损选项寻找更清晰的入场机会。 震荡
PZ Trend Trading
PZ TRADING SLU
4.8 (5)
许多盈利交易者不仅知道如何识别市场趋势,而且也能把握趋势建立后的交易机会。 Pz 趋势交易 指标设计用来在趋势行情中尽可能的赚取利润。 已建立的趋势提供了一揽子交易机会,但大多数趋势交易指标完全忽视了它们,让交易者在趋势行情时完全不知道该如何做!一般趋势指标只通知有关的趋势变化,但根本不足以得到卓越的回报. Pz 趋势交易 指标比一般趋势指标显示多达 20 倍的交易 , 因为它注重所谓的市场时机。它不仅显示当前的市场趋势,也有回调,内柱线的突破和调整。它令您在趋势回调之后介入,安全的柱线内突破金字塔加仓,以及发现潜在的反转,和已知的调整。 趋势改变 一个趋势改变在市场方向变化时发生。趋势变化在图表上用带数字的彩色圆圈显示。蓝色 (1) 信号为上涨开始, 而红色 (1) 信号为下跌开始。趋势变化并非评估当前价格动作的结果, 它意味着交易设置是不定时地。如果您正确使用本指标, 在趋势变化时, 您将将已经入场 (参看下面的调整)。 回调 但凡趋势在运动中,行情上下抖动,盈利者收割利润,且其它参与者入场。趋势回调代表好的买入机会,通常是由主力获利离场导致。如果行情在回调后回归上行, 指标将
Step into the world of Forex trading with confidence, clarity, and precision using   Gold Indicator   a next-generation tool engineered to take your trading performance to the next level. Whether you’re a seasoned professional or just beginning your journey in the currency markets, Gold Indicator equips you with powerful insights and help you trade smarter, not harder. Built on the proven synergy of three advanced indicators, Gold Indicator focuses exclusively on medium and long-term trends eli
PZ Swing Trading
PZ TRADING SLU
5 (3)
Swing Trading 是第一个旨在检测趋势方向的波动和可能的反转波动的指标。它使用在交易文献中广泛描述的基准摆动交易方法。该指标研究多个价格和时间向量,以追踪总体趋势方向,并检测市场超卖或超买并准备好进行修正的情况。 [ 安装指南 | 更新指南 | 故障排除 | 常见问题 | 所有产品 ] 市场波动的利润不会被窃取 指示器始终显示趋势方向 彩色价格带代表机会基准 彩色虚线表示可能的反转波动 该指标分析其自身的质量和性能 它实现了一个多时间仪表板 可定制的趋势和波动周期 它实现了电子邮件/声音/推送警报 指示器为非重涂或重涂 什么是摇摆交易 摇摆交易是一种尝试在一天到一周内从证券中获得收益的交易方式,尽管某些交易最终可以保持更长的寿命。摇摆交易者使用技术分析来买入弱点和卖出力量,并有耐心等待这些机会的发生,因为在发生一波抛售浪潮之后购买证券而不是陷入抛售更有意义。 机会基准 关于历史数据的大量研究证明,适合于波动交易的市场倾向于在基线价格带上下交易,基线价格带由图表显示,使用平均真实区间计算得出。波动交易者使用基线,该策略是购买常态和卖出躁狂,或做空常态并掩盖沮丧。在没有疲
Current event:  https://c.mql5.com/1/326/A2SR2025_NoMusic.gif A. 什么是 A2SR ?   * 这是一个领先的技术指标(没有重绘,没有滞后)。  -  指导 : -- 在  https://www.mql5.com/en/blogs/post/734748/page4#comment_16532516 -- 和  https://www.mql5.com/en/users/yohana/blog A2SR 在确定支撑(需求)和阻力(供应)水平方面有一种特殊的技术。 与我们在网上看到的普通方式不同,A2SR 在确定实际 SR 级别时有一个独创的概念。 原技术不是从网上拿来的,也没有在网上公开过。 A2SR 将根据您的交易风格自动选择 SR 级别。 即使您正在更改时间范围,但 SR 级别仍将保留在其位置上。 因为实际的 SR 不是从你使用的时间范围内获得的。 A2SR 拥有完整的交易工具 。 实际支持(需求)和阻力(供应)的真正概念。 新闻事件和央行讲话的市场情绪。 新闻事件和趋势的主要货币强度 (MCS) 的真正概念
BTMM State Engine Pro MT4
Garry James Goodchild
BTMM State Engine Pro is a MetaTrader 4 indicator for traders who use the Beat The Market Maker approach: Asian session context, kill zone timing, level progression, peak formation detection, and a multi-pair scanner from a single chart. It combines cycle state logic with a built-in scanner dashboard so you do not need the same tool on many charts at once. What it does Draws the Asian session range; session times can follow broker server offset or be set in inputs. Tracks level progression (L
Dynamic Scalper System
Vitalyi Belyh
5 (1)
“ Dynamic Scalper System ”指标专为在趋势波内进行剥头皮交易而设计。 已在主要货币对和黄金上进行测试,并可与其他交易工具兼容。 提供顺势短线建仓信号,并提供额外的价格变动支持。 指标原理: 大箭头决定趋势方向。 在趋势波内,我们采用一种生成小箭头形式的剥头皮交易信号的算法。 红色箭头代表看涨方向,蓝色箭头代表看跌方向。 敏感的价格变动线会沿着趋势方向绘制,并与小箭头信号协同作用。 信号运作方式如下:当线在适当时刻出现时,将形成入场信号;在出现线时,持仓;线完成后,平仓。 建议的操作时间范围为M1 - H4。 箭头在当前K线上方形成,如果下一根K线已开仓,则不会重新绘制上一根K线上方的箭头。 输入参数 Trend Wave Period - 趋势方向(大箭头)的周期,改变趋势波的时间间隔。值 1 表示趋势方向的最长持续时间,参数值越大,持续时间越短。 Scalper Arrows Period - 信号箭头(小箭头)的计算周期,改变入场信号的生成频率。值 3 表示最频繁的生成频率,参数值越大,箭头频率越低,准确度越高。 这些参数可以根据不同的时间范
Neo Wave PRO
Nikolay Raykov
5 (1)
Price & Time Market Structure Indicator A professional market structure tool that analyzes waves through both price and time — not price alone. Main Description NeoWave PRO is a professional market structure indicator for MetaTrader 4 designed for traders who want to move beyond traditional one-dimensional wave tools such as ZigZag, swing indicators, and basic high/low systems. Most wave indicators analyze only one thing: Price. But a real market wave is not only a price movement. A true wave de
MonsterDash Harmonic Indicator
Paul Geirnaerdt
4.54 (26)
MonsterDash Harmonic Indicator is a harmonic pattern dashboard. It recognizes all major patterns. MonsterDash is a dashboard that displays all detected patterns for all symbols and (almost) all timeframes in sortable and scrollable format. Users can add their own user defined patterns . MonsterDash can open and update charts with the pattern found. Settings MonsterDash's default settings are good enough most of the time. Feel free to fine tune them to your needs. The color settings are for thos
Apollo SR Master
Oleg Rodin
5 (2)
Apollo SR Master 是一款支撑/阻力指标,其特殊功能使利用支撑/阻力区域进行交易更加便捷可靠。该指标通过检测局部价格顶部和底部,实时计算支撑/阻力区域,没有任何时间延迟。为了确认新形成的支撑/阻力区域,该指标会显示特殊信号,表明该支撑/阻力区域可以作为实际的卖出或买入信号。在这种情况下,支撑/阻力区域的强度会增强,因此从该区域进行交易的成功率也会更高。这正是该指标的核心理念。 SR区域也使止损和止盈的操作更加便捷。根据信号方向,可以将SR区域上方或下方的空间用作止损位。此外,相对的SR区域也可以用作潜在的止盈区域。 我还免费向所有 Apollo SR Master 指标的用户提供我的“Apollo 价格行为系统”指标。这两个指标结合使用将帮助您找到更好的入场点。 购买后请联系我,即可免费获得我的交易技巧以及我的“阿波罗价格行为系统”指标作为赠品!
Advanced Currency Strength28 Indicator
Bernhard Schweigert
4.91 (657)
目前40%的折扣 任何新手或专家交易者的最佳解决方案! 这个指标是一个独特的、高质量的、可负担得起的交易工具,因为我们纳入了一些专有的功能和一个新的公式。只需一个图表,你就可以读出28个外汇对的货币强度!想象一下,你的交易将如何得到改善,因为你的交易是在你的手中进行的。想象一下,你的交易将如何改善,因为你能够准确地确定新趋势或剥头皮机会的触发点? 用户手册:点击这里  https://www.mql5.com/en/blogs/post/697384 这是第一本,原版的! 不要买一个毫无价值的崇拜者的克隆品。 特别的 子窗口中的箭头显示强劲的货币势头GAP将指导你的交易! 当基础货币或报价货币处于超卖/超买区域(外盘斐波那契水平)时,在个人图表的主窗口中出现警告信号。 当货币力量从外围区间回落时,回撤/反转警报。 十字星模式的特别警报 可选择多个时间框架,以快速查看趋势! 货币强度线在所有的时间框架中都非常平稳,当使用较高的时间框架来识别总体趋势,然后使用较短的时间框架来确定精确的入口时,效果非常好。你可以根据自己的意愿选择任何时间框架。每个时间框架都由其自身进行了优化。
Auto Optimized Parabolic RSI: 高级 3D 动量引擎 大多数零售指标之所以失效,是因为它们依赖于静态输入,一旦市场波动率发生变化,这些输入就会崩溃。Auto Optimized Parabolic RSI 通过不断重新计算自身的数学优势,解决了“指标衰退”的问题,将机构级别的量化自适应能力直接引入您的 MT5 终端。 核心优势:定制的内存 3D 优化   标准的自动优化器通常会导致 MT5 平台卡顿,因为它们通过标准的指标调用使终端超载。该工具完全绕过了这些性能瓶颈。内部引擎采用定制的原生基于 RAM 的计算器构建,每次加载图表或更改时间周期时,它都会执行极速的 3D 网格搜索。它同时扫描 RSI 周期(频率)、SAR 步长(加速度)和 SAR 最大值(速度限制),在绝对的毫秒级时间内测试数以万计的参数组合,且完全不会拖慢您的平台。它不是仅仅寻找一个“不错”的设置,而是映射整个参数空间,以寻找资产当前动量结构的绝对全局最大值。 严格的财务评分与逼真的交易模拟   与基于抽象“指标点数”进行优化评分的业余工具不同,该引擎的 3.10 版本严格与资金数学挂钩。每
Advanced Supply Demand
Bernhard Schweigert
4.91 (300)
现在优惠 40%! 任何新手或专业交易者的最佳解决方案! 该指标是一款独特、高质量、且价格合理的交易工具,因为我们已经整合了许多专有功能和新公式。 依据此更新,您将能够显示双重时间帧区域。 您不仅可以显示一个较高的时间帧,还可以同时显示图表时间帧,加上更高的时间帧:显示嵌套时区。 供需双方所有交易者都会喜欢它。 :) 重要信息披露 高级供需的最大潜力,请访问 https://www.mql5.com/zh/blogs/post/720245   想象您的交易如何得以改善,是因为您能够精准定位入场或目标位吗? 构建于新的底层算法,它可以更轻松地识别出买卖双方之间的潜在失衡。 这是因为它以图形方式展示供需最强劲区域,及其过去的表现(显示旧区域)。 这些功能旨在帮助您更轻松地发现最佳入场区域和价位。 现在您可以针对您的交易品种和时间帧来优化和编辑区域强度! 高级供需指标适用于所有产品和时间帧。 它是一个新的公式,非常新的功能是两个区域强度函数可由用户输入进行调整! 这在交易中是一大优势。 当您学习如何使用专有功能,例如带有价格游离最小 X 因子的区域强度时,您能够判断该区域强劲与否。 供需
该指标旨在与艾略特波浪理论相结合,提供了两种不同的工作方式: 自动工作: 在此模式下,指标会自动检测图表上的所有五个动机波浪,并为您提供预测和潜在的逆转区域。它还可以提供警报和推送消息。这种自动功能简化了识别和分析艾略特波浪模式的过程。 手动工作: 此选项适用于喜欢手动方法的交易员,用于手动绘制九个不同等级的波浪。每个等级都可以在它们出现后通过调整图表上的绘制线条来单独定义。此功能简化了手动绘制波浪的过程,使其更加高效。需要注意的是,所有绘图数据将保存在平台的数据文件夹中,以备将来参考。 参数: Name: 指标名称。 Use_System_Visuals: 启用或禁用指标主题,以匹配交易平台的整体外观。 Explain_Comment: 允许启用或禁用波浪编号的解释性注释,有助于理解已识别的波浪。 Show_Last_Candle_Counter: 启用或禁用蜡烛计时器,提供有关当前蜡烛收盘的剩余时间的信息。 Candle_Counter_Color: 蜡烛计时器文本的颜色。 Basic_Wave_Color: 用于表示波浪的主要颜色。 Bullish_Wave_Color: 当检测
Introduction to Fractal Pattern Scanner Fractal Indicator refers to the technical indicator that makes use of the fractal geometry found in the financial market. Fractal Pattern Scanner is the advanced Fractal Indicator that brings the latest trading technology after the extensive research and development work in the fractal geometry in the financial market. The most important feature in Fractal Pattern Scanner is the ability to measure the turning point probability as well as the trend probabi
Bull versus Bear
Mohamed Hassan
4.5 (18)
Send us a message after your purchase to receive more information on how to get your  BONUS  for FREE  that works in great combination with Bull vs Bear ! Bull versus Bear is an easy-to-use Forex indicator that gives traders clear and accurate signals based on clear trend retests . Forget about lagging indicators or staring at charts for hours because  Bull vs Bear provides real-time entries with no lag and no repaint, so you can trade with confidence. Bull vs Bear  helps you enter trades during
Scalper Vault
Oleg Rodin
5 (37)
Scalper Vault 是一个专业的剥头皮系统,为您提供成功剥头皮所需的一切。该指标是一个完整的交易系统,可供外汇和二元期权交易者使用。推荐的时间范围是 M5。 该系统为您提供趋势方向的准确箭头信号。它还为您提供顶部和底部信号以及江恩市场水平。无论您拥有何种交易经验,该系统都易于使用。您只需要遵循简单的规则并每天重复该过程。 建议将此系统用于主要货币对。感谢您的关注! 请注意,该指标在策略测试器中可能无法正常工作。因此,我建议仅在模拟或真实账户的真实交易条件下使用该系统。 指示器提供所有类型的警报,包括推送通知。 购买指标后请与我联系。我将免费与您分享我的个人交易建议和出色的奖励指标! 祝您交易愉快,盈利!
The Propfolio Master Suite is the ultimate all-in-one analytical workstation for professional traders. Combining the power of the Beat The Market Maker (BTMM) methodology, Smart Money Concepts (SND/Liquidity), and Advanced Volume Profile, this suite replaces multiple different indicators with one optimized engine. Monitor up to 14 pairs simultaneously from a single chart, instantly identify market cycles, and seamlessly map institutional footprints with the click of a button. The Command Center
Harmonic Pattern Plus MT4
Young Ho Seo
4.44 (18)
Introduction Harmonic Patterns are best used to predict potential turning point. Traditionally, Harmonic Pattern was identified manually connecting peaks and troughs points in the chart. Manual harmonic pattern detection is painfully tedious and not suitable for everyone. You are often exposed under subjective pattern identification with manual pattern detection. To avoid these limitations, Harmonic Pattern Plus was designed to automate your harmonic pattern detection process. The functionality
作者的更多信息
Max Daily Volume
Anatolie Micriucov
Do you want to trade like a pro? Buy where the professional buys and sell where the professional sells! Our indicator shows the most controversial and heated moment of the day! A moment of the day where a lot of money was loaded in the market and for this "Treasure" the further struggle will go! And so, the indicator shows the bar in which there was the maximum struggle between the buyer and the seller for the past day, and it is this bar, or its extremes, or itself as a whole, becomes an impo
筛选:
无评论
回复评论