Pending Orders Grid Drag and Drop MT5

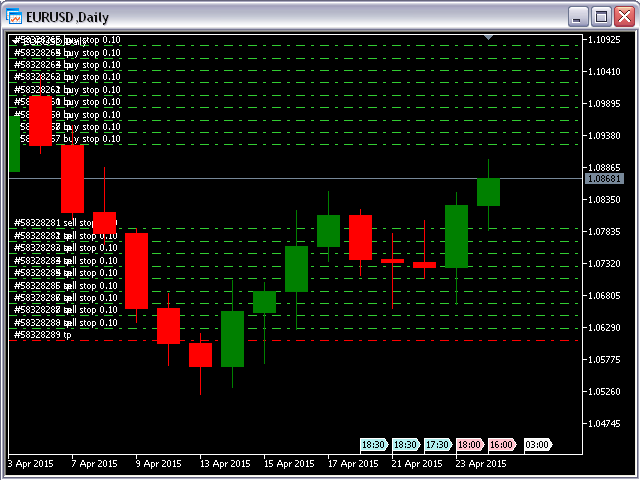
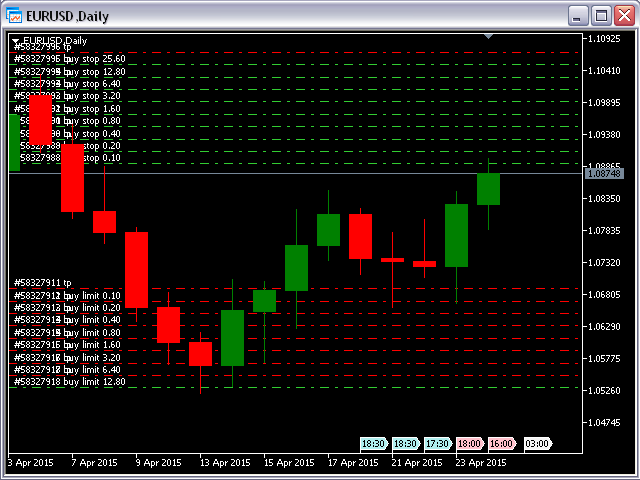
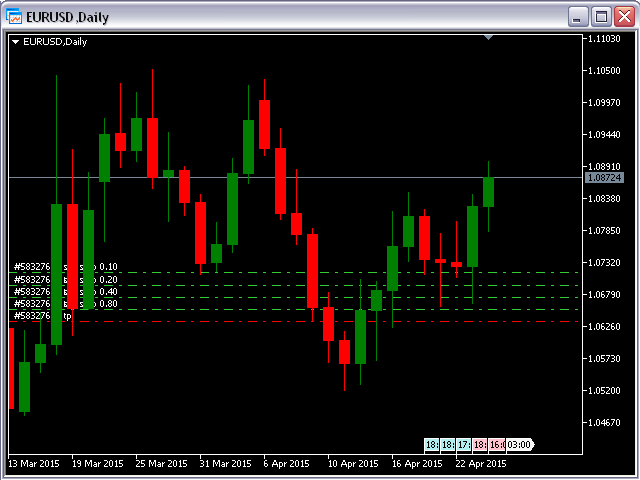
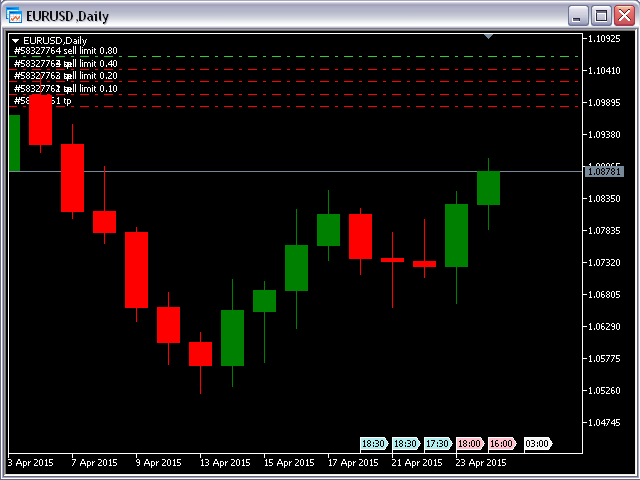
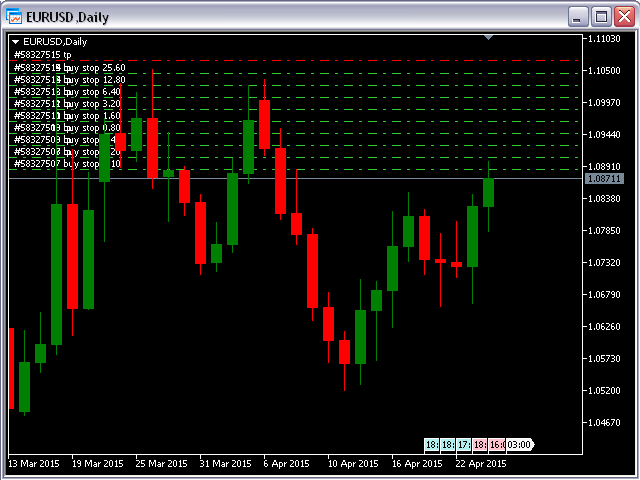
Pending Orders Grid Complete System opens any combination of Buy Stop, Sell Stop, Buy Limit and Sell Limit pending orders and closes all existing pending orders.

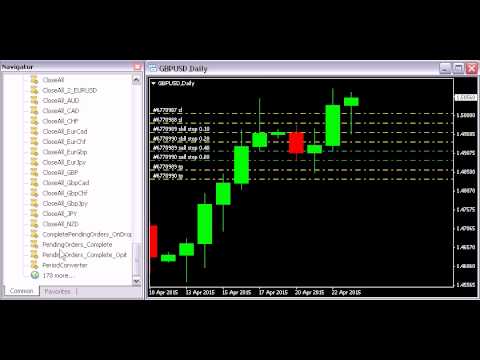
You will be able to Drag-and-Drop the Script on the chart and it will pick up the start price for the first position in the grid from the "Drop" point. Usually it should be in the area of Support/Resistance lines.


Input Parameters

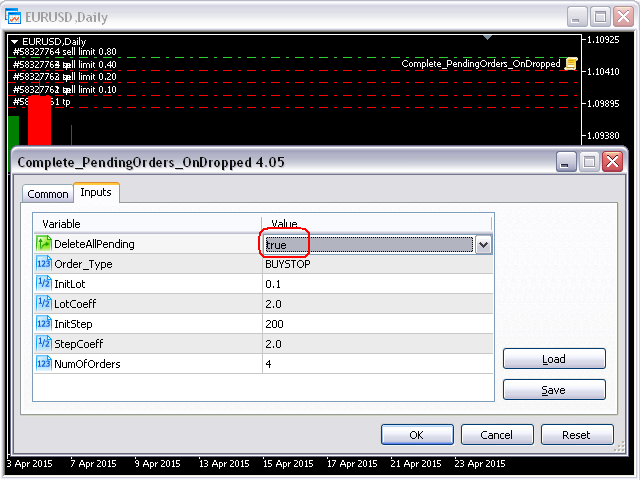
Before placing all pending orders, the input window is opened allowing you to modify all input parameters:

  • DeleteAllPendings - if true, then all pending orders (for the current currency) will be deleted. (No pending orders will be created!);
  • Order_Type - you can choose what kind of pending orders you want to use (Buy Stop, Sell Stop, Buy Limit or Sell Limit);
  • InitLotSize - initial lot size;
  • LotCoeff - if 1, all pending orders will have the same lot size;
  • NumOfOrders - number of pending orders you want to place on the chart;


Attention

  • If DeleteAllPendings=true, then the script will be able to delete existing pending orders for the current currency pair only.
  • You have to allow automated trading on the "Expert Advisors" tab (Tools->Options).
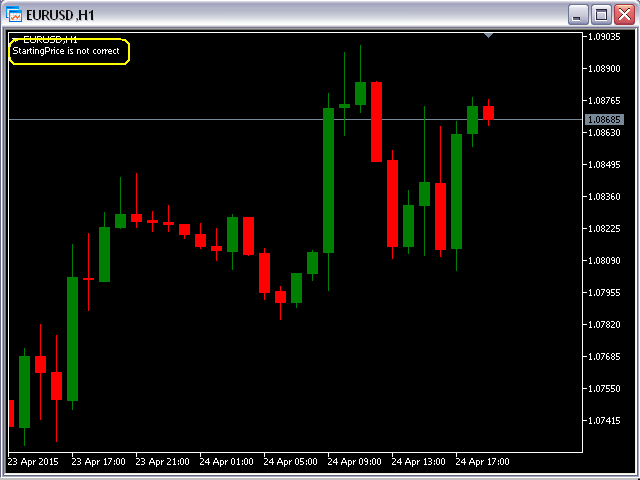
  • You must drop the script on a legitimate Starting Price area on the chart for the first position in the grid. Comment will appear in the left upper corner of the chart if the Price is not right or too close to the current price: "StartingPrice is not correct".
推荐产品
AKCAP Hotkey Tool
AK Capital Markets Limited
5 (3)
Special offer for the next 10 copies Are you tired of manually navigating through menus and inputting data every time you want to execute a trade or open an order on Meta Trader? Our hotkey tool is here to make your life easier and boost your trading efficiency. Our tool is natively coded for lightning-fast performance and comes loaded with all the features you could possibly want. From pending orders and OCO orders to trailing and multiple buckets, it has everything a scalper could need. And


Operative Management Pro – Advanced Trading Utility Operative Management Pro is a smart visual tool for traders who want to analyze and simulate their trades before placing them on the market. This panel displays in real-time the most important parameters of the current symbol: Current price and minimum lot size Required margin Spread cost in USD and pips Take Profit and Stop Loss value in USD Automatic risk and reward calculation With just a click on the chart, you can simulate BUY or SELL t
Trade HotKeys 是一款手动交易工具,可通过键盘快捷键快速执行交易操作。 它专为自主交易者(Discretionary Traders)和剥头皮交易者(Scalpers)设计,帮助用户无需使用 MetaTrader 5 界面按钮即可快速控制订单。 无需点击图表按钮或切换菜单,您可以直接通过键盘完成交易操作。 功能特点 使用快捷键快速开仓 BUY / SELL 分别关闭 BUY 或 SELL 持仓 一键关闭全部持仓 快速反转持仓方向 暂停交易,防止误操作 直接在图表上监控 BUY/SELL 持仓量与浮动盈亏 为什么交易者会使用它 减少决策与执行之间的延迟 帮助建立更快的手动交易肌肉记忆 适用于剥头皮交易与快速行情环境 减少交易过程中对终端界面的操作依赖 支持任何经纪商和账户类型(净额 / 对冲) 轻量稳定,无复杂计算负载 界面 UI 位置可自由调整(4 个角落) 可配置字体大小与布局 文本、标签和颜色可轻松自定义 实时图表状态显示 低 CPU 占用 Roadmap(未来更新) 本工具将根据交易者反馈持续扩展功能。 计划中的功能: 达到盈利目标后自动关闭全部持仓 一键移动 S
Danko DTC Panel
Ricardo Almeida Branco
Do not buy before seeing the Danko Trend Color product, as this panel is a way to view a summary of this indicator on various timeframes. The Danko DTC Panel utility allows you to look at the trend in up to 5 timeframes. When clicking on the timeframe texts, a new window will open with the indicator plotted on the screen so you can see the complete chart. The width of the panel, with the amount of candles you want to see, is customizable, see the images below. Ao clicar nos textos dos timeframe
Trade Dashboard MT5
Fatemeh Ameri
4.94 (125)
疲于复杂的订单下达和手动计算?Trade Dashboard 是您的解决方案。凭借其用户友好的界面,订单下达变得轻而易举,只需点击一下,您就可以开设交易、设置止损和止盈水平、管理交易手数,并计算风险回报比,让您只需专注于您的策略。告别手动计算,使用 Trade Dashboard 简化您的交易体验。 立即下载演示版本 。 您可以在这里找到仪表盘功能和特性的详细信息 。 加入 Telegram 频道 。 购买后请给我发消息以获取支持。如果您需要添加更多功能,可以在产品的评论区留下您的想法,我愿意听取任何建议,希望您能在使用我的产品时获得最佳体验 。 这是 MT4 版本。 风险管理:使用 Trade Dashboard,可以将您的风险设置为账户余额或权益的百分比,或将风险设置为总金额。在图表上直观地定义您的止损,让工具准确计算每个货币对的适当手数。该工具还可以根据您期望的风险回报比自动设置止盈水平。它甚至可以在手数计算中涵盖佣金和点差费用。此外,您的止损和止盈可以转变为虚拟水平,隐藏于经纪商。通过 Trade Dashboard 的高级风险管理功能,掌控风险,保护您的资本。 交易线
Sync In Many Ways MT5
Sa No Tsuyoshi Kokorozashi
Description This is a Utility tool for MT5 which will make our chart analysis task quite more efficient and save large amount of time. As for chart analysis, some are watching out several symbol simultaneously with single timeframe and others are trading only one single pair with   multi timeframe analysis. For both, a common troublesome issue is “scroll chart to look back” or “draw chart objects” in multi charts at the same time.  Especially for those who are trading with multi timeframe soluti
Pending Orders Grid Complete System   opens any combination of Buy Stop, Sell Stop, Buy Limit and Sell Limit pending orders and closes all existing pending orders. Only one time of the pending order at the same time!!! You will have a possibility to put a legitimate   Open Price   for the first position in the grid. Usually it should in the area of Support/Resistance lines. You just need to drop this script on the chart of a desired currency pair. Input Parameters Before placing all pending ord
GS trade report
Aleksander Gladkov
5 (1)
Introducing the "Auto Timed Close Operations", a useful utility for MetaTrader 5 traders! This utility has been developed to help traders of all levels automatically close their open positions at the exact moment they desire. With the "Auto Timed Close Operations", you gain the required control over your trades and can avoid unwanted surprises at the end of the day or at any other predefined time. We know how important it is to protect your profits and limit your losses, and that's exactly what
This Program will not execute any trades! Works on any chart and any time frame! This is the MT5 version. MT4 version : https://www.mql5.com/en/market/product/125500?source=Site+Market+My+Products+Page#description This EA will produce a comment box at the top left of the chart and show you your equity % difference throughout the day, week, month and year. Updating constantly in real time. The daily resets back to zero on open of a new market open day. The weekly resests back to zero at open
ICT PD Arrays Trader
Aesen Noah Remolacio Perez
Attention All ICT Students! This indispensable tool is a must-have addition to your trading arsenal... Introducing the ICT PD Arrays Trader: Empower your trading with this innovative utility designed to enhance and simplify your ICT trading strategy and maximize your potential profits.  How does it work? It's simple yet highly effective. Begin by placing a rectangle on your trading chart and assigning it a name like 'ict' or any preferred identifier. This allows the system to accurately ident
Equity Guard AI Professional account protection system that closes trades and removes EAs when drawdown limits are breached.Equity Guard is a professional account protection utility designed to safeguard your trading capital. This tool monitors your account equity and drawdown in real-time, automatically executing protective measures when predefined risk thresholds are exceeded. Perfect for prop firm traders, FTMO challenges, and personal accounts. Equity Guard AI installtion Guide       Downl
The utility is designed to send signals from MT4 to Telegram. It has several unique features, allowing not only the sending of trade signals but also the following functionalities: Send messages directly from the terminal to Telegram Send emojis along with custom text Send text and images from Telegram All of these features enable users to manage a signal channel while focusing on trading and finding quality signals. Customizable Signal Messages You can fully customize the signal message: Specif
一张图表,全面掌控。 无需再浪费时间分别管理每个图表上的对象、颜色和设置。有了   图表同步管理器 ,您可以   同步、复制和控制所有 MetaTrader 图表   立即使用一个面板和几个快捷方式。 一次绘制,随时随地更新。只需单击即可打开和关闭图表。使用   基于符号的对象管理 。并且不会错过重要细节   价差显示、倒计时器和蜡烛收盘警报。 节省时间,减少错误,更智能地交易。 图表同步管理器 安装和输入指南 如果您想收到有关 EA 的通知,请添加 URL(   http://www.betasoft.dev   )MT4/MT5 终端(见截图)。 MT4版本 https://www.mql5.com/en/market/product/148491 MT5版本 https://www.mql5.com/en/market/product/148492 主要特点: 克隆所有图表的图表属性(颜色、背景、网格、模板设置等)。 在图表之间立即同步所有绘图对象。 显示或隐藏对象信息(如价格水平或点)。 使用快捷方式删除、选择或复制图表对象。 轻松切换时间范围、打开/关闭图表和缩放图表
Session High Low Tracker MT5
AL MOOSAWI ABDULLAH JAFFER BAQER
• Please test the product in the Strategy Tester before purchasing to understand how it works. • If you face any issues, contact me via private message—I’m always available to help. • After purchase, send me a screenshot of your order to receive a   FREE EA   as a gift. Session High Low Tracker - Essential Multi-Session Price Analysis Tool Powerful Market Session Analysis for Serious Traders Price: $30 Product Overview Session High Low Tracker is an advanced MetaTrader utility that automaticall
该智能交易顾问(EA)会在 MetaTrader 5 中监控所有交易品种上的所有持仓。一旦在任意持仓上 手动设置或调整 了止损(SL)或止盈(TP),EA 会将该值 自动应用于其他所有未平仓头寸 ,无论是买单还是卖单、哪个交易品种。这确保整个账户的 SL 和 TP 水平始终保持同步。 非常适合通过平板或智能手机进行移动交易!    ......................................................................................................................................................
ReverseTune
Konstantin Chernov
A script for quick reversing positions and/or orders. If you need to reverse a position with the same volume, open an opposite position of a different volume or change the type of existing orders (for example, Buy Limit -> Sell Limit, Buy Stop -> Sell Limit, etc.) with the same or different take profit/stop loss, this script will make all the routine for you! Allow AutoTrading before running the script. Usage: Run the script on a chart. Input Parameters: Language of messages displayed (EN, RU, D
SessionSync   is a smart and elegant timing tool for MetaTrader 5, created to keep traders fully synchronized with the market. It shows the remaining time of the current candle in real time and displays the main trading clocks, including server time, local time, New York, and London. With a clean floating panel and an intuitive layout, SessionSync helps you track candle expiration and market sessions quickly and efficiently, without overloading your chart. Whether you trade price action, intrada
Trade Control Panel
Jerry Jilun Anak Liban
Trade Control Panel Function Normal One Click Function Close All Close All Profit Close All Loss Close All Pending Order Close All Sell Close All Buy Advance One Click Function 1.  Close Partial Lot Sell by Percent It will help you partial close for all open position by desire percent you wanted. No longer partial close one by one for every open position Manual input for desire percent 2. Close Partial Lot Buy by Percent It will help you partial close for all open position by desire percent
Position Limit Monitor: Efficient Control of Your Trading Operations Have you ever worried about having too many open trades simultaneously? Would you like precise control over the maximum number of positions in your account? Position Limit Monitor is the solution you need. Main Features: • Real-time monitoring: Constantly supervises the number of open positions in your account. • Customizable limit: Easily set the maximum number of positions you want to keep open. • Automatic closure: When the
Order Trailing
Makarii Gubaydullin
订单追踪:随着市场变动获得最佳执行价格 挂单追踪将允许您保持与入场价格的指定距离。 如果市场价格远离订单,订单将会移动。 多功能工具 : 66+ 功能,包括此工具 | 如有问题请联系我 | MT4版本 要激活订单追踪,您需要设置面板上的4个主要参数: 1. 符号 或 交易 ,将应用追踪: 对于当前[Symbol] / 对于[ALL]符号,或对于特定交易[Ticket]。 除了[Symbol]或[ALL]规则外 - 您可以为特定交易设置单独规则, 通过其票号:单独[Ticket]的规则将优先。 2. 追踪挂单的激活时刻 : [ 执行后立即 ]: 无延迟 当订单放置时; [如果挂单 > 比]:追踪将在 指定时间后 开始; 3. 当前市场价格与入场价格的距离 。 如果市场远离入场点,此距离将在追踪时保持: 但如果市场价格接近入场点,订单将不会移动。可以是: [ 自动 ]:将在追踪开始时确定(第2点)。 或者您可以[ 手动 ]设置:以点/百分比/市场价格百分比。 4. 移动SL / TP水平的规则 。 您可以禁用它们的移动,也可以启用其中每一个的移动。 从入场价格到水平的初始距离将始终被保持
TradingX Hotkeys
Johannes Stephanus Lombard
Inputs Available Lotsizes Partial Close % You can change lotsizes as you require On an open chart click once to select chart to be able to use hotkeys on specific chart. All Pairs can be used with this expert We created this expert to be able to still trade C300 with a 0.06 Lotsize If you enter a 0.6 lot and close 0.90% you can trade with 0.06 Lot Keys to be used: B -Buy S -Sell C -Close Profitable D -Breakeven (Note if stoploss is set it won't break even) P -Partial close X -Close all
使用革命性的交易时间管理器轻松控制您的交易程序。这个强大的工具可以在指定时间自动执行订单,从而改变您的交易方式。 为不同的交易行为(从购买到设置订单)制定个性化任务列表,所有这些都无需人工干预。 交易时间管理器安装和输入指南 如果您想获取有关 EA 的通知,请将我们的 URL 添加到 MT4/MT5 终端(参见屏幕截图)。 MT4版本     https://www.mql5.com/en/market/product/103716 MT5版本     https://www.mql5.com/en/market/product/103715 告别人工监控,拥抱精简效率。直观的界面允许您设置精确的参数,包括交易品种、执行时间、价格、止损 (SL)、止盈 (TP) 点和手数大小。 该工具的灵活性通过与市场行为相匹配的适应性重复选项来凸显。通过视觉主题个性化您的体验,并减少长时间交易期间的眼睛疲劳。 摆脱手动交易程序,拥抱“交易时间管理器”的强大功能。提高交易的准确性、组织性和自由度。简化您的日常工作并重新体验交易。 主要特点: 自动订单执行:按指定时间间隔无缝自动执行订单,从而节省您的
OrderManager MT5
Lukas Roth
4.81 (27)
介绍 OrderManager :MT5的革命性工具 使用全新的Order Manager实用程序,像专业人士一样管理您在MetaTrader 5上的交易。Order Manager设计简单,易于使用,可让您轻松定义和可视化每笔交易的风险,从而做出明智的决策并优化您的交易策略。有关OrderManager的更多信息,请参阅手册。 [ 手册 ] [ MT4版本 ] [ Telegram 频道 ]  New: [ Telegram To MT5 ] 主要功能: 风险管理:快速轻松地定义您交易的风险,让您做出更好的决策并提高交易性能。 视觉表示:图形化地查看您的交易和相关风险,以清晰简洁地了解您的开放头寸。 订单修改:只需几次点击即可轻松修改或关闭您的订单,简化您的交易过程,为您节省宝贵的时间。 掌握新闻:一键获取最新市场新闻。 不要错过这个MT5交易员的必备工具。用Order Manager提升您的交易体验,将您的交易游戏提升到新的水平。 OrderManager在startegyTester中 不 工作! OrderManager 仅与 Windows 兼容。 请考虑给这个产品一
This EA help trader to manage his pending orders, when you place many Pending Orders this utility monitor them and when of them get filed (executed) the EA cancel and delete all rest of pending orders, to avoid  opening of all of pending orders at the same time , and lose your risk management. this utility is very useful for trader when he /she is not available on the desk.
这个工具将在您的手机上发送详细的通知,并在MT5终端上提醒您,一旦您想看到的蜡烛图出现在图表上。该通知包含符号、蜡烛图样和形成该图样的时间框架。 你需要将Metatrader 5 Mobile与你的Windows终端连接起来。以下是方法。 https://www.metatrader5.com/zh/mobile-trading/iphone/help/settings/settings_messages#notification_setup 可以检测的烛台形态列表。 三个白兵 三只黑乌鸦 看涨的三线击球 看跌的三条线罢工 三条内侧上升线 三条内侧下跌 三条外线上涨 三线外跌 早晨之星 傍晚之星 看涨被遗弃的婴儿 看跌被遗弃的婴儿 看涨的哈拉米 看跌哈拉米 看涨的吞噬 看跌吞噬 锤子 射击之星 反转锤子 悬挂的人 蜻蜓斗鸡 墓碑十字星 早晨的斗极星 晚间斗极星 穿透线 黑暗四叶草 看跌的踢球者 看涨踢球者 长下影线(长颈线在下侧)。 长上影线(长灯芯在上方)。 输入参数 当你启动该工具时,你将不得不设置一些输入参数。 EnableMobileNotifications: 启用移动通
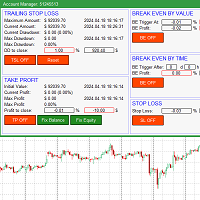
The account manager has a set of functions necessary for trading, which take into account the results of the entire account in total, and not for each individual open position: Trailing stop loss. Take profit. Break-even on the amount of profit. Breakeven by time. Stop Loss Typically, each of these options can be applied to each individual trade. As a result, the total profit on the account may continue to increase, and individual positions will be closed. This does not allow you to get the maxi
Adaptive ATR Trailing Stop
Seref Oliver Joisten
4.5 (2)
Adaptive ATR Trailing Stop (MT5) Overview Adaptive ATR Trailing Stop is a utility Expert Advisor for MetaTrader 5 that manages stop loss levels for existing open positions. It uses the Average True Range (ATR) to calculate a volatility-based trailing distance. This EA does not open trades. It only modifies the Stop Loss (SL) of existing positions and keeps the current Take Profit (TP) unchanged. How it works - The EA runs on every tick of the chart where it is attached. - For each open posit
FREE
The utility places trailing stop, breakeven, stop loss and take profit.‌ It is necessary to allow automated trading in the terminal settings. In testing mode, the utility opens Buy or Sell positions on the first ticks, which allows you to visually observe the given logic, changing the utility parameters. In real mode, the utility does not open positions. Discuss the complexities of Forex trading here:  chat "Age of Expert Advisors" . Parameters magic   - magic number. If less than 0, positions w
MarketMind AI
Perpetual Chinemerem Vincent
MarketMind AI Next-Generation Contextual Analysis for MetaTrader 5 Trade with the clarity of institutional-grade context. MarketMind AI is a professional decision-support system designed to bridge the gap between raw technical data and actionable market intelligence. Rather than generating signals or executing trades, MarketMind AI provides a structured, high-fidelity view of market conditions — enabling traders to make more informed discretionary decisions. USER GUIDE AND ANALYSIS PIPELINE AP
该产品的买家也购买
Trade Assistant MT5
Evgeniy Kravchenko
4.42 (211)
它有助于计算每笔交易的风险,容易安装新的订单,具有部分关闭功能的订单管理, 7 种类型的追踪止损和其他有用的功能。   附加材料和说明 安装说明   -   应用程序说明   -   模拟账户应用程序的试用版 线条功能  - 在图表上显示开仓线、止损线、止盈线。 有了这个功能,就可以很容易地设置一个新的订单,并在开仓前看到它的附加特性。   风险管理  - 风险计算功能在考虑到设定的风险和止损单的大小的情况下,计算新订单的成交量。它允许你设置任何大小的止损,同时观察设定的风险。 批量计算按钮 - 启用 / 禁用风险计算。 在 " 风险 " 一栏中设置必要的风险值,从 0 到 100 的百分比或存款的货币。 在 " 设置 " 选项卡上选择风险计算的变量: $ 货币, % 余额, % 资产, % 自由保证金, % 自定义, %AB 前一天, %AB 前一周, %AB 前一个月。   R/TP 和 R/SL - 设置止盈和止损的关系。 这允许你设置相对于损失的利润大小。 例如, 1 : 1 - 这决定了 TP = SL 的大小。 2 : 1 - 这意味着 TP 是 SL 的两倍。 RR -
欢迎来到 Trade Manager EA——这是一个终极风险管理工具,旨在使交易变得更直观、精准和高效。它不仅仅是一个下单工具,而是一个用于无缝交易计划、仓位管理和风险控制的全面解决方案。不论您是新手交易员、资深交易员,还是需要快速执行的剥头皮交易员,Trade Manager EA 都可以满足您的需求,适用于外汇、指数、大宗商品、加密货币等各种市场。 借助 Trade Manager EA,复杂的计算已成过去。只需分析市场,在图表上用水平线标记入场、止损和止盈,设置您的风险水平,Trade Manager 就会立即计算出理想的头寸规模,并实时显示以点、账户货币计价的止损和止盈。每笔交易都得以轻松管理。 主要功能: 头寸规模计算器 :根据定义的风险瞬间确定交易规模。 简单的交易计划 :在图表上用可拖动的水平线直接计划交易,设置入场、止损和止盈。 实时显示 SL 和 TP :以账户货币、点或分显示止损和止盈,便于分析。 高级保护工具 盈亏平衡选项 : 基本盈亏平衡 :当您的交易达到设定水平时自动保护利润。 多级盈亏平衡 :设置多达 4 个级别以逐步保护利润。 尾随止损选项 : 基本尾随
Quant AI Agents is NOT AN Expert Advisor. Quant AI Agents   is a   multi-agent AI trading framework   that turns natural-language strategy prompts into live.  WANT THE SAME RESULTS AS MY LIVE SIGNAL?   Use the exact same brokers I do:   IC MARKETS , IC TRADING   .  Unlike the centralized stock market, Forex has no single, unified price feed.  Every broker sources liquidity from different providers, creating unique data streams. Other brokers can only achieve trading performance equivalent to 60
TradePanel MT5
Alfiya Fazylova
4.87 (155)
交易面板是一款多功能交易助手。该应用包含超过50种手动交易功能,并允许您自动执行大多数交易任务。 在购买之前,您可以在演示账户上测试演示版本。下载用于演示账户的试用版应用程序: https://www.mql5.com/zh/blogs/post/762579 。 完整说明 这里 。 贸易. 只需单击一下即可执行交易操作: 打開掛單和頭寸,並自動計算風險。 一鍵打開多個訂單和頭寸。 打開訂單網格。 按組別關閉掛單和頭寸。 反轉頭寸方向(關閉買入>打開賣出,關閉賣出>打開買入)。 鎖定頭寸(通過開啟缺少的頭寸,使買入和賣出頭寸的數量相等)。 一鍵部分關閉所有頭寸。 將所有頭寸的止盈和止損設置在同一價格水平。 將所有頭寸的止損設置在盈虧平衡水平。 開倉時,可使用以下功能: 在多個訂單或倉位之間分配計算出的數量(在單擊一次時開啟多個訂單和倉位)。 在開啟訂單前在圖表上可視化交易水平。 僅在當前點差不超過設定值時才開啟倉位。 止盈和止損之間的自動比例。 虛擬止損和止盈。 自動將止損和止盈的大小增加為當前點差的大小。 基於ATR指標讀數計算止盈和止損。 設置掛單的到期日期。 為掛單設置追蹤(掛單
测试版发布 Telegram to MT5 Signal Trader 即将进入正式的 Alpha 版本。一些功能仍在开发中,您可能会遇到一些小错误。如果您遇到问题,请反馈,您的意见将帮助我们改进软件。 Telegram to MT5 Signal Trader 是一款强大的工具,能够将 Telegram 频道或群组的交易信号自动复制到您的 MetaTrader 5 账户。 支持公开和私人频道,可将多个信号提供者连接至一个或多个 MT5 账户。软件优化、高效、稳定,精准控制每笔复制交易。 界面简洁,仪表盘美观,图表交互性佳,导航直观。您可以管理多个信号账户,自定义每个提供者的设置,并实时监控所有操作。 系统需求 由于 MQL 限制,EA 需要配合 PC 端应用与 Telegram 通信。 安装程序可通过官方 安装指南 获取。 核心功能 多提供者支持: 从多渠道复制信号至多个 MT5 帐户 高级信号识别: 关键词、模式和标签全面自定义 逐提供者控制: 可启用/禁用特定信号类型、平仓策略等 灵活风险管理: 固定手数、固定金额、余额/权益百分比、部分平仓设置 可定制 SL/TP: 覆盖信号
Farmed Hedge Yield Farming | All Markets (Manual - Hybrid - Semi/Automated EA) MULTI-ASSET SUPPORT Trade any asset available on your broker - Forex: Major, Minor, Exotic pairs - Crypto: BTC, ETH, XRP, SOL, BNB - Stocks: Apple, Tesla, Amazon, Google, etc. - Commodities: Gold, Silver, Oil, Gas - Indices: US30, NAS100, SPX500, DAX40 - Any CFD your broker offers VERIFIED TRADING RESULTS - Farmed Hedge Yield Axi Copy:  https://www.mql5.com/en/signals/2356376 - Farmed Hedge Yield Exn Copy:   https:/
Power Candles 策略扫描器——自优化多符号设置查找器 Power Candles策略扫描器 采用与Power Candles指标相同的自优化引擎,可同时扫描您“市场观察”中的所有交易品种。一个面板即可显示当前哪些品种在统计上具备交易价值、每种策略的最佳应用方向、最优止损/止盈组合,并在新信号触发时立即向您发送提醒。 本工具是 Stein Investments 生态系统的一部分 - 18+ 款工具,加上 Max,您的一对一 AI 交易导师。  随时在线,深入了解每一款指标,在您需要梳理思路的那一刻就在那里。  立即认识他: https://stein.investments 您的全面市场监控。每个交易品种超过3,000次自动优化。2种警报类型。一键切换图表并采取行动。 为何您需要此工具 大多数多标的扫描器仅展示价格 波动 。每只股票的波动率、百分比变化、RSI。您仍需自行摸索正确的策略、合适的止损位以及理想的入场阈值。Power Candles策略扫描器针对每只股票自动解答这些问题,仅在数学验证过的交易设置中触发实际入场信号时才会向您发出提示。这就是全部卖点。 自动
YuClusters
Yury Kulikov
4.93 (43)
Attention: You can view the program operation in the free version  YuClusters DEMO .  YuClusters is a professional market analysis system. The trader has unique opportunities to analyze the flow of orders, trade volumes, price movements using various charts, profiles, indicators, and graphical objects. YuClusters operates on data based on Time&Sales or ticks information, depending on what is available in the quotes of a financial instrument. YuClusters allows you to build graphs by combining da
Premium Trade Manager - MetaTrader 5 快速、纪律化的交易管理工具 Premium Trade Manager 专为希望专注于决策的交易者而设计,让面板负责处理例程:仓位计算、下单、分批出场、移动止损、新闻屏蔽和资金盘限额,每笔交易都以同样纪律严明的方式执行。 这是一款用于 MetaTrader 5 的快速图表面板,接管了每笔交易中所有机械性的工作。您决定方向、品种和时机;面板根据您的风险计算仓位大小、下单并附带止损和目标位、分批减仓出场并跟踪剩余仓位。针对资金盘交易者,它更进一步:内置八家主流外汇资金盘机构的真实规则,实时显示您距每项限额的距离,并在订单即将触碰硬性限额时自动拦截。 购买前先亲手体验。 通过交互式演示,您可以直接在浏览器中点击实时面板,这是在购买前感受其工作方式的最快途径。 stein.investments/products/premium-trade-manager Premium Trade Manager 是 Stein Investments 生态系统的一部分:20 余款交易工具,以及 Max,您的一对一 AI 交易导师。 
Exp COPYLOT CLIENT for MT5
Vladislav Andruschenko
3.91 (33)
适用于 MetaTrader 5 的专业交易复制器 快速、专业、稳定可靠的 交易复制器 ,适用于 MetaTrader 。 COPYLOT 可在 MT4 和 MT5 终端之间复制 Forex 交易,并支持 Hedge 和 Netting 账户。 COPYLOT 的 MT5 版本支持: - MT5 Hedge → MT5 Hedge - MT5 Hedge → MT5 Netting - MT5 Netting → MT5 Hedge - MT5 Netting → MT5 Netting - MT4 → MT5 Hedge - MT4 → MT5 Netting MT4 版本 完整说明 + DEMO + PDF 如何购买 如何安装 如何获取日志文件 如何测试和优化 Expforex 的所有产品 您也可以将交易复制到 MT4 终端(MT4 → MT4,MT5 → MT4): COPYLOT CLIENT for MT4 COPYLOT 是一款专业的交易和持仓复制器,可同时与 2、3 甚至 10 个终端协同工作。 支持从 模拟账户和投资者账户 复制,也支持同时在多个终端上运行。 您可以使
AntiOverfit PRO MT5
Enrique Enguix
5 (5)
在购买 EA 之前,先确认它到底是真的扛得住,还是只是刚好在回测里走运。 大多数机器人都是靠一份漂亮的回测卖出去的。 曲线一路向上。 Profit Factor 很好看。 看起来几乎没有疑点。 但即便如此,很多 EA 只要市场不再按照那段历史那样运行,很快就会出问题。 为什么? 因为回测只能证明一件事: 这个策略曾经在某一条特定的价格路径上有效。 它不能证明它在其他路径下也能扛住。 不能证明它足够稳健。 更不能证明它值得你花钱。 因为你买 EA,不是为了欣赏过去那条漂亮的曲线。 你买它,是为了在会变化的市场里使用它。 AntiOverfit PRO 是做什么的 AntiOverfit PRO 帮你判断一个 MetaTrader 5 Expert Advisor 到底是真的够扎实,还是只是恰好适配某一段特定历史。 它的原理其实很容易理解: 它拿真实历史数据,生成许多与原始历史相似、但路径不同的版本,然后让你看到当市场不再完全照着原来的路线走时,这个 EA 会有什么表现。 如果你只是稍微改变一下市场路径,这个机器人就开始失效,那就是个坏信号。 而如果它在许多与原始历史相似的场景里都能稳住
MT5 to Telegram Signal Provider 是一个易于使用且完全可自定义的工具,它允许向 Telegram 的聊天室、频道或群组发送 指定 的信号,将您的账户变为一个 信号提供商 。 与大多数竞争产品不同,它不使用 DLL 导入。 [ 演示 ] [ 手册 ] [ MT4 版本 ] [ Discord 版本 ] [ Telegram 频道 ]  New: [ Telegram To MT5 ] 设置 提供了逐步的 用户指南 。 不需要了解 Telegram API;开发者提供了您所需的一切。 关键特性 能够自定义发送给订阅者的订单详情 您可以创建分层的订阅模型,例如铜、银、金。其中金订阅获得所有信号等。 通过 id、符号或评论过滤订单 包括执行订单的图表截图 在发送的截图上绘制已关闭的订单,以便额外核实 延迟发送新订单消息的可能性,以便在发送前对位置进行调整 订单详情完全透明: 新的市场订单*带截图 订单修改(止损、获利) 已关闭的订单*带截图 部分关闭的订单** 新的挂单 修改的挂单(进场价格) 挂单激活(作为新的市场订单附加) 已删除的挂单 历史订单报告
Ultimate Extractor
Clifton Creath
5 (9)
Ultimate Extractor - Professional Trading Analytics for MT5 *****this is the local HTML version of Ultimate Extractor. !!!!!it is not compatible with Cloud!!!! For the online version please reach out to me directly****** Ultimate Extractor transforms your MetaTrader 5 trading history into actionable insights with comprehensive analytics, interactive charts, and real-time performance tracking. What It Does Automatically analyzes your MT5 trading history across all Expert Advisors and generates
Trade Manager DaneTrades
Levi Dane Benjamin
4.28 (29)
交易管理器可帮助您快速进入和退出交易,同时自动计算风险。 包括帮助您防止过度交易、报复性交易和情绪化交易的功能。 交易可以自动管理,账户绩效指标可以在图表中可视化。 这些功能使该面板成为所有手动交易者的理想选择,并有助于增强 MetaTrader 5 平台。多语言支持。 MT4版本  |  用户指南+演示 交易经理在策略测试器中不起作用。 如需演示,请参阅用户指南 风险管理 根据%或$自动调整风险 可选择使用固定手数或根据交易量和点自动计算手数 使用 RR、点数或价格设置盈亏平衡止损 追踪止损设置 最大每日损失百分比,在达到目标时自动平仓所有交易。 保护账户免遭过多提款并阻止您过度交易 最大每日损失(以美元为单位)在达到目标时自动关闭所有交易。 保护账户免遭过多提款并阻止您过度交易 一键实现所有交易的盈亏平衡 自动计算从手机/电话发送的交易的风险 OCO 在设置中可用 交易和头寸管理 通过设置每月、每周、每天、每小时或每分钟的最大交易次数,停止过度交易和报复性交易。 高级挂单管理。 调整何时关闭挂单的规则 追踪挂单 支持市价订单和挂单 每日最大利润目标(以美元为单位)以确保头寸并停止
MetaTrader 5 专业交易面板 —— 图表与键盘一键交易的高效控制中心 一款面向主动交易者的专业 Trading Panel,可让您比标准 MetaTrader 操作方式更快、更直观地完成开仓、平仓、修改、管理与控制。 这不是一个普通的小工具,而是一个为高频手动操作、仓位管理、挂单控制与利润管理而设计的完整交易工作台。 通过这套面板,您可以直接在图表上一键执行交易,通过键盘快速触发核心操作,并借助自动参数计算、图形提示、信息标签以及可视化管理功能,大幅减少重复性操作,让整个交易流程更加流畅、高效且专业。 使用我们的交易面板,您可以直接从图表上一键下单,执行交易操作的速度可比标准 MetaTrader 控件快约 30 倍。 MT4 版本 | 完整说明 + DEMO + PDF | 如何购买 | 如何安装 | 如何获取日志文件 | 如何测试与优化 | Expforex 的所有产品 为什么交易者会选择这套面板 图表一键交易 ,并支持键盘快速操作 快速完成开仓、平仓、修改、反转、锁仓与部分平仓 深度控制仓位、挂单、总利润与风控逻辑 自动参数计算,减少手动输入与重复劳动 图表可视化管理
Custom Alerts AIO:多市场智能监控,一键启动,无需设置 概述 Custom Alerts AIO 是一款“开箱即用”的高级市场扫描工具,无需额外安装任何其他指标或进行复杂设置。它内置了 Stein Investments 的所有核心指标(FX Power、FX Volume、FX Dynamic、FX Levels 和 IX Power),可帮助您轻松监控所有主要资产类别,如外汇、黄金、指数和加密货币。如果您的经纪商支持股票,您也可以手动添加个股进行监控。 1. 为什么选择 Custom Alerts AIO? 无需额外购买任何指标 • 所有关键指标均已内置,开箱即用。 • 专注于实时预警,不包含任何图形元素,性能高效,界面简洁。 全面覆盖所有主要市场 • 支持监控外汇、金属、加密货币和指数市场。 • 无需手动输入任何交易品种,只需在设置中勾选资产类别即可启用。 • 股票并不属于默认类别,如有需要可手动通过参数输入添加。 高效、专业、便捷 • 无需图表模板和手动加载,适合自动化或远程交易环境。 • 非常适合 VPS 上长期运行,或作为后台市场预警工具使用。 2
Poc Breakout Signal: The Ultimate Institutional Order Flow & Price Action System Elevate your trading with Poc Breakout, a comprehensive technical analysis tool designed to bridge the gap between retail trading and institutional market understanding. This all-in-one system combines powerful Buy/Sell signals, advanced Volume Profile analysis, real-time Order Flow (Depth of Market), and critical macroeconomic data to give you a clear, unambiguous edge in the markets. Poc Breakout Signal decodes c
Timeless Charts
Samuel Manoel De Souza
5 (5)
Timeless Charts is an all-in-one trading utility for professional traders. It combines custom chart types such as Seconds Charts and Renko with advanced order flow analysis using Footprints , Clusters , Volume Profiles , VWAP studies, and anchored analysis tools for deeper market insight. Trading and position management are handled directly from the chart through an integrated trade management panel , while Market Replay and Virtual Accounts provide environments for practicing trading skills and
The News Filter MT5
Leolouiski Gan
4.77 (22)
这个产品在新闻时间过滤所有的专家顾问和手动图表,因此您不必担心突然的价格波动会破坏您的手动交易设置或其他专家顾问输入的交易。此产品还带有完整的订单管理系统,可在任何新闻发布前处理您的持仓和挂单。一旦您购买了   The News Filter ,您将不再需要依赖以后的专家顾问内置的新闻过滤器,因为这个产品可以从此过滤它们所有。 新闻选择 新闻来源于Forex Factory的经济日历。 选择可以基于任何一种货币,如USD,EUR,GBP,JPY,AUD,CAD,CHF,NZD和CNY等。 选择也可以基于关键识别,例如Non-Farm (NFP),FOMC,CPI等。 能够选择新闻影响级别的筛选,从低、中、到高影响。 自动模式只选择与图表相关的新闻。 新闻来源每小时自动刷新,以确保最新的新闻数据。 为每个新闻影响级别提供单独的输入,以确定您要过滤掉的新闻发布前后的分钟数。 订单管理选项 在新闻发布前关闭未平仓头寸的选项,并在新闻发布后恢复它们。 在新闻发布前删除挂单的选项,并在新闻发布后恢复它们。 在新闻发布前移除止损和止盈水平的选项,并在新闻发布后恢复它们。 在新闻发布前移动止损和
Footprint Chart Pro — Professional OrderFlow EA for MetaTrader 5 Version 6.34 | Professional tool for real traders | Institutional-Grade Visualization DEMO USERS - PLEASE SELECT EVERY TICK / REAL TICK WHEN TESTING AND YOU HAVE DOWNLOADED HISTORICAL DATA. IF YOU SEE A WAITING SCREEN AND IT IS NOT DOWNLOADING, IT MEANS YOU HAVE LOW HISTORICAL DATA. TRY 1 MIN AND 5 MIN FIRST ON 1 DAY DATA. ONE DAY DATA SHOULD BE THE NEWEST AND MOST CURRENT DATE. PLEASE WAIT UNTIL THE MARKET HAS ROLLED OVER PERIOD.
Signal TradingView to MT5 Pro Automator TradingView 与 MetaTrader 5 之间的即时专业执行 使用最强大的桥梁,将 TradingView 警报与 MT5 中的实际执行连接起来,实现交易策略的自动化。这款 Expert Advisor 专为要求速度、灵活性和完美风险管理的交易者设计,可将任何警报消息转化为精确的市价或限价订单。 优势与特点 通用解析引擎(专有): 先进技术,能够自动识别并提取任何警报格式中的数据。您不再受限于单一的死板格式;系统会自动理解交易品种(Symbol)、操作(Action)、价格(Price)、止损(SL)和止盈(TP)。 实时执行: 极速轮询技术(低于 1 秒),经过优化可将延迟降至最低。接收到信号后,订单将在毫秒内执行。 机构级风险管理: 基于以下方式自动精确计算手数: 净值/余额百分比(% of Equity/Balance): 每笔交易承担固定账户百分比的风险。 风险金额(Risk Amount): 设定在触发止损时损失的固定货币金额(例如:100 美元)。 固定手数(Static Lots)
AlgoRadar
Stephen J Martret
5 (4)
AlgoRadar is an on-chart analytics dashboard for MT5 that aggregates Expert Advisor performance across multiple accounts, brokers, and platforms, including both MT4 and MT5 data, into a single live view on your MT5 chart. All analysis runs from the chart interface, with no external applications or manual report processing required. EA Analysis and Ranking For traders running multiple Expert Advisors, AlgoRadar provides a consolidated view of each EA's performance across accounts. Active EAs a
Anchor Trade Manager
Kalinskie Gilliam
5 (2)
Anchor: The EA Manager Run your full EA portfolio without conflicts, without stacked risk, and without watching every chart yourself. Anchor coordinates up to 64 Expert Advisors on a single account so only one trades at a time. Attach Anchor to any chart. Type your EA names and magic numbers in one line. Anchor handles the rest. Built for portfolios. Built for discipline. Built for prop firms. The Problem Running multiple EAs on the same account creates risk. Two gold EAs can open opposite posit
The product will copy all telegram signal to MT5 ( which you are member) , also it can work as remote copier.  Easy to set up, copy order instant, can work with almost signal formats, image signal,  s upport to translate other language to English Work with all type of channel or group, even channel have "Restrict Saving Content", work with  multi channel, multi MT5 Work as remote copier: with signal have ticket number, it will copy exactly via ticket number. Support to backtest signal. How to s
Telegram to MT5 Coppy
Sergey Batudayev
5 (9)
Telegram 到 MT5: 终极信号复制解决方案 使用 Telegram 到 MT5 简化您的交易,这款现代化工具可直接从 Telegram 频道和聊天室复制交易信号到您的 MetaTrader 5 平台,无需 DLL 文件。这款强大的解决方案可确保精准的信号执行、丰富的自定义选项,节省时间并提高您的效率。 [ Instructions and DEMO ] 主要特点 直接 Telegram API 集成 通过电话号码和安全码进行身份验证。 通过用户友好的 EXE 桥轻松管理聊天 ID。 添加、删除和刷新多个频道/聊天以同时复制信号。 使用高级过滤器进行信号解析 跳过包含异常词(例如“报告”、“结果”)的不需要的信号。 支持灵活的 SL 和 TP 格式:价格、点数或点数。 自动计算指定点而不是价格的信号的切入点。 订单定制和灵活性 使用多种模式配置订单大小:固定手数、动态手数(% 风险)或特定符号手数。 使用信号数据或自定义参数调整 SL/TP。 设置滑点限制、挂单到期时间和重试参数,以实现无缝执行。 综合符号管理 排除特定符号或映射到特定经纪人的符号。 自定义信号和经纪商符号之间
DrawDown Limiter
Haidar Lionel Haj Ali
5 (20)
Drawdown Limiter EA You are in the right place if you were searching for Drawdown control, Drawdown limiter, Balance protection, Equity Protection or Daily Drawdown Limit related to Prop Firm, FTMO, or Funded account trading, or if you want to protect your trading account. Have you suffered from controlling your drawdown when trading funded accounts? This EA is meant for you. Prop firms usually set a rule called “Trader Daily Drawdown”, and if it is not respected, you are disqualified.  I am an
MT5 Trading Deck
Manuel Michiels
5 (2)
One button. One trade. MT5 Trading Deck is a hotkey trading panel for MetaTrader 5 that turns the platform into a keyboard-driven execution cockpit. Stop loss, take profit and lot size are pre-calculated for every key; the moment you press, a market order is live on the broker. A complete technical user manual is attached in the product Comments section. It documents every input parameter, the full hotkey map, the recommended Stream Deck XL layout, and the advanced workflows for Pre-Limit orders
Auto Trade Copier 被设计成多的MT5账户/端子,绝对精度之间复制交易。 有了这个工具,你可以充当要么提供商(源)或接收(目的地) 。每一个交易行为将由提供商克隆到接收器,没有延迟。 以下是亮点功能:     在一个工具提供商或接收器之间转换角色。     一个供应商可以交易复制到多个接收者的账户。     绝对兼容MT5的顺序/位置管理规则,该规则允许与调整容积为每个符号只有一个位置。     自动识别和同步代理之间的符号后缀。     允许高达5特殊符号的设置(即: GOLD - > XAUUSD ,等等) 。     多lotsize设置选项。     允许过滤的订单类型将被复制。     关断端子或电源关闭后恢复以前的设置和状态。     实时控制面板。     使用方便,界面友好。 用法: - 安装工具提供的MT5终端,并选择角色“提供者” ,然后启用它。 - 安装工具接收的MT5终端,并选择角色的“接收器” ,输入提供商的帐号,然后启用它(你可以有很多接收者的帐户,只要你想) 。 设置和参数:      特殊符号设置(菜单) : 配置高达5对特殊
SMC Trade Pilot MT5 面向Smart Money Concepts交易者的半自动交易助手。在Telegram上接收带有图表截图的交易信号,然后通过一次点击下单。即使远离电脑,也可以从手机管理仓位。 解决的问题 Smart Money形态不会等您。Order Blocks和Liquidity Sweeps在伦敦开盘、纽约开盘或亚洲交易时段形成,而您往往在工作、开会或远离屏幕。当您查看图表时,形态早已过去。 SMC Trade Pilot将您的手机变成实时交易驾驶舱。本产品全天候扫描图表寻找SMC信号。当形态出现时,它会向您的Telegram发送完整的交易订单:图表截图、方向、入场价、建议止损、建议止盈、质量评分。由您决定。点击执行或点击跳过。 工作流程 本产品在后台监控图表。 检测到Smart Money信号时(BOS、ChoCH、Pending Break、新Order Block或Liquidity Sweep),Telegram会收到包含图表截图、信号详情和SL/TP建议的丰富消息。 三个内联按钮供您决策:EXECUTE、SKIP、MODIFY。 执行后,消息会更
Overview AlphaForge Range Chart is a professional non-trading range-bar charting utility for MetaTrader 5. It generates live Range charts as MT5 custom symbols, helping traders analyze price movement through fixed-range bars instead of standard time-based candles. Unlike visual-only overlays, the generated Range chart behaves like a real MT5 custom-symbol chart. This means you can open it as a normal chart, apply templates, draw analysis objects, and add indicators directly to the Range chart fo
作者的更多信息
This indicator is designed for M1 timeframe and shows: Sum of points when the price goes up (Green Histogram). Sum of points when the price goes down (Red Histogram).  In other words, by the number and ratio of bullish points to bearish ones, you can do a technical analysis of the state of the market. If the green histogram prevails over the red one, you can conclude that at the moment the buyers are stronger than the sellers, and vice versa, if the red histogram prevails over the green, the se
This Multi TimeFrame indicator is based on the "Fractals" classical indicator. 2 Inputs: TimeFrame1; TimeFrame2; You can put any available TimeFrame values (from M1 (Period_M1) to MN1 (Period_MN1)) equal or greater ( >= ) than the Period of the current Time Frame. The last Fractals will shown as color lines (Dots Line) of Support and Resistance for the Price moving.
This is a Multi-Time indicator which allows to display RSI and Stochastic indicators from upper timeframes on a single chart. As an example: a single chart EURUSD M5 and RSI (blue line) and Stochastic (yellow line) from H1. Red Histogram is representing Lower trend and Green Histogram is representing Upper trend.
When you put this Multi TimeFrame Parabolic SAR indicator on the chart it will automatically use Parabolic SAR from next available 3 timeframes. Green arrow will show the beginning of Up trend and Red arrow will show the beginning of Down trend. If AlertsEnabled = true, the indicator will show the Alert (message window) with a text like this: "Price going Down on ", Symbol(), " - ", Period(), " min", " price = ", Bid; If eMailEnabled = true the Indicator will send you an eMail with the same text
The zero line is characterized the Flat trend. V-shaped impulse indicates the entrance to the opposite direction. U-shaped impulse = entry orders in the same direction. If AlertsEnabled = true, the indicator will show the Alert (message window) with a text like this: "Price going Down on ", Symbol(), " - ", Period(), " min", " price = ", Bid; If eMailEnabled = true the indicator will send you an eMail with the same text an Alert message with subject: "Trinity-Impolse" (of course you have to chec
The indicator displays the usual Moving Average with input parameters: maPeriod_1; maMethod_1; maAppPrice_1. Then it calculates and displays MA on MA1 with input parameters: maPeriod_2; maMethod_2. Then it calculates and displays MA on MA2 with input parameters: maPeriod_3; maMethod_3. If AlertsEnabled = true the Indicator will show the Alert (message window) with a text like this: "Price going Down on ", Symbol(), " - ", Period(), " min", " price = ", Bid; If eMailEnabled = true the Indicator w
Multi TimeFrame Indicator "MTF CCI Trigger" based on the Commodity Channel Index from the upper TF (input parameter "TimeFrame") yellow line. Aqua line is representing ATR envelopes from the current TF. Green and Red arrows is triggered by CCI and represented UP and DOWN trends accordingly.
The BBImpulse indicator is based on the standard Moving Average indicator. You have MA input parameters: maPeriod - Moving Average period; maMODE - Moving Average mode (0 = MODE_SMA; 1 = MODE_EMA; 2 = MODE_SMMA; 3 = MODE_LWMA); maPRICE - Applied price (0=PRICE_CLOSE; 1=PRICE_OPEN; 2=PRICE_HIGH; 3=PRICE_LOW; 4=PRICE_MEDIAN; 5=PRICE_TYPICAL; 6=PRICE_WEIGHTED). Green Histogram is representing an UP-trend, Red Histogram is representing a Down-trend.
Multi TimeFrame indicator MTF ADX with Histogram shows ADX indicator data from the TF by your choice. You may choose a TimeFrame equal or greater than current TF. Yellow line is representing a price trend from the upper TF. Green line is representing +DI from the upper TF. Red line is representing -DI from the upper TF. Green histogram is displaying an Up-trend. Red histogram is displaying a Down-trend.
This Indicator creates 2 white lines based on Exponential Moving Averag e of High and Low prices. You can regulate how many bars will be involved in the calculation with input parameter HL_Period. Red and Blue arrows are displaying the moment to go Short and Long trades accordingly.
The most common way to interpreting the price Moving Average is to compare its dynamics to the price action. When the instrument price rises above its Moving Average, a buy signal appears, if the price falls below its moving average, what we have is a sell signal. To avoid a spontaneous entries one may use this update from Moving Average Indicator = Stepper-MA.
Envelopes technical Indicator is formed with two Moving Averages one of which is shifted upward and another one is shifted downward. Envelopes define the upper and the lower margins of the price range. Signal to sell appears when the price reaches the upper margin of the band; signal to buy appears when the price reaches the lower margin. To avoid a spontaneous entries one may use this update from Envelopes Indicator = Envelopes-Stepper.
The interpretation of the Bollinger Bands is based on the fact that the prices tend to remain in between the top and the bottom line of the bands. Abrupt changes in prices tend to happen after the band has contracted due to decrease of volatility; If prices break through the upper band, a continuation of the current trend is to be expected; If the pikes and hollows outside the band are followed by pikes and hollows inside the band, a reverse of trend may occur; The price movement that has starte
Fibonacci sequence is defined by integer sequence: 0, 1, 1, 2, 3, 5, 8, 13, 34, 55, 89, 144, ... By definition, it starts from 0 and 1, the next number is calculated as a sum of two previous numbers. Instead of the standard moving average, the indicator uses the caluclation of average price in form: Bar0 + Bar1 + Bar2 + Bar3 + Bar5 + Bar8 + Bar13 +... Input parameters:  FiboNumPeriod (15) - Fibonacci period; nAppliedPrice (0) - applied price (PRICE_CLOSE=0; PRICE_OPEN=1; PRICE_HIGH=2; PRICE_LOW=
This indicator present a main Moving Average line with input parameters maPeriod_1, maMethod_1 and maAppPrice_1. The second line will be a calculation of the Moving Average data of a first line with input parameters maPeriod_2, maMethod_2. The third line will be a calculation of the Moving Average data of a second line with input parameters maPeriod_3, maMethod_3. To avoid a spontaneous entries one may use this indicator-stepper.
Average Bar
Leonid Basis
This indicator (as almost all others) is based on classical Moving Averages. It shows the Average Bar under the current bar colored in aqua or over the current bar colored in orange. Input Parameters: ma_Period and ma_Method. The Average Bar maybe helpful to predict where the price will move in the nearest future. Of course, this "near future" depends of the current time frame.
Buy when the market is falling and sell when the market is rising. When the market is moving down you start observing and looking for buy signals. When the market is moving up you start looking for sell signals. This indicator points to the moments to Buy (Blue arrow) and to Sell (Orange arrow). Two input parameters: barsNumber and step for optimization (depending on symbol and Time Frame).
This indicator shows: A green light in case the price goes up; A red light in case the price goes down; A yellow light in case there are a sideways trend. A sideways trend is the horizontal price movement that occurs when the forces of supply and demand are nearly equal. This typically occurs during a period of consolidation before the price continues a prior trend or reverses into a new trend
Sum of Ticks
Leonid Basis
This indicator is created for M1 timeframe. It shows how many ticks has occurred during current minute and ( after the slash) the sum of points Up (aqua color) and Down (orange color). In times of a high trading activity a grow up number of ticks Up and Down will signal of a big move of the price in the near future. In times of a high trading activity a grow up number of sum of points Up and Down will signal of a big move of the price in the near future too.
CCI Envelopes
Leonid Basis
Two yellow lines. This is similar to classical Envelopes but with automatic deviation. The Envelopes indicator is   a tool that attempts to identify the upper and lower bands of a trading range. Aqua line. This is a classical Commodity Channel Index added to the Envelopes on the chart, not in a separate window. The Commodity Channel Index ( CCI ) is a technical   indicator   that measures the difference between the current price and the historical average price.
Probability
Leonid Basis
Probability deals with the likelihood of an event happening.   Forex   probability indicates a possibility at a specific time. This is because the forex market is highly volatile, and predicting future events affecting it is impossible. This indicator will show a positive number above the current High or negative number under the current Low as a probability of the trend. Higher time frames usually show a higher probability, even more then 100%.
Envelopes is an excellent indicator when the market is trending. Open Long position when the ClosePrice crossed the upper Aqua band. Close Long position when the Price crossed the upper Yellow band moving down. Open Short position when the ClosePrice crossed the lower Aqua band. Close Short position when the Price crossed the lower Yellow band moving up.
Moving Average Bars is a self-explanatory indicator with one input parameter: nPeriod. When the previous Price Close is above the previous indicator Bar, the probability to go Long is very high.   When the previous Price Close is under the previous indicator Bar, the probability to go Short is very high.
This indicator is based on the same idea as https://www.mql5.com/en/market/product/2406 , but instead of Average Bars it uses series or Fibonacci sequence. When the previous Price Close is above the previous indicator Bar, the probability to go Long is very high. When the previous Price Close is under the previous indicator Bar, the probability to go Short is very high.
This indicator is based on two ideas: Correlations between 5 main currency pairs: EURUSD, GBPUSD, USDCHF, USDJPY, USDCAD; US Dollar Index = the value of the United States dollar relative to a basket of foreign currencies. The use of the indicator is the same as classical  Commodity Channel Index  (CCI) indicator. CCI is calculated with the following formula:  (Typical Price - Simple Moving Average) / (0.015 x Mean Deviation) (Typical Price - Simple Moving Average) / (0.015 x Mean Deviation)
Tick by Tick
Leonid Basis
A  tick  is a measure of the minimum upward or downward movement in the  price  of a security. A  tick  can also refer to the change in the  price  of a security from one trade to the next trade.  This indicator will show amounts of ticks when the price goes up and down. This indicator is designed for M1 time frame and shows: Sum of points when the price goes up (Green Histogram). Sum of points when the price goes down (Red Histogram). 
This indicator is a combination of 2 classical indicators MA and RVI. The Relative Vigor Index (RVI) is a momentum indicator used in technical analysis that measures the strength of a trend by comparing a security's closing price to its trading range while smoothing the results using a simple moving average   The input parameter  counted_bars  determines how many bars the indicator's lines will be visible. The input parameter MaRviPeriod  is used for MA and RVI calculation.
This indicator is a combination of 2 classical indicators: MA and Force Index. The input parameter  counted_bars  determines on how many bars the indicator lines will be visible. The input parameter  MaForcePeriod  is used for MA and Force calculation. You may go Long if the current price crossed Up the Ribbon (HISTOGRAM)  and you may go Short if the current price crossed Down the Ribbon (HISTOGRAM)
This indicator is a combination of 2 classical indicators: MA and CCI. Two moving averages form Upper and Lower bands. The input parameter  counted_bars  determines on how many bars the indicator's lines will be visible. The input parameter  barsNum  is used for MA and CCI calculation.
This indicator is using 2 classical indicators: Commodity Channel Index from the higher TF (which you may change using input parameter TimeFrame ) and Average True Range from the current TF. The Green ribbon indicates the upper trend and the Red ribbon indicates the down trend. Buy when the Yellow line crosses the Upper bound (Aqua line). Sell when the Yellow line crossover the Lower bound (Aqua line).
筛选:
无评论
回复评论