Pending Orders Grid Drag and Drop MT5
- ユーティリティ
- バージョン: 4.6
- アップデート済み: 18 11月 2021
- アクティベーション: 5

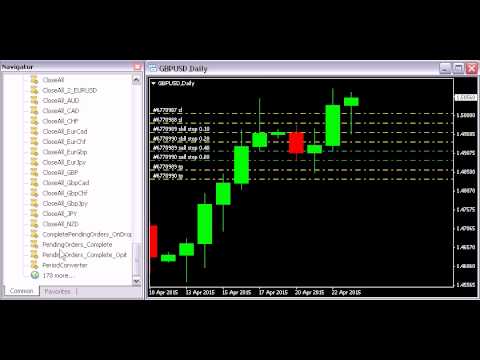
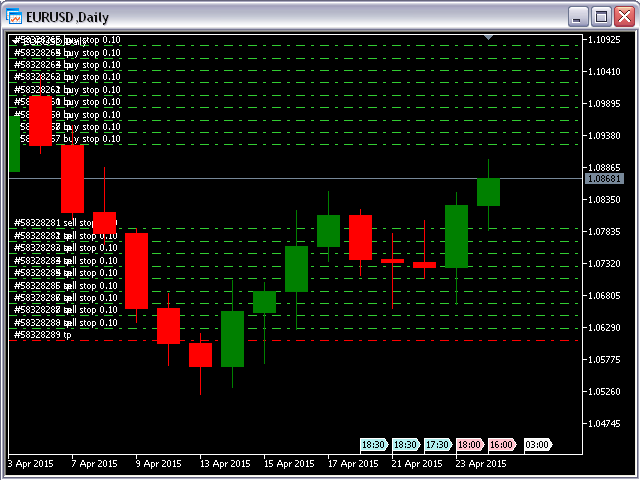
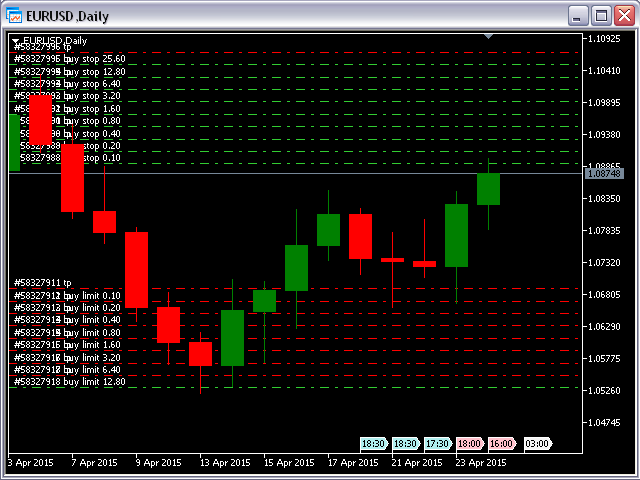
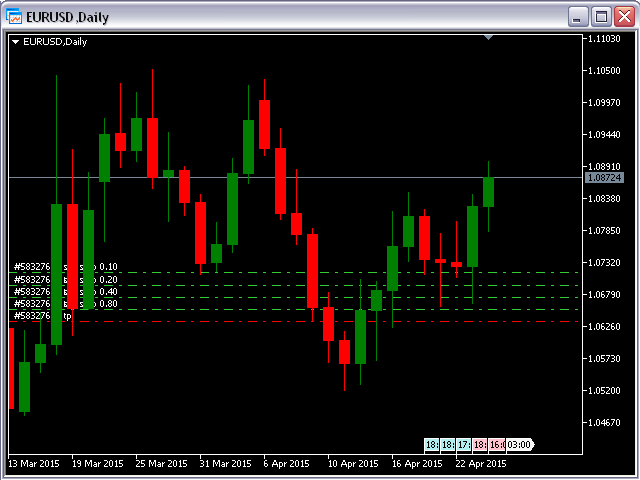
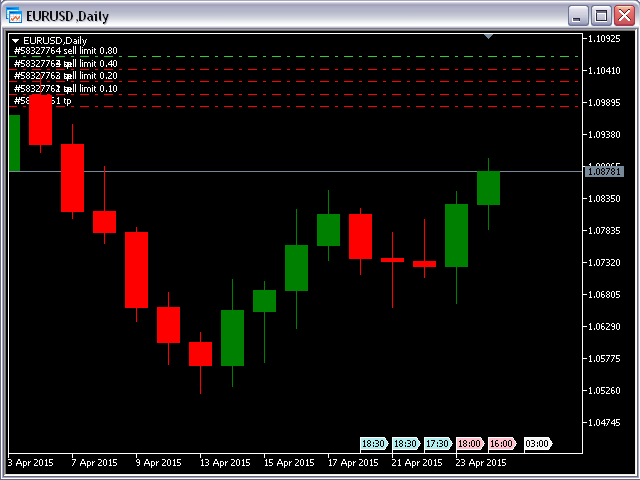
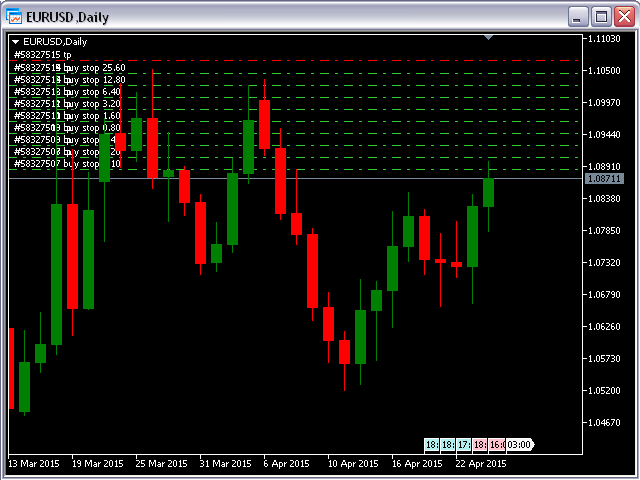
Pending Orders Grid Complete System opens any combination of Buy Stop, Sell Stop, Buy Limit and Sell Limit pending orders and closes all existing pending orders.
You will be able to Drag-and-Drop the Script on the chart and it will pick up the start price for the first position in the grid from the "Drop" point. Usually it should be in the area of Support/Resistance lines.
Input Parameters
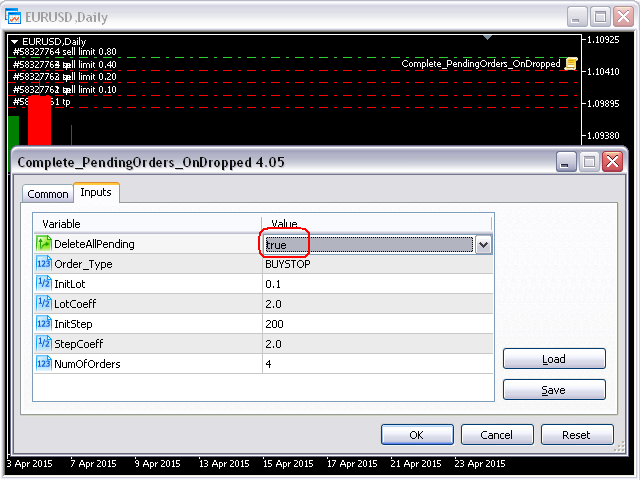
Before placing all pending orders, the input window is opened allowing you to modify all input parameters:
- DeleteAllPendings - if true, then all pending orders (for the current currency) will be deleted. (No pending orders will be created!);
- Order_Type - you can choose what kind of pending orders you want to use (Buy Stop, Sell Stop, Buy Limit or Sell Limit);
- InitLotSize - initial lot size;
- LotCoeff - if 1, all pending orders will have the same lot size;
- NumOfOrders - number of pending orders you want to place on the chart;
Attention
- If DeleteAllPendings=true, then the script will be able to delete existing pending orders for the current currency pair only.
- You have to allow automated trading on the "Expert Advisors" tab (Tools->Options).
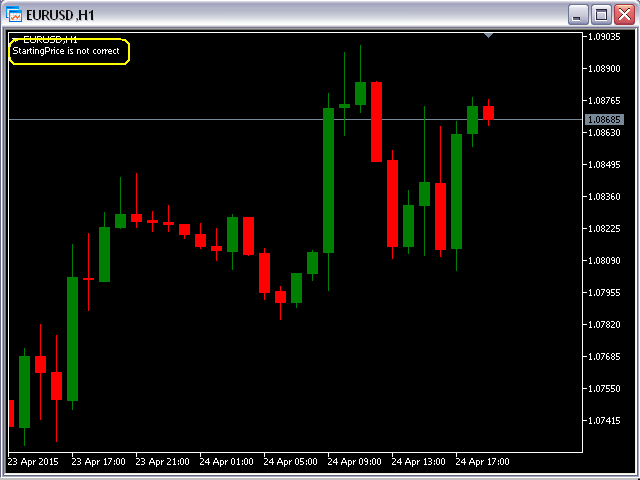
- You must drop the script on a legitimate Starting Price area on the chart for the first position in the grid. Comment will appear in the left upper corner of the chart if the Price is not right or too close to the current price: "StartingPrice is not correct".