Carrion Day Trading MT5
- 指标
-
Tsheko Kutumela
 Hi welcome to my profile my name is Andre. I am a self taught software developer with proven problem solving abilities. I graduated in Information Technology in 2021. I have 5+ years in computer programming. Skilled in Frontend and Backend Development. Goal driven and always up for challenges
 - 版本: 1.1
- 激活: 5
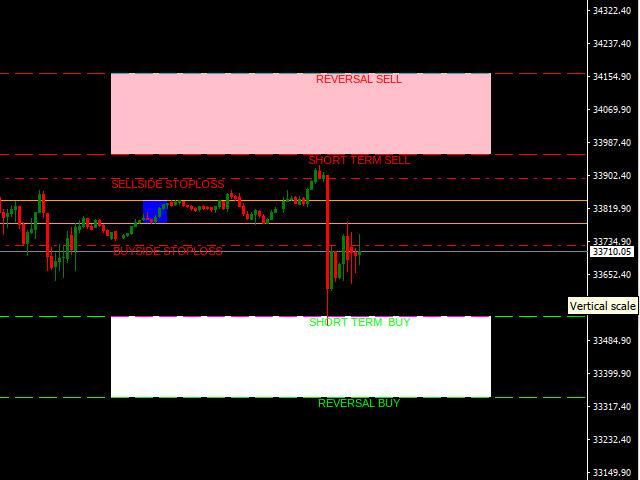
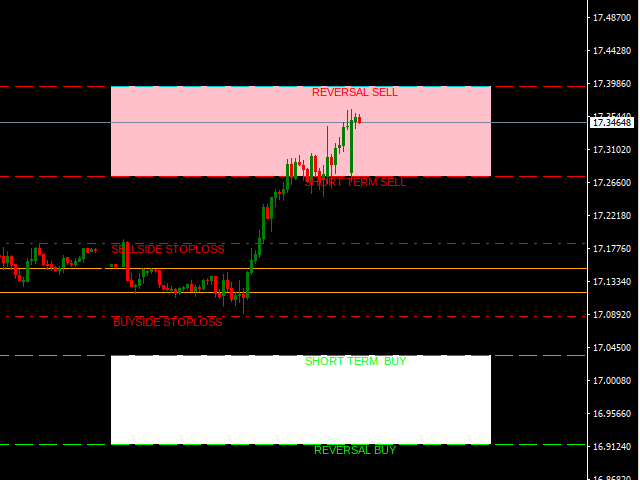
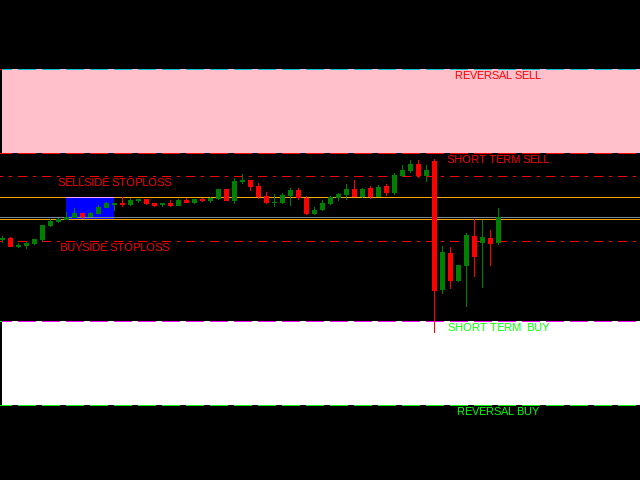
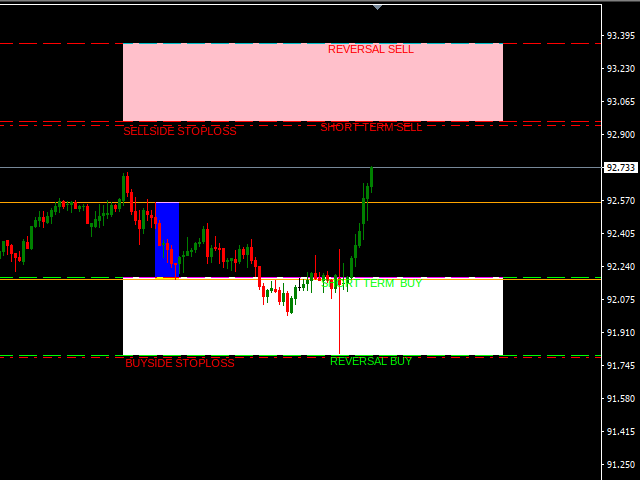
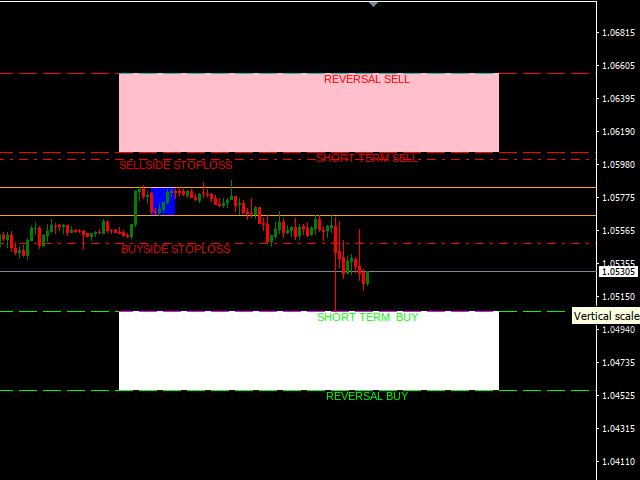
This indicator is developed based on the multiple session trading to aid in analysis for all the day traders. The indicator supports all currency pairs as well as other trading instruments like indicies, commodities, metals ,etc.
The way the indicator work is by making analysis on your behalf. During asian session that's when the indicator does the calculations and provided trading plans in form of areas on the chart for the current day. And this process happens everyday which allows for hands free trading in terms of analysis and it never rapaint.
How to trade the market using Carrrion Day Trading Indicator
There are various way you can trade the indicator being :-
1. Wait for the market to break out of the asian arange highlighted by the blue rectangle and take out either Buyers/Sellers stoploss and take a trade in the opposite direction.
2. Wait for the market to play out and either enter a buy/sell zone represented by the pink and white rectangle and take a trade in those zone.
How the indicator draw the zones on the charts is by calculating price for x-amount of days to determine how many pips/points the martket might move for the given day. The areas where the stoplosses might placed are calculated by how much the market has moved in the asian box highlighted by the blue rectangle
More in-depth explanation is linked on the video