Dynamic Double Moving Averages
- 指标
- 版本: 1.0

Moving averages change on the move. The indicator automatically selects the period for calculating moving averages. The more directional the movement, the longer the averaging period. When the trend slows down, the period of the moving averages decreases and they become faster. This allows you to react faster to a trend change.
The indicator works well in a trend or at a trend reversal point. In the sideways direction, the indicator can be used the other way around, for example, when a fast moving one crosses a slow one upwards-this is a sell signal. Or you can use the channel to determine the approximate purchase or sale zones. Channel display can be enabled in the settings.
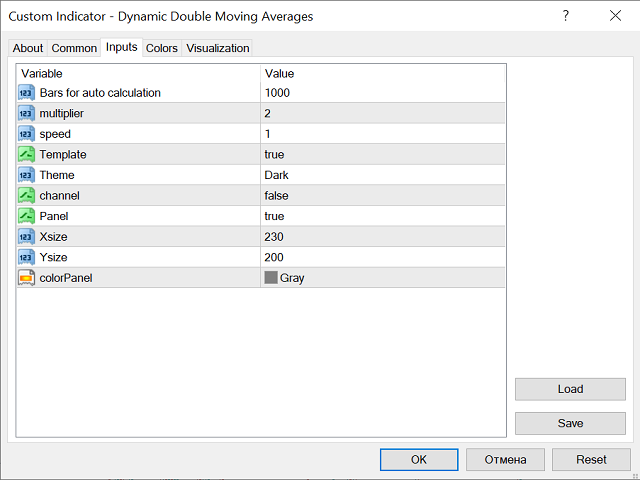
Parameters:
Bars for auto calculations - for this number of bars, the indicator finds extremes and, depending on the time of the last extreme, calculates the period for moving averages.
multiplier - sets the difference between moving averages.
speed - changes the rate of transition of moving averages from one period to another.
channel - enables or disables the channel display.
There are also other settings for the convenience of the interface.
There is no parameter in the settings for changing the period of moving averages.
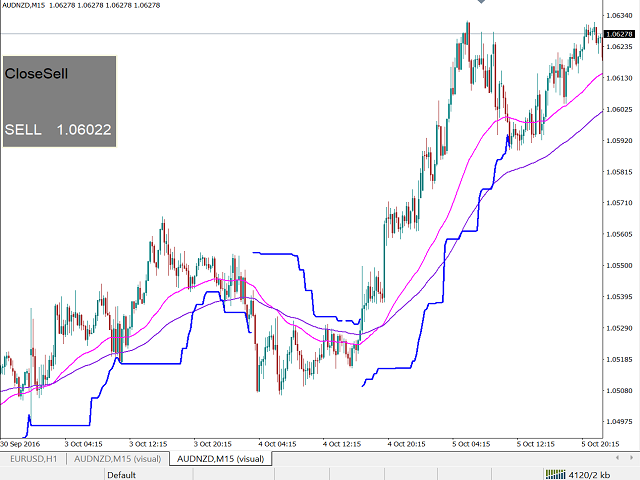

This is a cool indicator if your going to have moving average crossovers, but my problem was the size and location of the advisory box. The size of the box can be adjusted, but it should not be in the location where candles need to be viewed. It would also be nice to be able to adjust the moving averages to what others use. But they appear to be set in stone. Thank you for sharing.