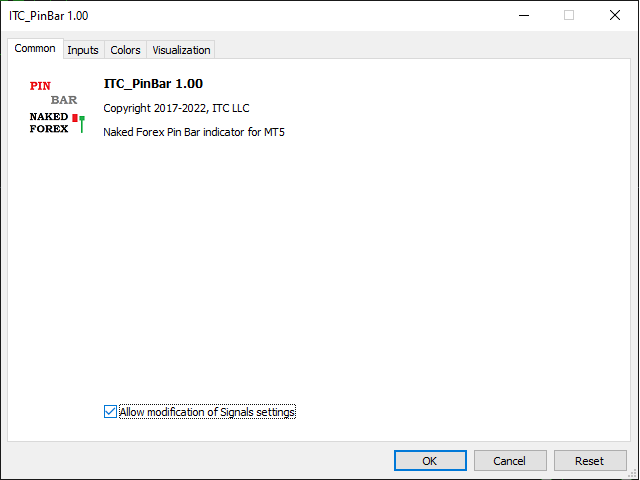
Naked Forex Pin Bar indicator for MT5
- 指标
-
Renaud Herve Francois Candel
 ITC SOFTWARE is a technology company based in the United States since 2010.
🟠🔴 The company develops financial software and indicators for different trading platforms:
-Metatrader 4 and Metatrader 5
-TradingView
-NinjaTrader - 版本: 2.30
- 更新: 4 七月 2023
- 激活: 5
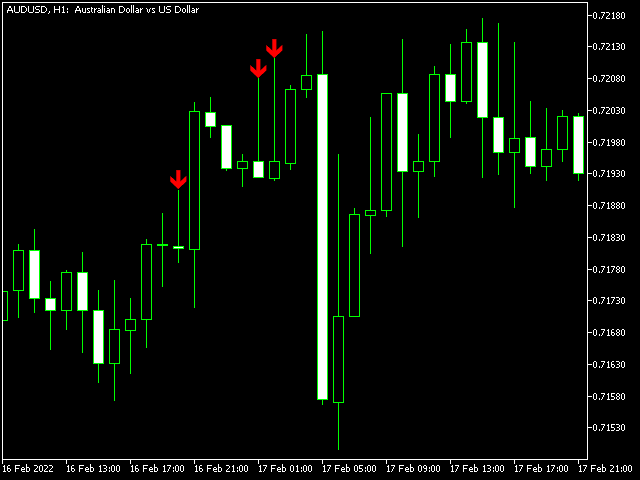
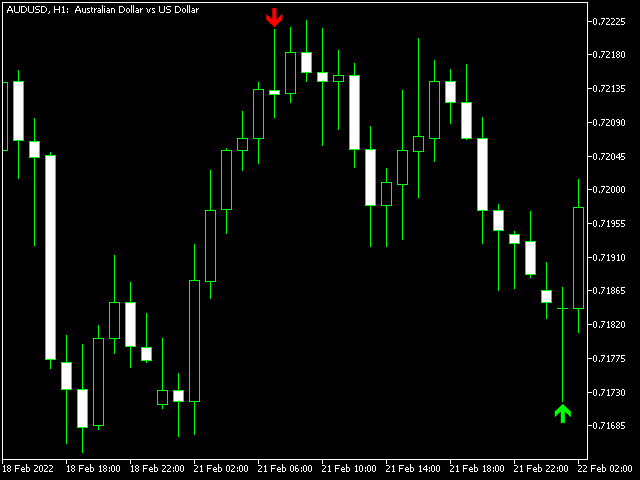
Pin Bar Indicator
The Pin Bar indicator is a pattern recognition indicator for Forex, Stocks, Indices, Futures, Commodities and Cryptos.
The strategy that comes with the Pin Bar pattern is based on price action.
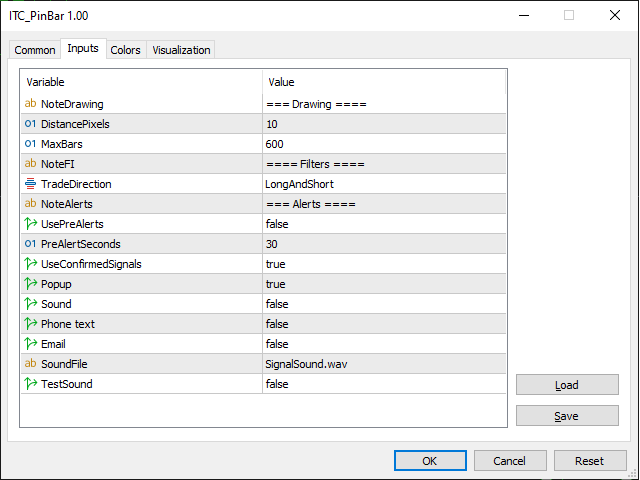
Inputs of the indicator are:
- Distance: distance in pixels relative to top or bottom of candle to display the arrow symbol
- UseAlerts (true/false): enable alerts
- PopAlerts (true/false): enable alerts in the popup window
- EmailAlerts (true/false): enable email alerts
- PushAlerts (true/false): enable push notifications
- SoundAlerts (true/false): enable sound alerts
- SoundFile: file to be used for sound alerts
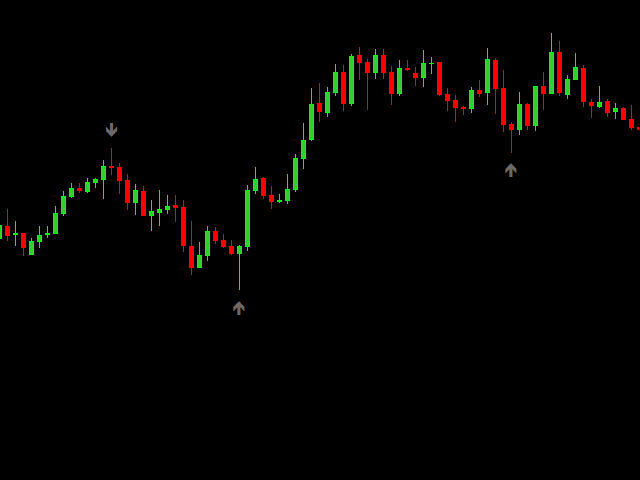
- For BUY: wait for a bullish Pin Bar to print on a support zone after a down trend. Wait for the price to break high of the Pin Bar (5 pips above the high for H1 and higher timeframes, 1 pip for M5). Immediately enter in the trade once high is broken. You also can use a BUY STOP order placed 5 pips above the high of the candle (plus spread). Stop Loss should be placed below the low of the Pin Bar. If order is not triggered in the next candle, then a trade is invalidated and should be canceled.
- For SELL: wait for a bearish Pin Bar to print on resistance zone after an up trend. Wait for the price to break the low of the Pin Bar (5 pips below the low for H1 and higher timeframes, 1 pip for M5). Immediately enter in the trade once low is broken. You also can use a SELL STOP order placed 5 pips below the low of the candle. Stop Loss should be placed above the high of the Pin Bar. If order is not triggered in the next candle then trade is invalidated and should be canceled.
We also offer the Naked Forex Kangaroo Tail indicator which is an enhanced version of the Pin Bar and that might be of interest for you.
The Pin Bar indicator can be used with any timeframe.
The Pin Bar indicator can be used with any class of asset: Forex, Stocks, Indices, Futures, Commodities and Cryptos.
Other indicators for MT4:
We developed more than 60 indicators and utilities for Metatrader 4 and Metatrader 5.
Indicators for MT5:
All our indicator are developed both for MT4 and MT5.
List of all our indicators:
👉 You can get the complete list of our indicators visiting our profile page.