Trend Viewer Pro MT5
- 指标
- 版本: 1.4
- 激活: 15

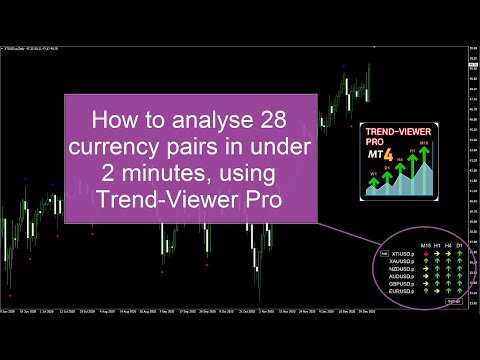
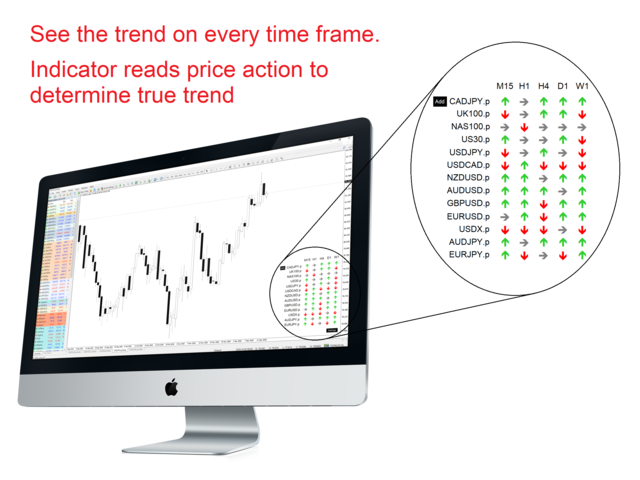
SEE THE TREND ON EVERY TIME FRAME. INTELLIGENT INDICATOR READS PRICE ACTION TO SPOT TRUE MARKET CYCLES AND TREND.
This advanced multi-currency and multi-time frame indicator, reads trend in real-time so you always know the trends of the markets you want to trade.
- See the trend on all time frames
- Makes market analysis mush easier and faster than ever before
- Choose the time frames you want to trade
- Build a watch-list of all correlated markets
Trading requires the knowledge and understanding of trends on multiple time frames. This takes time and is often overlooked as a result, but even when carried out it can also be misread, leading to trading errors. Using Trend-Viewer Pro means you will always know what the trends are on all the relevant time frames around your trade, meaning you can trade the right conditions and best markets, every time.
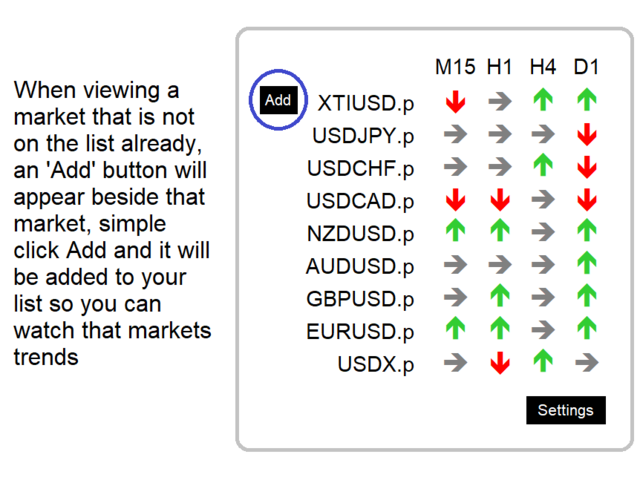
How to use the indicator
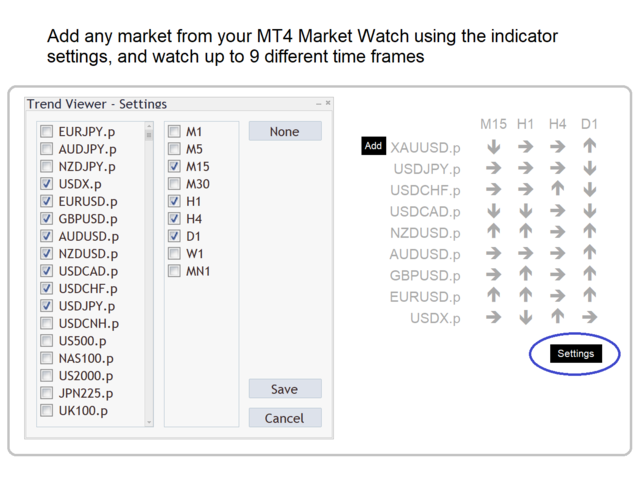
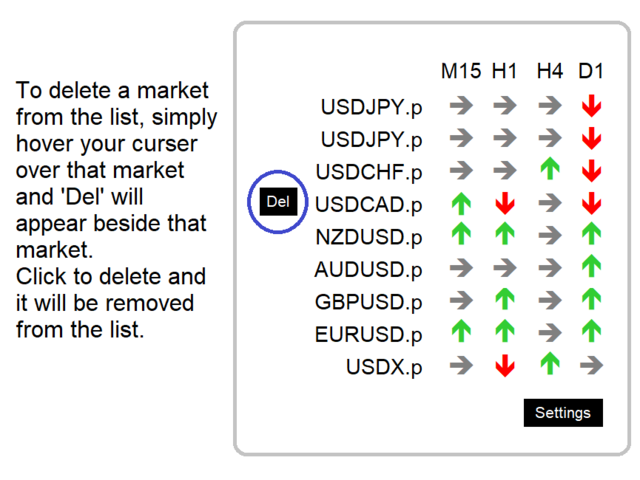
When you view a market on your chart, the indicator will automatically display the trends of all the time frames you want to see for that market. If that market has the trend agreement you want to trade, you can simply click 'Add' and that market will be added to the watch-list. When the trends of a market on the watch-list break down and no longer show agreement, hover your cursor over that market and 'Del' will appear beside it, so you can delete that market from your list. FOCUS ON THE BEST MARKETS FOR EVERY TRADE. All the markets displayed on your MT4 Market Watch can also be accessed from within the indicator settings and added to your display list. You can choose up to 9 time frames to follow, from the 1 minute to the 1 month time frames.
- We recommend you add up to 12 markets at any one time and only add the markets you want to trade.
- We recommend using 4 time frames. 2 time frames above your entry time frame to confirm the trend, 1 time frame below your entry time frame to help time your entry, and the time frame you want to trade.
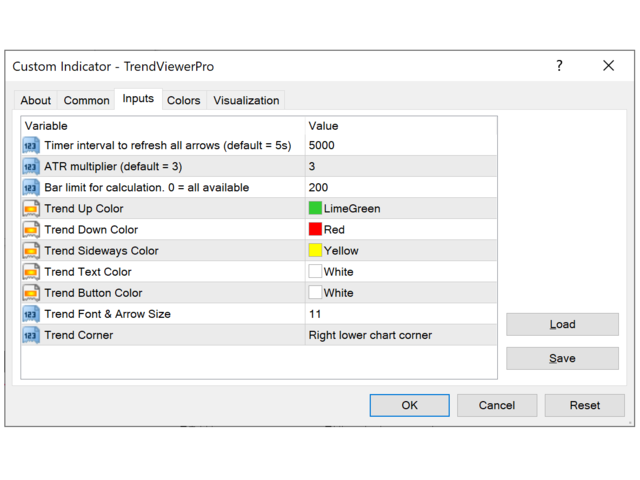
Indicator Parameters
- Timer Interval: This is the frequency with which the indicator reads and refreshes the trend arrows for each market and time frame. The value is shown in milliseconds, meaning the default setting of 5000ms is 5 seconds. If you have a slower machine, you may wish to increase this value to 7 or 10 seconds.
- ATR multiplier for over-sized detection: This has been added to eliminate over-sized bars from the chart (over-sized bars greater than chosen ATR will not be counted in cycles analysis), so that the indicator can still focus on the true cycles for trend identification. The default ATR is 3 but this can be amended to take into account larger or smaller candles if preferred. We recommend 3 as a starting point for all users.
- Bar limit: This is the number of candles the indicator reads to determine what the current trend is for a market or time frame. Can be reduced to speed up calculation time but we recommend not going lower than 100.
- Trend Up Color: The color displayed for up-trending arrows.
- Trend Down Color: The color displayed for down-trending arrows
- Trend Sideways Color: The color displayed for sideways/no trend arrows
- Trend Text Color: The color displayed for all market and time frame text
- Trend Font & Arrow Size: Size of text and arrows displayed in the indicator
- Trend Corner: This allows you to set where you would like to position the indicator inside your chart window. By default it will be displayed on the lower right hand corner but you can choose to move it to which ever corner best meets your needs.