Actual Depth of Market Chart

1

股票交易者的专业工具现已登陆 MetaTrader 5真实市场深度图表 指标在图表上以直方条的形式显示可视化的市场深度,并在实时模式下刷新。

根据用户需要提供更新!
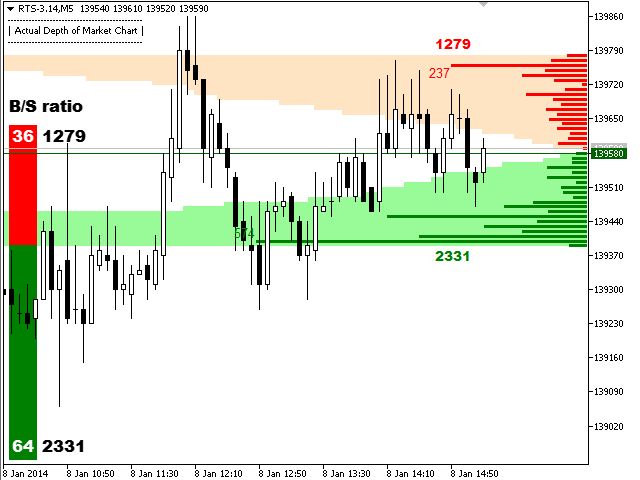
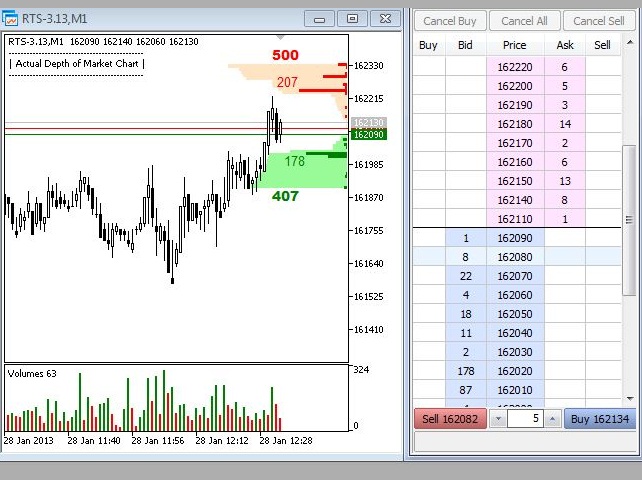
现在真实市场深度指标显示买卖交易请求的交易量比率 (B/S 率)。它显示每种请求类型占全部请求流的份额,以及绝对交易量。
怎么使用它?一般高频交易者的观点, 当某种请求占显著支配地位, 价格趋势将往请求方向倾斜, 即交易量大的。观察并使用我们的真实市场深度指标!

利用 真实市场深度图表 指标您可以正确评估市场请求并从图表上看到大的市场。这可以 100% 的精确剥头皮和设置持仓止损。

指标以两种相应颜色的水平直方条形式显示买和卖的请求 (买-卖)。价格图表上给定级别的显示条和它们的长度与请求的交易量相应。此外, 它指示买卖请求的最大交易量。

反危机出售。今日低价。赶紧!

此指标显示买卖请求总数量作为堆积面积图。这可以评估当经过下一价位时将会执行的请求总量。买卖请求总数量也显示在图表上。

省缺, 指标显示在图表背景上, 且它不会干扰任何其它指标。当使用指标交易时, 建议使用实际交易量。

本指标仅与提供市场深度的品种工作。首先, 很有兴趣通过 MetaTrader 5 访问FORTS 市场和其它股票市场交易。
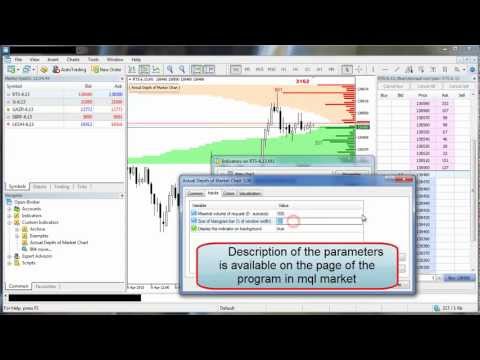
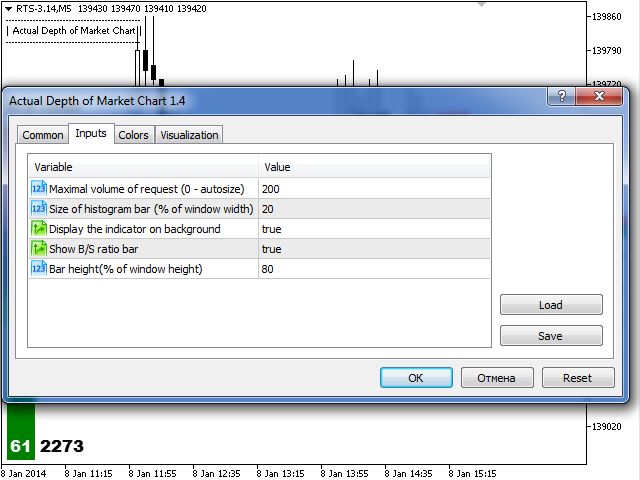
可以调整指标参数达到使用最方便:

  1. Maximal volume of request (0 - autosize) - 最大请求相应的线条大小。如果指定为 '0', 大小自动根据市场深度的最大请求交易量。此参数允许固定直方条比例 (省缺是 200)。
  2. Size of histogram bar - 直方条大小 (%)。交易量请求占据窗口宽度的百分比 (省缺是 20)。
  3. Display the indicator on background - 在图表背景上显示。允许在价格图表和其它指标的下面绘制指标 (省缺是 true)。
  4. Show B/S ratio bar - 在图表上显示买/卖比率。
  5. Bar height(% of window height) - 买卖条高度 (窗口高度百分比)。
推荐产品
该指标建立当前报价,可以与历史报价进行比较,并在此基础上进行价格走势预测。指示器有一个文本字段,用于快速导航到所需日期。 选项: 符号 - 选择指标将显示的符号; SymbolPeriod - 选择指标从中获取数据的时段; IndicatorColor - 指示器颜色; HorisontalShift - 由指标绘制的报价移动指定的柱数; Inverse - true 反转引号,false - 原始视图; ChartVerticalShiftStep - 图表垂直移动(键盘上的向上/向下箭头); 接下来是文本字段的设置,您可以在其中输入日期,您可以通过按“回车”立即跳转到该日期。 接下来是文本字段的设置,您可以在其中输入日期,您可以通过按“回车”立即跳转到该日期。
BoxChart MT5
Evgeny Shevtsov
5 (7)
The market is unfair if only because 10% of participants manage 90% of funds. An ordinary trader has slim changes to stand against these "vultures". This problem can be solved. You just need to be among these 10%, learn to predict their intentions and move with them. Volume is the only preemptive factor that faultlessly works on any timeframe and symbol. First, the volume appears and is accumulated, and only then the price moves. The price moves from one volume to another. Areas of volume accumu
VR Grid Mt5
Vladimir Pastushak
3.25 (8)
VR 网格指示器 设计 用于创建具有用户定义设置的图形网格。与 标准网格 不同,VR 网格用于构建 圆形关卡 。根据用户的选择,轮次级别之间的步长可以是任意的。此外,与其他指标和实用程序不同,即使时间段发生变化或终端重新启动,VR Grid 也能保持网格的位置 。 设置、设置文件、演示版本、说明、问题解决,可以从以下位置获取 [博客] 您可以在以下位置阅读或撰写评论 [关联] 版本为 [MetaTrader 4] 垂直级别 基于实际时间间隔并 忽略缺失 或不存在的周期。因此,级别之间的步长严格对应于用户选择的值。 使用 VR 网格指标时,交易者 可以更改任何级别的垂直线和水平线的样式 、颜色和粗细。这使您可以控制金融工具的 回合水平 。 整数位是 以两个或多个零结尾 的价格(例如:1.23500、5.65900、1923.200)。人们相信,这样的水平 经常充当 作为支撑或阻力的强点。 Horizontal line settings Horizontal line step Horizontal line color Horizontal line style Horizonta
FREE
Volume Candle Indicator
Pablo Filipe Soares De Almeida
MetaTrader 5 的彩色成交量直方图指标 此指标在单独的窗口中以直方图的形式显示市场成交量。每根柱子的颜色根据价格蜡烛的方向自动变化:当收盘价高于开盘价时显示绿色,表示多头力量;当收盘价低于开盘价时显示红色,表示空头主导。通过颜色区分,可以让交易者更清楚地看到价格运动与成交量之间的关系。 主要功能 成交量来源:可选择“Tick 成交量”或“真实成交量”。 可选在成交量直方图上添加一条移动平均线,用于平滑成交量变化趋势。 支持的移动平均类型包括:SMA(简单平均)、EMA(指数平均)、SMMA(平滑平均)、LWMA(线性加权平均)。 用户可以自由设定平均周期。 兼容所有交易品种和时间周期,在 MetaTrader 5 平台上运行稳定。 通过颜色与平均线的结合,帮助分析成交量背后的动能变化,从而辅助判断价格反转或趋势延续。
本指标可以让您享受两个最流行的产品来分析在感兴趣的价位的请求量和市场成交量: 真实市场深度图表 真实报价足迹成交量图表 本产品结合两个指标的效力,并以单个文件提供。 反危机出售。今日低价。赶紧! 真实的 COMBO 市场深度功能和报价成交量图表,完全等同于原始指标。您将享受这两款产品结合为单一超级指标的力量!下面是您将得到的功能: 真实市场深度图表 股民专用工具现已在 MetaTrader 5 上可用。 真实市场深度图表 指标在图表上以直方条的形式显示可视化的市场深度,并在实时模式下刷新。 利用 真实市场深度图表 指标您可以正确评估市场请求并从图表上看到大的市场。这可以 100% 的精确剥头皮和设置持仓止损。 指标以两种相应颜色的水平直方条形式显示买和卖的请求 (买-卖)。价格图表上给定级别的显示条和它们的长度与请求的交易量相应。此外, 它指示买卖请求的最大交易量。 此指标显示买卖请求总数量作为堆积面积图。这可以评估当经过下一价位时将会执行的请求总量。买卖请求总数量也显示在图表上。 省缺, 指标显示在图表背景上, 且它不会干扰任何其它指标。当使用指标交易时, 建议使用实际交易量。 本
Infinity Liquidity AI
Tumpa Sarkar
5 (2)
Infinity Liquidity AI - Premium MT5 Liquidity & Smart Money  If you are interested in using a professional liquidity-based MT5 indicator at the lowest possible price, this is the best time to purchase. Once the early slots are gone, the price will not stay the same. Free Bonus Indicator Included After purchase, message us from your profile and you will receive 1 premium indicator completely free with Infinity Liquidity AI. This bonus is included for buyers who contact us after purchase. You wil
Flow Architect
Alex Amuyunzu Raymond
Flow Architect Lite - Professional Market Structure Toolkit Free Version Features: Core Structure Analysis: Daily VWAP Engine   - Volume-weighted average price for institutional level tracking Standard Deviation Bands (SD1)   - Dynamic support and resistance zones Break of Structure Detection   - Visual markers for market structure shifts Fair Value Gap Identification   - Highlighted imbalance zones on your charts ATR Volatility Context   - Real-time Average True Range measurement Clean Informat
PivotWave
Jeffrey Quiatchon
Introducing PivotWave – your ultimate trading companion that redefines precision and market analysis. Designed with traders in mind, PivotWave is more than just an indicator; it’s a powerful tool that captures the pulse of the market, identifying key turning points and trends with pinpoint accuracy. PivotWave leverages advanced algorithms to provide clear visual signals for optimal entry and exit points, making it easier for traders to navigate volatile market conditions. Whether you are a begin
Donchian 时间同步分析器 为经典的 Donchian 通道分析带来了强大的 多时间 框架维度,使交易者能够同时监控五个不同图表周期的 趋势强度 和潜在 反转信号 。这款先进的指标能够计算您所选时间框架内的最高点和最低点,生成 清晰的视觉信号 ,帮助您识别跨多个时间范围的趋势方向的收敛。通过提供从分钟到小时的协同分析,它比单一时间框架工具提供更深入的市场洞察,帮助交易者 确认重大突破 ,并通过时间框架确认 避免错误信号 。 核心功能 这款先进的工具同时在多个时间范围内应用久经考验的 唐奇安通道策略 ,绘制同步信号,揭示短期价格走势是否与长期趋势一致。当价格突破您所选时间范围内的关键支撑位或阻力位时,系统会在单独的指标窗口中生成彩色箭头,从而以强大的视觉方式呈现市场动量。这种多时间范围方法通过汇聚不同时间视角的信号,更好地确认 趋势的起始点、延续点 和 潜在衰竭点 。 主要特点 多时间框架分析:     同时监控最多五个不同的时间范围(M1 至 MN),以获得全面的趋势视角 可定制的时间范围选择:     选择您喜欢的时间范围组合以匹配您的交易风格 视觉信号融合:     清晰
Haven Fibonacci Volume Profiles — 您的自动市场区间分析师 隆重推出 Haven Fibonacci Volume Profiles — 一款将市场分析提升到新水平的强大工具。该指标可自动识别基于重要转向点(枢轴点)构建的关键价格区间,并在每个区间上叠加详细的成交量分布图和斐波那契水平。这使交易者能够即时了解流动性集中在哪里,以及真正的支撑位和阻力位位于何处。 其他产品 -> 这里 . 无需再猜测哪个区间是有效的。该指标为您完成所有复杂的工作,同时显示历史和当前的价格区间,让您全面了解市场背景。 指标主要功能 自动识别区间: 指标可独立找到重要的高点和低点(枢轴点),并在此之间构建价格区间。 详细的成交量分布图: 为每个区间计算并显示成交量分布图,突出显示交易活动最多和最少的区域。 可自定义的斐波那契水平: 斐波那契水平会自动应用于每个区间。您可以启用、禁用并自定义每个水平的颜色(0.0、0.236、0.5、1.0 等)。 POC(控制点)可视化: 成交量分布图清晰显示成交量最大的水平,该水平通常作为强支撑或阻力。 历史分析: 指标不仅显示当前的价格区间
Delta volume ft Ema
Nhat Vy Vu
5 (4)
The Volume Delta Indicator is a technical analysis tool that combines volume analysis with price action to identify potential trading opportunities. This indicator analyzes the difference between buying and selling pressure through candle structure analysis. Key Features Volume Delta Calculation : Measures buy/sell volume difference using candle structure analysis EMA Smoothing : Applies exponential moving average to smooth volume data Breakout Detection : Identifies price breakouts with volume
FREE
Dynamic Trend Sniper MT5
Vincent Georges David Ferrier
Trade Like an Institution. Protect Like a Professional. Early Sniper Access: Limited Launch Offer! Get ready to elevate your trading precision. We are offering an exclusive, highly limited launch price for the first Dynamic Trend Sniper users. Our Unbeatable Launch Offer: First 10 Snipers Only: $69 (Full lifetime access + all v1.x updates) Standard Retail Price (After 10 Purchases): $129 Why Act Now? This is not just a discount; it's a strategic entry point. We are committed to rewarding
Smart SD Rectangle Tool
Liam Alex Thomas Webb
智能供需矩形工具指标是您在MT5上的终极伙伴,可即时可视化关键供需数据——就在您需要的区域,实时呈现。 该工具会自动在您的区域上覆盖丰富、可操作的数据,例如区域分类、点差距离、强度和区域大小——整洁地定位在每个区域内部。无需杂乱,无需猜测——只有清晰、动态的洞察力来支持您的决策。 为交易者打造,精准驱动。 无论您是进行日内超短线交易还是分析日线图上的关键区域,该指标都能将您手动绘制的区域瞬间转变为智能区域——立即提升图表的信息价值,而不干扰您的工作流程。 功能一览 自动水平检测 即时识别图表上的所有区域。 无需手动标记,即可将其分类为供需区域。 丰富、实时指标 显示: • 区域大小 • 当前价格的实时点差距离 • 区域强度评分 • 区域存在时间(区域年龄) 实时更新 数据随价格变动实时刷新。 智能刷新间隔确保即使在较低时间框架下,图表性能依然流畅。 可定制显示 调整标签字体、大小、颜色和定位。 智能自动标签:包含手动覆盖选项 跨市场适用 兼容MetaTrader 5上的所有外汇对、主要商品和加密货币工具。 交易者为何喜爱它 一站式区域洞察:一目了然查看供需标识、
This indicator provides an original mix of WPR, VSA, and volume delta. It shows ratio of buy/sell volumes scaled on 100% range based on total volume change for a selected period. The convetional VSA (Volume Spread Analysis) studies interconnections of price action and volume change in absolute values, whereas WPR (Williams Percent Range) offers a convenient approach of price moves normalization into the fixed percentage metric: 0 - 100%. Hence overbough and oversold states are easily spotted. N
Candle Time Phases Et Indicator - Split any candle into three time-based phases and control the sequential development of the candle in real time. Candle Time Phases is a precision timing indicator that divides the current candle into three time-based phases as a percentage of its total duration. The indicator determines and clearly separates the initial uncertainty phase, the main movement, and the completion phase, while also analyzing the structure and sequential development of the candle in
FREE
Blahtech Market Profile MT5
Blahtech Limited
5 (10)
Was: $249  Now: $99   Market Profile defines a number of day types that can help the trader to determine market behaviour. A key feature is the Value Area, representing the range of price action where 70% of trading took place. Understanding the Value Area can give traders valuable insight into market direction and establish the higher odds trade. It is an excellent addition to any system you may be using. Inspired by Jim Dalton’s book “Mind Over Markets”, this indicator is designed to suit the
Order Book, known also as Market Book, market depth, Level 2, - is a dynamically updated table with current volumes of orders to buy and to sell specific financial instument at price levels near Bid and Ask. MetaTrader 5 provides the means for receiving market book from your broker, but in real time only, without access to its history. The indicator OrderBook Cumulative Indicator accumulates market book data online and visualizes them on the chart. In addition, the indicator can show the market
CurvedSmoothChannel_Enhanced - 增强型价格通道指标 **CurvedSmoothChannel_Enhanced** 是一款功能强大且外观精美的价格通道指标,专为 MetaTrader 5 设计,可帮助您精准识别趋势、潜在反转和关键价位。此增强版结合了赫尔移动平均线 (HMA) 和 John Ehlers 的超平滑滤波器的强大功能,创建了一个动态自适应的通道,可根据多个时间范围内的市场状况进行调整。 #### 主要特点: - **平滑自适应中线**:该指标的核心是基于 HMA 的超平滑线,可最大限度地减少失真并紧密跟踪价格趋势。 - **多层通道结构**:显示三种类型的通道线: - **外线(紧密,黄色):**表示主通道的边界,可让您确定趋势方向和可能的突破区域。 - **内线(较不紧密,红色和绿色):**用于更清晰地显示外线并确认通道边界。 - **中线(中间,可选,红色和绿色):**位于中线和外线之间,按百分比距离调整,指示主要支撑/阻力区域。 - **可自定义宽度选项:** - 选择以价格百分比或固定点数表示的宽度,并根据每个时间间隔(从M1到D
Volume Profile For MT5
Abdelkhabir Yassine Alaoui
Volume Profile VPVR For MT5 Volume Profile VPVR is a powerful, high-performance MetaTrader 5 indicator designed to replicate the advanced  Volume Profile (Visible Range) directly on your chart. It provides deep insight into market structure by visualizing where trading activity is concentrated, helping traders identify key price levels with precision. This indicator dynamically analyzes volume distribution across price levels and renders a detailed histogram directly on the chart, allowing you
FILH Index Pro
Aiman Saeed Salem Dahbag
Indicator Description: The Advanced Force Index combines volume and price to determine the strength  of the trend. It has been developed to provide an accurate measurement of  seller and buyer power in the market, with multiple smoothing and display options. Key Features: Two display modes: Colored Histogram (bicolor) or Solid Line 4 Moving Average methods: SMA, EMA, SMMA, LWMA 7 Price types: Close, Open, High, Low, Median, Typical, Weighted Both volume types supported: Tick Volum
FREE
Total Volume Profile
Shahabeddin Baset
Includes almost all the concepts related to Volume Profile: POC , Value Area , Developing POC , Anchored VWAP , Volume Delta ; since the “Total” in its name. It is fast in its calculations and simple to work with. Features: 1.    Selectable calculation timeframe to find most traded levels. 2.    Capable of calculating Volume Profile based on tick data 3.    Adjustable histogram bars by their count. 4.    Adjustable histogram bars by their height (price range). 5.    Showing Value Area (VA
VolumeProfile MT5
Robert Hess
4.14 (7)
Description: The Volume Profile displays detailed informations of historical trading activities at certain price levels (Market Profile). Locate the areas with the best prices in the market and get an advantage over other market participants. Features: Customizable Market Profile Shows the "fair" Value Area with 70% of all Volume Shows critical low volume zones Shows VPOC, VAL and VAH Points integrated resource management to reduce the load while working with multiple charts Works on all timefr
Supply and Demand MTF MT5
Roman Zhitnik
4.75 (4)
This is a multi timeframe version of the  Supply and Demand indicator . It allows you to analyze a chart using the law of supply and demand on three different timeframes at a time. You will see zones of sales and purchases and determine the most profitable points to open positions. The indicator is based on the principle of market fractality. Supply and demand zones show places where a strong buyer or seller has made the price reverse and change its direction. The indicator has several types of
FREE
Signal Strike
Murtadha Majid Jeyad Al-Khuzaie
Signal Strike is a professional trading indicator designed for MetaTrader 5 that delivers clear, high‑confidence entry signals directly on your chart. Built with advanced logic that combines trend, momentum, volatility, and volume confirmation, this tool helps traders identify precise BUY and SELL opportunities with confidence. Unlike generic indicators, Signal Strike is engineered to filter out indecision candles and weak setups. When conditions align, the indicator plots entry, stop loss, an
The   Supply and Demand Zones indicator   is one of the best tools we have ever made. This great tool automatically draws supply and demand zones, the best places for opening and closing positions. It has many advanced features such as multi timeframe zones support, displaying the width of zones, alert notifications for retouched zones, and much more. Because of market fractality, this indicator can be used for any kind of trading. Whether you are a positional, swing, or intraday trader does no
Honest Breakeven
Konstantin Gruzdev
Indicator gives an honest picture of changes in breakeven levels for transactions throughout the account history, and not just for open positions (screenshot 1). Accurate calculation of levels, taking into account accrued commissions, fees and swaps, allows you to evaluate trading results both visually and in Expert Advisors (screenshot 2). For Expert Advisors, the indicator in its standard form provides not only the break-even level, but also the number of positions, volume, and all additional
Wapv Price and volume
Eduardo Da Costa Custodio Santos
Deriv Synthetic HTF Candle Projection GMT2 Higher Timeframe Candle Projection & Previous Levels Tool for Deriv Synthetic Indices (MT5) Overview Deriv Synthetic HTF Candle Projection GMT2 is a professional MetaTrader 5 indicator built specifically for Deriv Synthetic indices . It projects the current forming Higher Timeframe (HTF) candle onto the chart and automatically draws key reference levels from previous candles. This indicator is designed to help traders maintain higher timeframe context
FREE
TRI Visualizer
Yoshimi Mon 三 Ura
TRI Visualizer MT5 – Thermodynamic Market Analysis Overview The TRI (Thermal Range Indicator) Visualizer Enhanced is a rare market analysis indicator that goes beyond conventional technical analysis, applying principles of thermodynamics from physics. It interprets market price fluctuations as “thermodynamic energy,” enabling the highly accurate detection of subtle market changes that are often overlooked. Innovative Mechanisms 1. Dual Calculation Engines Classic TRI Mode Formula: |Close
Volume Profile Canvas
Mauro Italo Gaspari
Volume Profile Canvas - Professional Volume Profile Indicator for MetaTrader 5 DESCRIPTION Volume Profile Canvas is a professional volume profile indicator for MetaTrader 5 that renders directly on the chart using a high-performance Canvas engine. It calculates and displays the volume distribution across price levels, identifying the Point of Control (POC), Value Area High (VAH) and Value Area Low (VAL) in real time. This is a pure analysis tool. It does not trade. It gives you an instant vi
该产品的买家也购买
Neuro Poseidon MT5
Daria Rezueva
4.97 (33)
Neuro Poseidon is a new indicator by Daria Rezueva. It combines precise trading signals with adaptive TP/SL levels - creating best possible trades as a result! Message me and get  Neuro Poseidon Assistant  as a gift to automize your trading process! What makes it stand out? 1. Proven profitability on all assets and timeframes 2. Only confirmed BUY and SELL signals present on the chart 3. Adaptive TP & SL levels generated by the software for each trade 4. Easy to understand - suitable for al
SuperScalp Pro
Van Minh Nguyen
4.65 (26)
SuperScalp Pro – 高级多重过滤剥头皮指标系统 SuperScalp Pro 是一款高级剥头皮交易指标,将经典 Supertrend 与多种智能确认过滤器结合,帮助识别交易机会。它可高效运行于 M1 至 H4 多个时间周期,并针对 XAUUSD、BTCUSD 及主要外汇货币对进行了优化。 该指标提供清晰的 Buy 和 Sell 信号,并基于 ATR 自动计算入场价、止损和止盈水平,帮助交易者更有效地管理风险。Fibonacci Take Profit 功能可在关键价格水平提前平仓,并在到达这些水平时发送通知,从而提升交易管理效率与稳定性。 默认配置已启用 Fibonacci Take Profit,专注于更稳定、更持续的交易体验。您只需将指标加载到图表即可立即开始使用,无需额外设置。对于高级用户,所有参数均可完全自定义,以适应不同交易策略和偏好。 完整使用文档可在产品博客查看: [User Guide] 支持通过 SuperScalp Pro Auto Trader EA 进行自动交易: [Auto Trader] SuperScalp Pro 集成了 EMA、RSI
SMC Intraday Formula
Kareem Abbas
5 (15)
让我们先坦诚一点。 没有任何一个指标可以单独让你实现盈利。如果有人告诉你可以,那他是在向你兜售一个梦想。任何显示完美买卖箭头的指标都可以被做得看起来毫无瑕疵——只需要放大历史中的某一段并截取成功交易的截图。我们不会这样做。 SMC Intraday Formula 是一个工具。 它为你读取市场结构,标记出概率最高的价格区域,并用简单直白的语言准确告诉你当前智能资金的行为轨迹。你仍然需要做决定。你仍然需要执行交易。但现在,你是带着精确性执行,而不是靠希望。 我们已经在黄金(XAUUSD)以及主要外汇货币对的日内剥头皮交易中使用该指标将近三年。这是我们在 M1、M5、M15 和 M30 上的日常主力工具。它之所以有效,是因为它不试图预测未来——它展示的是当前正在形成的高概率交易机会,并解释 为什么 。 它与其他所有指标有什么不同? 大多数交易指标只做一件事。移动平均线交叉。振荡指标触及某个水平。出现一个箭头。你进场交易。你亏损。你责怪指标。重复。 SMC Intraday Formula 将多个机构级概念整合为一个统一的市场解读: - 斐波那契共振引擎 不只是普通的斐波那契水平——该指标
Entry In The Zone and SMC Multi Timeframe is a real-time 2-in-1 market analysis tool that combines market structure analysis and a No Repaint BUY / SELL signal system into a single indicator, built on Smart Money Concepts (SMC) — a widely adopted framework used by professional traders to understand market structure. This indicator helps you see the market more clearly, make decisions based on structure rather than guesswork, and focus on high-probability zones where price is more likely to react
Divergence Bomber
Ihor Otkydach
4.9 (90)
购买该指标的每位用户将额外免费获得以下内容: 原创工具“Bomber Utility”,该工具会自动跟踪每一笔交易,设置止损和止盈点,并根据策略规则自动平仓; 适用于不同交易品种的指标设置文件(Set 文件); 三种不同风险模式下的 Bomber Utility 设置文件:“最低风险”、“平衡风险” 和 “观望策略”; 一套详细的 视频操作手册,帮助您快速完成安装、配置并开始使用本交易系统。 注意: 要获取以上所有赠品,请通过 MQL5 的私人消息系统联系卖家。 我为您介绍原创的自定义指标 “Divergence Bomber”(背离轰炸机),它是一套基于 MACD 背离交易策略 的“全功能”交易系统。 该技术指标的主要任务是识别 价格与 MACD 指标之间的背离,并发出交易信号(包括推送通知),指示未来价格可能的运动方向。平均而言,这些信号的准确率超过 98%。有关该指标如何工作的详细说明,请观看本页面上的视频演示。 该系统使用 止损订单 和 动态回撤平仓机制 来管理交易。 Divergence Bomber 指标的主要特点: 支持交易的品种: AUDCAD、AUDCHF、AUDSG
Quantum TrendPulse
Bogdan Ion Puscasu
5 (25)
介绍 Quantum TrendPulse   ,这是一款终极交易工具,它将 SuperTrend   、   RSI 和 Stochastic 的强大功能整合到一个综合指标中,以最大限度地发挥您的交易潜力。该指标专为追求精准和效率的交易者而设计,可帮助您自信地识别市场趋势、动量变化以及最佳进入和退出点。 主要特点: 超级趋势整合: 轻松跟随当前的市场趋势并乘上盈利浪潮。 RSI 精度: 检测超买和超卖水平,非常适合把握市场逆转时机,可用作 SuperTrend 的过滤器 随机精度: 利用随机振荡在波动的市场中寻找隐藏的机会, 用作超级趋势的过滤器 多时间范围分析: 从 M5 到 H1 或 H4,在不同时间范围内关注市场动态。 可定制的警报: 当您的自定义交易条件得到满足时收到通知,这样您就不会错过任何交易。 无论您是新手还是经验丰富的交易员,   Quantum TrendPulse 都能为您提供所需的优势,帮助您增强策略并自信地进行交易。借助这一强大的指标,将洞察力转化为利润 — 掌控您的交易! ***购买 Quantum TrendPulse,即可免费获得 Quantum Tr
本产品已针对 2026 年市场进行更新,并针对最新 MT5 版本进行了优化。 价格更新通知: Smart Trend Trading System 目前价格为 $99 。 接下来的 30 次购买 后,价格将上涨至 $199 。 特别优惠: 购买 Smart Trend Trading System 后,请发送私信给我,即可免费领取 Smart Universal EA ,并将您的 Smart Trend 信号转换为自动交易。 Smart Trend Trading System 是一套完整的交易系统,具备不重绘、不回绘、不延迟的特点,专为希望获得更清晰信号、更准确趋势方向以及更有组织交易方式的交易者打造。 Online course , manual and download presets . 它将 10 多种交易工具 整合到一个系统中,包括趋势检测、反转区域、Smart Cloud、移动止损逻辑、支撑与阻力、K线着色、提醒以及多周期分析。 该系统旨在帮助您应对不同的市场环境: 趋势市场: 识别主要趋势,发现回调,跟随动能,并通过止损指导和移动止损选项寻找更清晰的入场机会。 震荡
SignalTech MT5
Yue Wang
5 (26)
SignalTech is an unique fully rule based trading system delivers an Institutional approach for both Independent Traders and Prop Firm Challengers. Never Repaint. Push Notification available. No over-optimization. All the winning trades with chart setups are published on the comments page. 2026-05 4107 Pips (Until 05-29 NY Closed) 2026-04 2243 Pips 2026-03 2165 Pips 2026-02 2937 Pips 2026-01 2624 Pips 2025-12 1174 Pips It can generate signals with Buy/Sell Arrows, Push Notification (To Mobile) an
Power Candles MT5
Daniel Stein
5 (8)
Power Candles V3 - 自我优化的强度指标 Power Candles V3 把货币与品种的强度直接转化为图表上可执行的交易方案。指标不再仅根据强度给K线着色,而是在后台持续运行实时自动优化,为您正面对的品种给出最佳 Stop Loss、Take Profit 与信号阈值。一键采用,Entry、Stop Loss、Take Profit 线就以精确价格绘制在图表上,提醒消息中直接包含方向。 本工具是 Stein Investments 生态系统的一部分 - 18+ 款工具,加上 Max,您的一对一 AI 交易导师。  随时在线,深入了解每一款指标,在您需要梳理思路的那一刻就在那里。  立即认识他: https://stein.investments 每根收盘K线运行 3,000+ 次交易模拟。9 种强度状态。2 种策略并行测试。一键采用最优配置。 为什么需要这个 大多数强度指标只给您一个数值,然后留下三个问题:相信哪个阈值、用哪个 Stop Loss、走哪个交易方向。Power Candles V3 在每根收盘K线上自动回答这些问题。结果就是一个完整的交易方案 -
PrimeScalping
Temirlan Kdyrkhan
PrimeScalping is a powerful trading companion designed to generate high-probability entry signals with dynamic TP/SL/DP levels based on volatility. Built-in performance tracking shows win/loss stats, PP1/PP2 hits, and success rates — all updated live. Key Features: Buy/Sell signals with adaptive volatility bands Real-time TP/SL/DP levels based on ATR Built-in MA Filter with optional ATR/StdDev volatility Performance stats panel (Success, Profit/Loss, PP1/PP2) Alerts via popup, sound, push, or e
M1 Quantum MT5
Hamed Dehgani
5 (1)
M1 Quantum 是一款专业的 M1 交易系统,提供快速且精准的交易信号,并内置止损(Stop Loss)、止盈(Take Profit)以及智能资金管理功能。 M1 Quantum 包含专业的资金管理系统,通过专注于 连续盈利交易 ,帮助交易者更快地增长账户资金。 M1 Quantum 指标 的主要特点 专为 M1 时间周期 和所有 主要货币对 设计 所有交易均配备止损和止盈 内置 资金管理功能 ,并指导交易者轻松执行交易计划 高胜率,高比例的 连续盈利交易 无重绘,无延迟 适合各种类型的交易者,简单易懂 要使用 M1 Quantum ,您需要 M1 Quantum Assistant 。这款强大的工具对所有 M1 Quantum 用户 免费提供 。 下载 M1 Quantum Assistant 加入我的 MQL5 频道 ,获取最新更新和新产品发布信息。 价格将在下周上涨至149美元。
Trend Catcher ind mt5
Ramil Minniakhmetov
5 (5)
趨勢捕捉指標 趨勢捕捉指標結合了作者獨有的客製化自適應趨勢分析指標,用於分析市場價格趨勢。它透過過濾掉短期噪音,並專注於潛在的動能強度、波動性擴張和價格結構行為,來識別真實的市場方向。此外,它還結合了平滑和趨勢過濾等客製化指標,例如移動平均線、相對強弱指標 (RSI) 和波動率過濾器。 您可以在這裡查看實際運行情況以及我的其他產品: https://www.mql5.com/en/users/mechanic/seller 請注意,我不會在 Telegram 上出售 EA 或任何設置,那是騙局。所有設定都可以在我的部落格上免費取得。 重要提示!購買後請立即聯繫我,以獲取使用說明和額外獎勵! 請注意,我不會在 Telegram 上出售 EA 或任何設置,那是騙局。所有設定都可以在我的部落格上免費取得。
FX Trend MT5 NG
Daniel Stein
5 (6)
FX Trend NG:新一代多市场趋势智能分析工具 概述 FX Trend NG 是一款专业的多时间周期趋势分析与市场监控工具,帮助您在几秒钟内全面了解市场结构。 无需在多个图表之间来回切换,您可以立即看到哪些品种处于趋势中、哪里动能正在减弱,以及哪些时间周期之间存在强烈共振。 限时发布优惠 – 仅需 $30(6个月) 或 $80 终身授权 即可拥有 FX Trend NG 。 已经是 Stein Investments 客户? -> 发送消息 以获取专属客户群访问权限。 需要帮助或安装指导? -> 请访问 Stein Investments 官方页面 。 1. FX Trend NG 的核心优势 三状态趋势逻辑 —— 不只是 Buy 或 Sell • 大多数指标仅显示两种状态:Buy 或 Sell。 • FX Trend NG 增加第三种状态: Fade 。 • Fade 表示趋势强度正在减弱,在完全反转之前提前发出信号。 这种结构化逻辑让您看到趋势变化过程,而不仅仅是简单方向信号。 多时间周期分析(M1 至 MN1) • 从短线交易到中长线交易全面覆盖。 • 快速识别趋势
GoldenX Entry MT5
Kareem Abbas
5 (10)
GoldenX Entry 是一款用于 MT5 的指标,包含自适应 Smart Entry Trend 算法、信号评分系统、市场状态识别器以及波动率过滤器。每个信号都包含计算得出的入场位、三个止盈位(TP1、TP2、TP3)以及止损位。它基于多个分析层构建,旨在适应不同市场条件,将多层分析系统与内置优化器及统计跟踪系统相结合。该指标基于风险收益比(RR)指标和历史交易行为提供量化分析。 开始使用非常简单——在所选时间周期上运行优化器,然后在图表上开始使用该指标。 核心功能 GoldenX Entry 将信号引擎与内置交易管理及历史统计跟踪整合在同一图表中: - 内置优化器: 优化器可在图表上单击运行。它通过两阶段搜索流程测试200种参数组合——先进行探索,再进行优化——并在完成后自动应用选定配置。结果会按时间周期缓存,因此当返回已优化的周期时,会立即恢复相同设置。 - 黄金品种自动周期识别: 将指标加载到任何 XAUUSD 图表(M1 到月线)。系统会自动识别当前周期并加载对应预设。共包含9个时间周期配置文件,专为黄金在标准周期上优化设计。切换周期时,参数会自动调整。 - 资金参考面
Gann Made Easy MT5
Oleg Rodin
5 (6)
Gann Made Easy   是一个专业且易于使用的外汇交易系统,它基于使用先生理论的最佳交易原则。 W.D.江恩。该指标提供准确的买入和卖出信号,包括止损和获利水平。您甚至可以使用推送通知在旅途中进行交易。 购买后请联系我,即可免费获得交易指导和超棒的额外指标! 您可能已经多次听说过江恩交易方法。通常 Gann 的理论不仅对于新手交易者而且对于那些已经有一定交易经验的人来说都是非常复杂的东西。这是因为江恩的交易方法在理论上并不那么容易应用。我花了几年时间来完善这些知识,并将最好的原则应用到我的外汇指标中。 该指标非常易于应用。您所需要的只是将其附加到您的图表并遵循简单的交易建议。该指标不断进行市场分析工作并寻找交易机会。当它检测到一个好的入口点时,它会为您提供一个箭头信号。该指标还显示止损和获利水平。 换句话说,当您像先生一样进行交易时,该指标会为您提供最佳江恩建议。江恩亲自告诉你此时此刻该做什么。但最好的部分是您不需要了解任何有关江恩交易原则的知识,因为该指标会为您完成整个市场分析工作。
Meridian Pro
Ottaviano De Cicco
5 (2)
Meridian Pro 2.00:MT5 专业多周期趋势矩阵 Meridian Pro 2.00 是面向 MetaTrader 5 的专业自适应趋势矩阵。它结合了原始 Meridian 趋势引擎、清晰的图表 ribbon、收盘柱确认箭头、8 周期 dashboard、Fuel 动量、加权共识、合成 HTF 处理,以及直接显示在当前图表上的高周期环境线。 目标很简单:在一个有纪律的 workflow 中读取当前趋势、多周期结构、强度、动量和 EA-ready 状态,而不是在多个图表上堆叠互不关联的指标。 Meridian Pro 的不同之处 一个自适应引擎 - 同一套波动率感知 Meridian 逻辑应用于 M1 到 W1。 合成 HTF 架构 - 高周期行由低周期数据推导,减少传统零售 MTF 中常见的 repaint、同步延迟和 broker-dependent HTF 质量问题。 完整矩阵输出 - Bias、Strength、Fuel 和加权 Consensus 一起显示,而不是拆成独立工具。 图表执行层 - ribbon 和箭头专注于当前周期,选配 HTF 线在同一图表上增加高
UZFX {SSS} 短线智能信号 MT5 是一款无重绘的高性能交易指标,专为在快速波动的市场中需要精准、实时信号的短线交易者、日内交易者和波段交易者设计。该指标由 (UZFX-LABS) 开发,融合了价格行为分析、趋势确认和智能过滤技术,可在所有货币对和时间周期内生成高概率的买入和卖出信号。 我推荐*的最佳时间周期:15分钟及以上。 {1小时}是我的首选。效果令人惊叹……! 注意:与{ LTL 164343 }指标结合使用,可提高获胜信号率。 使用 LTL 信号判断趋势,利用 SSS 信号确定入场时机。 这种方法将最大化您的胜率,并有效规避虚假信号。 核心功能 智能信号检测——精准识别强劲的趋势反转与延续形态。 多周期短线交易——在所有时间周期内运行流畅。 可自定义提醒——针对每个信号接收弹出窗口、电子邮件及手机通知(可配置)。 清晰可视箭头——图表上醒目的蓝色(买入)和红色(卖出)箭头。 自适应信号强度——可调节信号强度,适用于短期、中期或长期交易。 用户友好界面——简洁的图表显示,无重绘或信号延迟。 工作原理 UZFX SSS指标通过扫描价格走势来检测: 看涨反转——价格
SmartScalping
Temirlan Kdyrkhan
SmartScalping is a powerful trading companion designed to generate high-probability entry signals with dynamic TP/SL/DP levels based on volatility. Built-in performance tracking shows win/loss stats, PP1/PP2 hits, and success rates — all updated live. Key Features: Buy/Sell signals with adaptive volatility bands Real-time TP/SL/DP levels based on ATR Built-in MA Filter with optional ATR/StdDev volatility Performance stats panel (Success, Profit/Loss, PP1/PP2) Alerts via popup, sound, push, or e
ARIPoint
Temirlan Kdyrkhan
1 (1)
ARIPoint is a powerful trading companion designed to generate high-probability entry signals with dynamic TP/SL/DP levels based on volatility. Built-in performance tracking shows win/loss stats, PP1/PP2 hits, and success rates all updated live. Key Features: Buy/Sell signals with adaptive volatility bands Real-time TP/SL/DP levels based on ATR Built-in MA Filter with optional ATR/StdDev volatility Performance stats panel (Success, Profit/Loss, PP1/PP2) Alerts via popup, sound, push, or email Cu
TrendProMaster
Temirlan Kdyrkhan
MasterTrend Indicator for MT5 A powerful trend-following and signal-evaluation tool MasterTrend   is a custom MT5 indicator that combines Moving Averages and ATR-based risk/reward logic to generate clear buy/sell signals. It visualizes dynamic SL/TP levels, evaluates past trade outcomes, and displays win/loss statistics in a clean on-chart panel. Key features include: Buy/Sell signals based on MA crossovers ATR-based SL/TP1/TP2/TP3 levels with visual lines and labels Signal outcome tracking wit
Reversion King Indicator
Eugen-alexandru Zibileanu
5 (4)
全新王者降临 - 指标 + 订单管理提示(TP1 + TP2 + TP3)+ 可选 Telegram 信号发送器 INCLUDED(免费) (完整交易与信号系统) 我们最强的黄金 EA: Gold Slayer 该指标包含先进的交易策略、可自定义订单管理系统,以及结合 Envelope 扩展的均值回归系统,并通过 RSI 等多重智能确认过滤器进行验证,以捕捉高概率反转入场机会,提供 BUY 与 SELL 信号。 你不仅能够学习如何交易,还能学会如何高效管理多个仓位,并利用之前盈利的持仓来覆盖亏损交易。 专为 M5 周期打造并优化,在 BTCUSD 和 XAUUSD 上表现尤为出色,因为这些市场的流动性能够让信号更加干净、可靠。 该指标会自动生成清晰的多头(Long)与空头(Short)信号,同时基于 ATR 自动计算入场位、止损位和止盈位,让风险管理从一开始就融入系统之中。 多 TP 系统设有三个渐进式目标位,你可以在 TP1 锁定部分利润、在 TP2 继续持仓,并在更大的行情中将仓位持有至 TP3,而这正是平均风险回报比真正开始大放异彩的地方。 默认参数开箱即用,已经针对稳定表现进行
Atomic Analyst MT5
Issam Kassas
4.26 (35)
本产品已针对 2026 年市场进行更新,并针对最新 MT5 版本进行了优化。 价格更新通知: Atomic Analyst 目前价格为 $99 。 接下来的 30 次购买 后,价格将上涨至 $199 。 特别优惠: 购买 Atomic Analyst 后,请发送私信给我,即可免费领取 Smart Universal EA ,并将您的 Atomic Analyst 信号转换为自动交易。 Atomic Analyst 是一款不重绘、不回绘、不延迟的 Price Action 交易指标,专为手动交易、清晰信号和 EA 自动化而设计。 User manual: settings, inputs and strategy. 它分析价格行为、强度、动能、多周期方向和高级过滤器,帮助交易者减少噪音,避免弱势交易机会,并做出更有结构的交易决策。 该指标将复杂的市场计算转换为简单的视觉信号、彩色K线、趋势读数、止损水平和多个止盈区域,使交易者能够快速理解并应用于真实市场环境。 主要交易用途: 剥头皮和日内交易: 专为快速决策、清晰箭头、提醒、K线颜色和结构化进出场区域而设计。 日内交易和波段交易:
Azimuth Pro
Ottaviano De Cicco
5 (7)
Azimuth Pro V2:MT5合成分形结构分析与确认入场 概述 Azimuth Pro 是 Merkava Labs 推出的多层级波段结构指标。四层嵌套波段层级、锚定波段的VWAP、ABC形态识别、三时间框架结构过滤以及收盘确认入场——一个图表,一个从微观波段到宏观周期的完整工作流程。 这不是盲目的信号产品。它是一个以结构为先的工作流程,专为重视位置、背景和时机的交易者打造。 V2上市优惠 — Azimuth Pro V2售价USD 399(接下来的100份)。最终价格:USD 499。 1. V2的变化 合成多时间框架引擎 高时间框架分析从零开始重建,采用与Meridian Pro相同的专有合成架构。更清晰的HTF背景、稳定的实时行为、无经典MTF同步问题。合成引擎还解锁了 固定比率时间框架级联 (x2、x3、x4、x6)——不再在经纪商的固定时间框架之间任意跳转,您可以按图表时间框架的固定倍数分析结构,在每个尺度上保持相同的分形关系。 确认入场箭头 作为稳定且可恢复的执行层而设计的收盘确认箭头。当ABC设置形成且自适应确认逻辑在收盘K线上验证方向时,箭头会写入下一根K线的
ScalpPoint
Temirlan Kdyrkhan
ScalpPoint is a powerful trading companion designed to generate high-probability entry signals with dynamic TP/SL/DP levels based on volatility. Built-in performance tracking shows win/loss stats, PP1/PP2 hits, and success rates — all updated live. Key Features: Buy/Sell signals with adaptive volatility bands Real-time TP/SL/DP levels based on ATR Built-in MA Filter with optional ATR/StdDev volatility Performance stats panel (Success, Profit/Loss, PP1/PP2) Alerts via popup, sound, push, or emai
Market Structure Order Block Dashboard MT5 是一款专为希望直接在图表上解读市场结构和主要价格反应区域的交易者设计的MT5指标。它结合了BOS、ChoCH、订单块(Order Blocks)、公允价值缺口(FVG)、流动性、Kill Zones、成交量分布图以及一个紧凑的面板,便于快速分析。 本指标面向使用市场结构、ICT和Smart Money概念作为决策框架的交易者。它可以帮助以更结构化的方式识别趋势延续、可能的反转、价格失衡、流动性目标和关注区域。 面向买家的资源 购买后可通过MQL5私信申请获取完整的PDF使用指南和参数配置建议。通过MQL5私信提供直接技术支持。 1.20版本带来两项重要新增: Pending BOS / Pending ChoCH 检测 和 可拖动面板 (按住面板标题栏即可将其拖动到图表任意位置,不影响图表本身)。当K线收于前一摆动点之外时,Pending Breaks 立即显示待确认的结构突破,无需等待经典的摆动确认。 重要 本产品仅为指标。它不会自动开仓、平仓或管理仓位。它不是EA(智能交易系统)。 主要功能 市场
FX Power MT5 NG
Daniel Stein
5 (32)
FX Power:分析货币强度,助您做出更明智的交易决策 概述 FX Power 是一款专业工具,帮助您全面了解主要货币和黄金在任何市场条件下的真实强度。通过识别强势货币用于买入,弱势货币用于卖出, FX Power 简化了交易决策,并帮助您发现高概率的交易机会。不论您是想跟随趋势还是通过极端的 Delta 值预测反转,这款工具都能完美适应您的交易风格。别再盲目交易——用 FX Power 让您的交易更加智慧。 1. 为什么 FX Power 对交易者极具价值 实时货币和黄金强度分析 • FX Power 实时计算并显示主要货币和黄金的相对强度,助您全面了解市场动态。 • 监控领先或落后资产,轻松识别值得交易的货币对。 全面的多时间框架视图 • 跟踪短期、中期和长期时间框架的货币和黄金强度,以便将您的交易策略与市场趋势保持一致。 • 无论是快进快出的短线交易还是更长期的投资策略, FX Power 都能为您提供所需的信息。 Delta 动态分析用于趋势和反转 • 极端 Delta 值常常预示反转机会,而平缓的 Delta 变化则确认趋势延续。 • 使用 Delta 分析,轻
Crystal Heikin Ashi Signals
Muhammad Jawad Shabir
5 (2)
Crystal Heikin Ashi Signals - Professional Trend & Signal Detection Indicator Advanced Heikin Ashi Visualization with Intelligent Signal System for Manual & Automated Trading Final Price: $149 ---------> Price goes up $10 after every 10 sales . Limited slots available — act fast . Overview Crystal Heikin Ashi Signals is a professional-grade MetaTrader 5 indicator that combines pure Heikin Ashi candle visualization with an advanced momentum-shift detection system. Designed for both manual traders
介绍     Quantum Breakout PRO   ,突破性的 MQL5 指标,正在改变您交易突破区域的方式!由拥有超过13年交易经验的资深交易员团队开发,     量子突破 PRO     旨在通过其创新和动态的突破区域策略将您的交易之旅推向新的高度。 量子突破指标将为您提供带有 5 个利润目标区域的突破区域的信号箭头,以及基于突破框的止损建议。 它既适合新手交易者,也适合专业交易者。 量子 EA 通道:       点击这里 重要的!购买后请私信我领取安装手册。 建议: 时间范围:M15 货币对:GBPJPY、EURJPY、USDJPY、NZDUSD、XAUUSD 账户类型:ECN、Raw 或 Razor,点差极低 经纪商时间:GMT +3 经纪商:IC Markets、Pepperstone with Raw 和 Razor 的点差最低 规格: 不重漆! 最多 5 个建议利润目标区域 建议止损水平 可定制的盒子。您可以设置自己的 Box Time Start 和 Box Time End。 接触 如果您有任何疑问或需要帮助,请通过私人消息与我联系。
Quant Direction MT5
Georgios Kalomoiropoulos
Quant Direction 是一款三维市场分析工具。它通过同时计算多个维度上的精确百分比偏差,提供完全客观的、基于算法的市场分析视角。该算法采用先进的人工智能建模工具开发,并经过全面测试,旨在以独特的精准度解读市场。它可以分析您平台上的任何货币对或金融工具。 无论您是短线 交易者、日内 交易者还是波段交易者,Quant Direction 都是您的理想之选。 交易者的真正优势 Quant Direction 的真正优势在于彻底消除情绪、屏幕疲劳和过度思考。它无需手动点击十几个图表来寻找方向并反复质疑自己的偏好,引擎即可在几毫秒内即时处理 8 个时间周期(从 5 个月到月线)。它能准确告诉你任何时刻谁在掌控市场,确保你始终朝着概率最高的方向进行交易。 市场分析的三个维度 该算法将市场分为三个不同的交易维度,为您提供完整的宏观和微观视角: 超短线交易分析: 捕捉即时、快速的动量变化和较低时间框架的执行点。 日内分析: 识别真实的、潜在的每日方向性偏差。 波动分析: 专注于宏观趋势,确保您不会与大盘机构的走势背道而驰。 独家评分引擎 Quant Direction 的底层采用了一套
Meravith MT5
Ivan Stefanov
5 (1)
做市商工具。 Meravith 将: 分析所有时间周期并显示当前正在运行的趋势。 标注流动性区域(成交量均衡区),即多头与空头成交量相等的位置。 在您的图表上直接显示来自不同时间周期的所有流动性水平。 生成并展示基于文本的市场分析供您参考。 根据当前趋势计算目标位、支撑位和止损位。 计算交易的风险回报比。 根据您的账户余额计算仓位大小,并估算潜在利润。 在市场出现重大变化时,Meravith 还会发出警告。 指标的主要线条: 多头/空头成交量衰竭线 —— 作为目标位使用。 趋势线 —— 指示市场趋势方向。根据市场是多头还是空头而改变颜色,并作为趋势支撑。其颜色主要反映市场情绪。 成交量均衡线(Eq)—— Eq(Volume Equilibrium)是系统的核心。它表示买卖双方成交量的平衡点,即市场流动性所在位置。向上突破 Eq 表示多头倾向,向下突破 Eq 表示空头倾向。突破后,应等待回调——当价格回到相反趋势的偏离线或衰竭线附近时。 使用方法:只需将其添加到图表中。 Meravith 可以分析一切——趋势和回调。 趋势线与某条成交量衰竭线之间的距离越大,说明该方向的成交量越高。 趋势
作者的更多信息
This new unique indicator Actual tick footprint (volume chart) is developed for using on Futures markets, and it allows seeing the volume of real deals right when they are performed. The indicator Actual tick footprint (volume chart) represents a greatly enhanced tick chart that includes additional information about the volume of deal performed at a specific price. In addition, this unique indicator for MetaTrader 5 allows to clearly detecting a deal type – buy or sell. Alike the standard tick c
本指标可以让您享受两个最流行的产品来分析在感兴趣的价位的请求量和市场成交量: 真实市场深度图表 真实报价足迹成交量图表 本产品结合两个指标的效力,并以单个文件提供。 反危机出售。今日低价。赶紧! 真实的 COMBO 市场深度功能和报价成交量图表,完全等同于原始指标。您将享受这两款产品结合为单一超级指标的力量!下面是您将得到的功能: 真实市场深度图表 股民专用工具现已在 MetaTrader 5 上可用。 真实市场深度图表 指标在图表上以直方条的形式显示可视化的市场深度,并在实时模式下刷新。 利用 真实市场深度图表 指标您可以正确评估市场请求并从图表上看到大的市场。这可以 100% 的精确剥头皮和设置持仓止损。 指标以两种相应颜色的水平直方条形式显示买和卖的请求 (买-卖)。价格图表上给定级别的显示条和它们的长度与请求的交易量相应。此外, 它指示买卖请求的最大交易量。 此指标显示买卖请求总数量作为堆积面积图。这可以评估当经过下一价位时将会执行的请求总量。买卖请求总数量也显示在图表上。 省缺, 指标显示在图表背景上, 且它不会干扰任何其它指标。当使用指标交易时, 建议使用实际交易量。 本
筛选:
Evgenii Akselrod
1139
Evgenii Akselrod 2024.04.15 13:34 
 

абсолютно бесполезный индикатор, стандартный стакан показывает больше и точнее. Автор на вопросы не отвечает

daytrader80
19
daytrader80 2021.11.30 06:45 
 

用户没有留下任何评级信息

Sergey Andreev
7202
来自开发人员的回复 Sergey Andreev 2021.12.05 21:12
Hey! Has this problem been resolved? I wrote you a private message, but you didn’t reply. Can I help you with something? Please get in touch so I can help you.
Have a nice day!
Matheus Mirim
43
Matheus Mirim 2021.08.13 13:34 
 

用户没有留下任何评级信息

Daniel Cwik
346
Daniel Cwik 2021.04.12 16:49 
 

It doesn't place a histogram as stated in the picture. It placed one long bar for the buying side and one long bar for the selling side. @Sergey, how can this be fixed?

autovolk
847
autovolk 2021.01.21 10:05 
 

用户没有留下任何评级信息

Tiago Menezes
208
Tiago Menezes 2020.09.30 19:16 
 

Infelizmente não funciona de acordo como está publicado no vídeo..... Por isso estou solicitando junto ao MQL o estorno do dinheiro. Unfortunately it does not work according to how it is published in the video ..... So I am asking MQL for a refund of the money.

Anton Kolesnikov
738
Anton Kolesnikov 2020.06.03 21:05 
 

Не работает, не качайте. Разработчик игнорирует

Sergey Andreev
7202
来自开发人员的回复 Sergey Andreev 2021.03.02 13:40
Добрый день! Очень жаль видеть Ваше разочарование. Поверьте, я являюсь честным разрабочиком продуктов, таким, как многие программисты, выставляющие свои продукты здесь. Ошибки бывают в любых программах, это случается, как по вине программиста, так и по другим причинам.
К настоящему момент все проблемы устранены и Вы можете пользоваться продуктом.
К сожалению, Вы не ответили мне в личных сообщениях, поэтому не могу быть уверен что теперь у Вас тоже все в порядке и решил написать Вам ответ тут. В любом случае, fell free для связи со мной по любым возникающим вопросам Хорошего дня!
Саша Синков
1081
Саша Синков 2020.02.04 13:24 
 

用户没有留下任何评级信息

Pouya Ghiaci
592
Pouya Ghiaci 2014.08.18 09:38 
 

There is problem for showing the data on the chart!!!!!

How can I contact you to fix te problem !!!!

Hanchek
331
Hanchek 2013.12.23 20:30 
 

Хороший индикатор!Еще бы работал как на видео и было бы что то вроде таблицы для определения объема в процентном соотношении,а то данные быстро меняются сложновато прослеживать!В остальном все ОК!Спасибо

Valeri Chikalovets
486
Valeri Chikalovets 2013.12.04 09:00 
 

用户没有留下任何评级信息

回复评论