TricolorEMA
- 指标
- 版本: 1.0
- 激活: 15

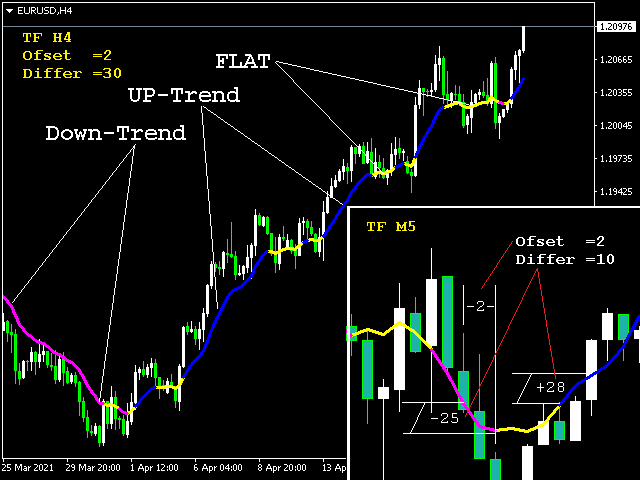
指标将偏移点 Point1 和 Bar1(最后一个关闭的柱)之间的 ClosePrice 差值与 Difer 常数进行比较。
如果该值为正并超过 Difer,则绘制蓝线,对应于上升趋势。
如果该值为负数并超过 Difer,则绘制洋红色线,对应于 DN 趋势。
没有趋势 (Flat) 用黄色表示。
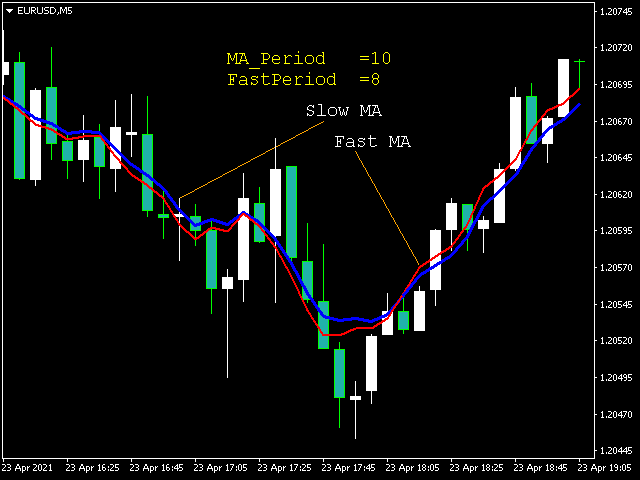
您也可以通过快速和慢速 MA 进行交易。此选项更适合剥头皮。
您还可以根据主 MA 的颜色(和快速 MA 的交点)生成信号,同时考虑新柱的开盘价相对于 MA 的位置。此选项更适合中长期交易。
该指标使用 EMA 计算公式,它对价格变化做出快速反应,但它也捕捉到更多的噪音。当心。当以小幅度横向移动时,不应始终信任 MA 信号。
我一直在用这个籼稻2
Tor 已经使用了 15 年以上,但它仍然没有失去它的相关性,它比其他人更经常使用。 Tricolor 适用于长期交易和剥头皮交易。它同样适用于手动交易和专家顾问。
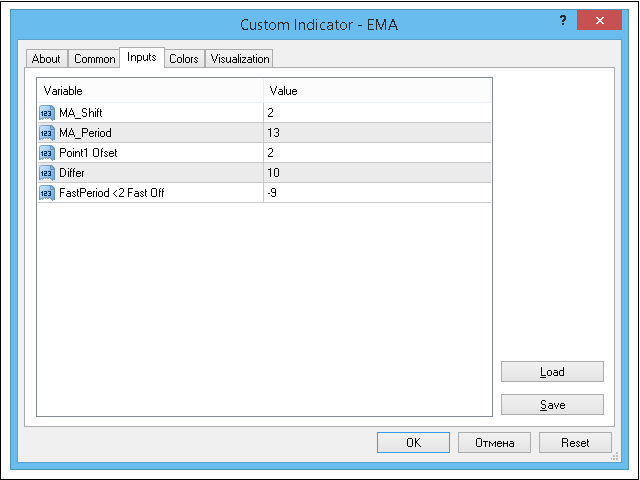
输入参数
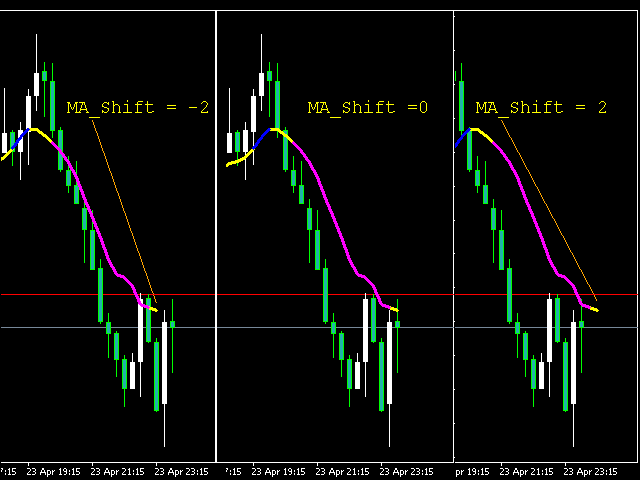
MA_Shift = 指标线移动周期
MA_Period = 主要 MA 平均周期
Point1 Offset= 周期偏移 Point1
不同 = 点数。与价格差异 Bar1 - Point1 进行比较
FastPeriod = 快速 MA 平均周期