TrendPadPRO MT4

👉 Why TrendPadPRO ?

Because it delivers not just signals, but the real context of trend trading – the difference between late reactions and informed decisions based on market structure and dynamics.


I. TrendPadPRO - Unveiling the Context of Informed Trend Trading

  The Context of Trend Trading is far more relevant and important than indicators, timeframes, personal perspectives or beliefs.

  TrendPadPRO's unique features, including trend inertia (age) analysis, trend direction identification, and precise S/R levels, bring the knowledge of the Context of Trend Trading needed to make decisions in real time.


II. Usability of TrendPadPRO

  TrendPadPRO is a trading tool designed to cater to traders of all experience levels.

  Its intuitive interface allows traders to find the various indicators, including trend inertia (age), trend  direction, and critical support / resistance (S/R) levels for different timeframes.

  By consolidating these real time data points, TrendPadPRO provides a comprehensive outlook on market trends and highlights potential entry and exit points.


III. Riding the Momentum: Inertia (Age) and Strong Trends

  One of the standout features of TrendPadPRO is its ability to identify and measure trend inertia (age).

  Inertia (Age) is the driving force behind strong trends (sustained price movements).

  When a trend reverses on a timeframe, the Inertia (Age) have a minimum value of 2 and increases with each closed candle while trend's S/R level is not broken on this timeframe.


IV. The Trend's Direction: The Key to Tracking a Trend

  TrendPadPRO leaves no room for guesswork when it comes to trend direction.

  Its precise algorithm quickly identifies whether the market trend is upward or downward, enabling traders to follow the trend's direction in real time.


V. Unlocking Opportunities: Trend S/R Levels

  At the heart of any trading strategy lies the ability to pinpoint significant support and resistance levels.

  TrendPadPRO furnishes traders with real-time S/R levels for various timeframes.

  These levels act as crucial indicators for entry and exit points, guiding traders towards dynamic risk/reward ratios.


VI. Balancing Risk and Reward: Stop Loss and Take Profit

  TrendPadPRO empowers traders to strike the delicate balance between potential gains and acceptable risk levels.

  With a clear focus on preserving capital, the appropriate Stop Loss levels must be beyond relevant S/R levels (no any trade if no any appropriate StopLoss).

  TrendPadPRO assists in setting reasonable Take Profit levels. Traders can aim for the higher Trend S/R levels or opt for a multiple of 13.7 pips (scalping territory), towards a dynamic risk/reward ratio.


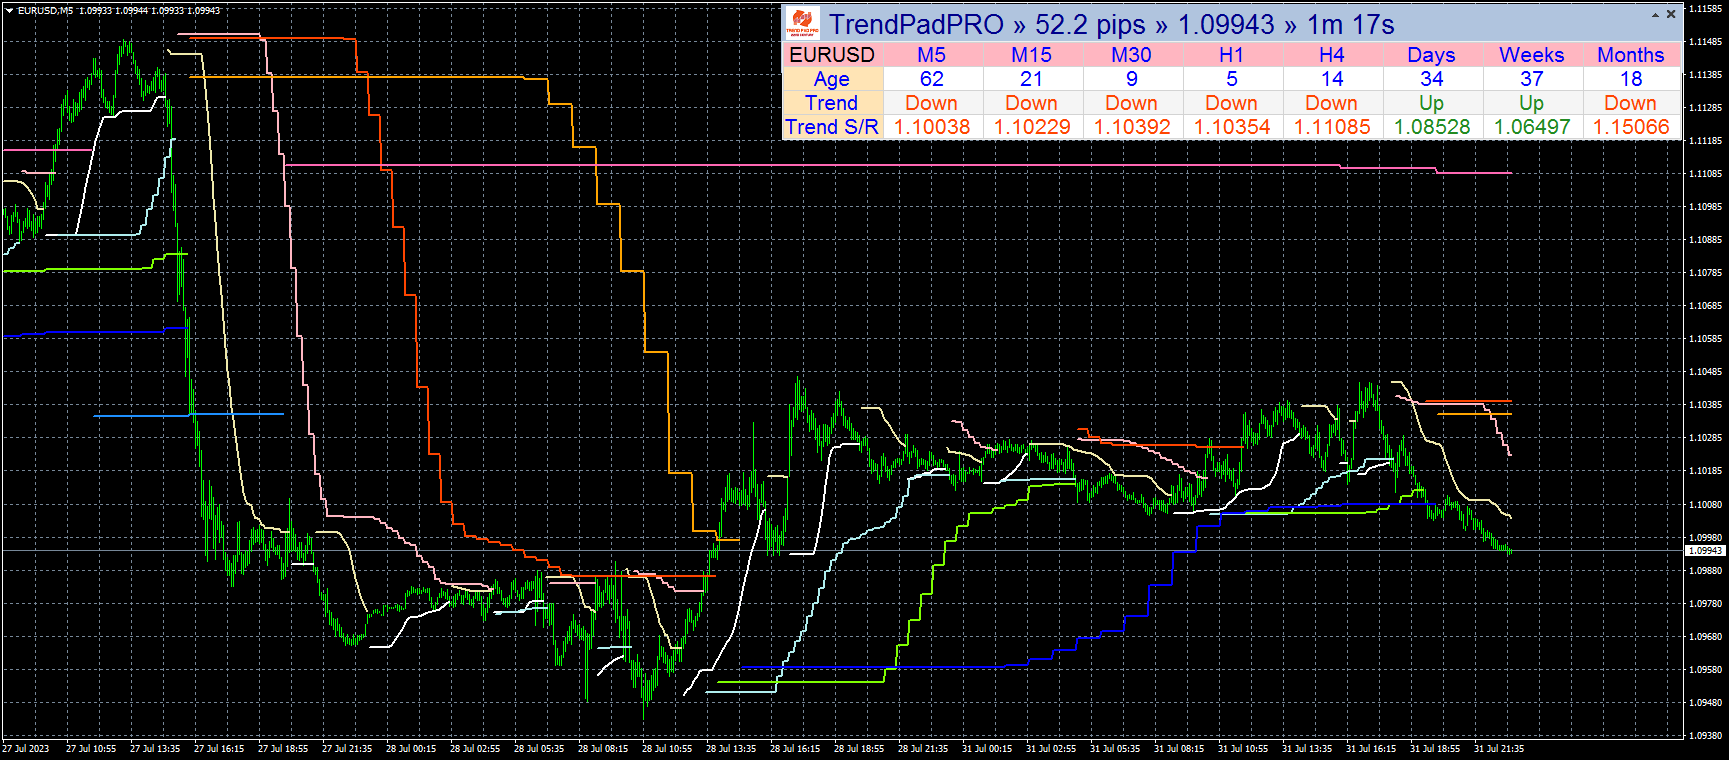
VII. Mapping Key Levels: Adaptive MA S/R in Action

TrendPadPRO shows adaptive and reliable MA-based support/resistance zones (Fast & Slow). 

These dynamic levels enhance the Context of Trend Trading by highlighting where price often reacts, providing traders with clearer entries, exits, and real-time confirmation of trend momentum.


VIII. Position Sizing: A Calculated Approach

  TrendPadPRO emphasizes prudent position sizing, enabling traders to limit their risk exposure to a maximum of 1-2% per trade.
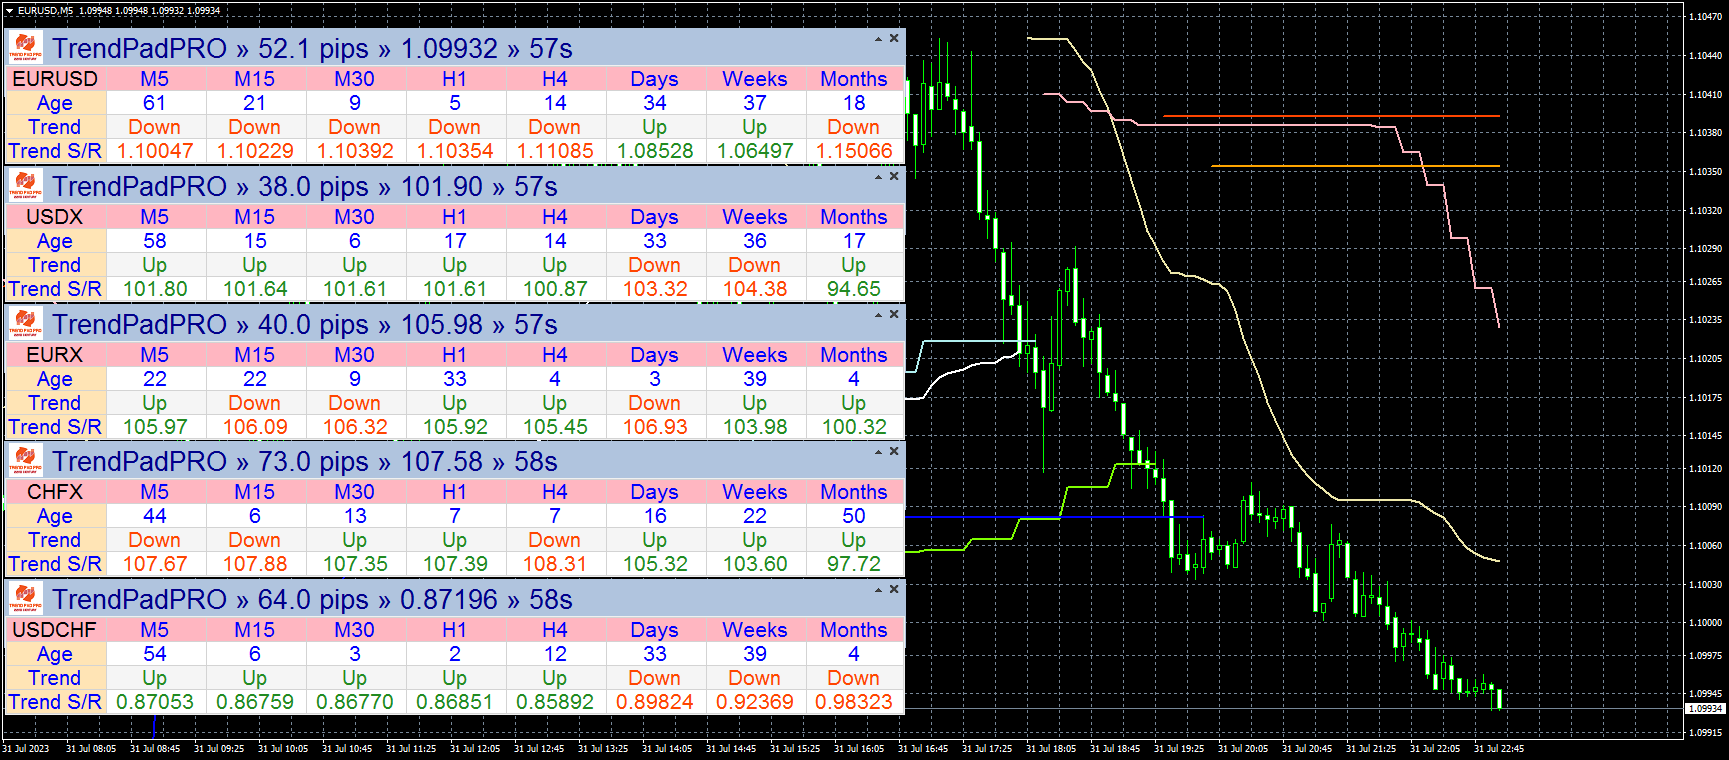
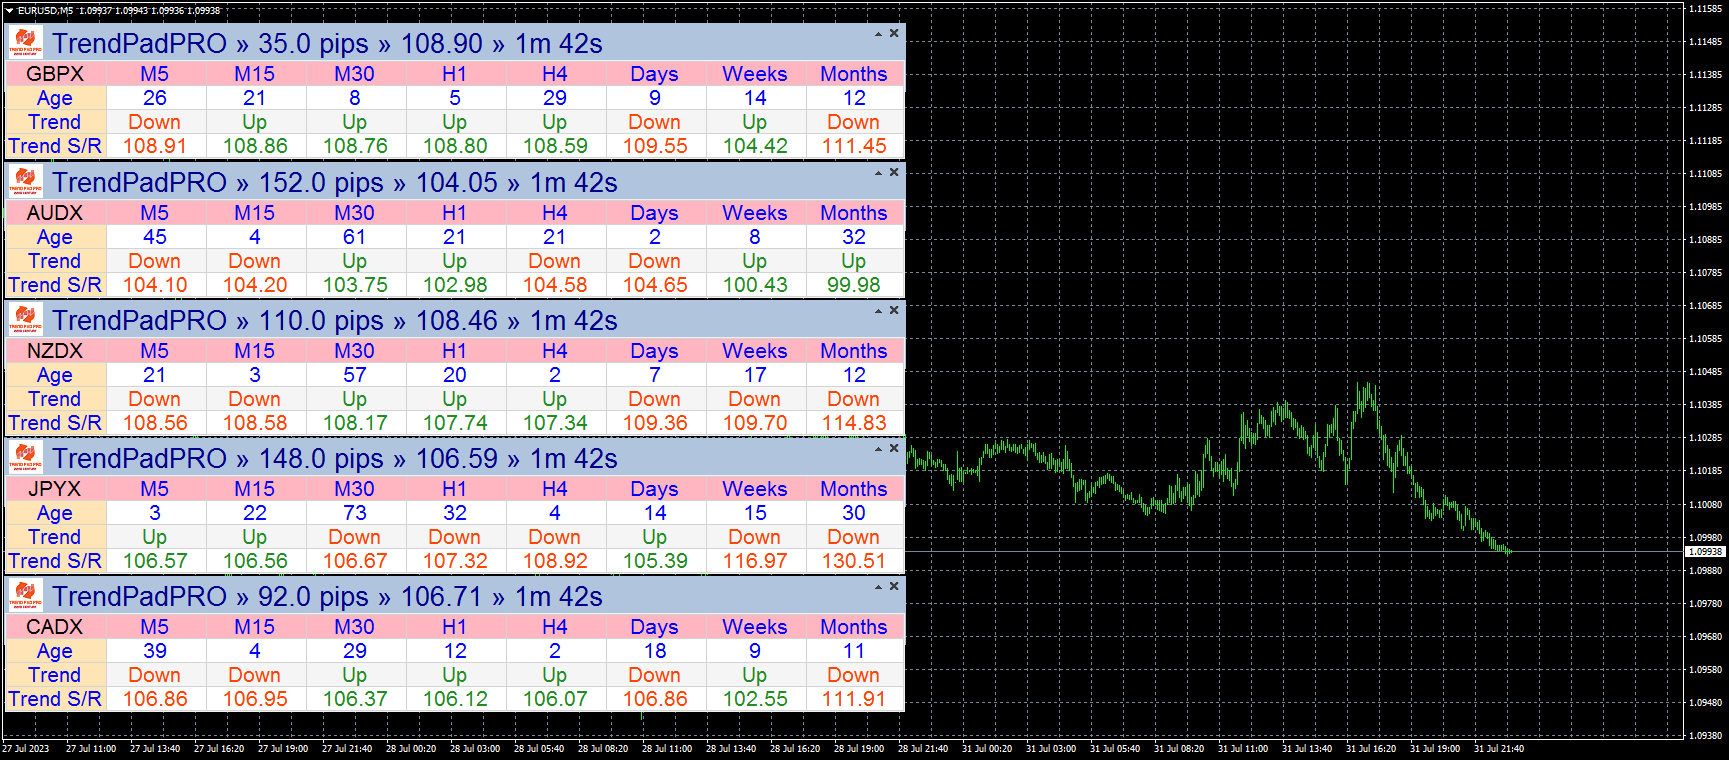

IX. GUI features 

 Titlebar   Daily movement » Current BID » TF candle time left
 Headers   Chart Symbol » Chart TimeFrames
 Age   Numbers of candles for current trend
 Trend   Up or Down
 Trend S/R   Trend Support/Resistance's current levels 


X. Settings 

 Currency Index   Any Major Currency Index or No Currency Index
 Scanner Symbol   Any Symbol or Empty for current chart Symbol
 Index Pair Prefix   Major Currency Pair Prefix or Empty if none
 Index Pair Suffix   Major Currency Pair Suffix or Empty if none
 History Bars   Maximum number of bars used for history
 Trend Pad section   GUI color picker
 Trend Lines section  Trend Lines color picker for current chart Symbol
 Major Currency Index section  Current Currency Index components
 Constant Factor  Constant Factor of Current Currency Index
 Weighting  Weighting of Current Currency Index components
 Alerts Parameters   Enable the alert options 


推荐产品
Alpha Trend sign Alpha Trend sign 是我么长期以来非常受欢迎的交易工具,它可以验证我们的交易系统,并且明确的提示交易信号,并且信号不会漂移。 主要功能: •  根据市场显示活跃区域,根据指标可以很直观的判断当前行情是属于趋势行情,还是震荡行情。    并根据指标的指示箭头切入市场,绿色箭头提示买入,红色箭头提示卖出。 •  建议使用5分钟以上的时间周期进行交易,避免因为小周期波动出现频繁的交易信号。 •  您也可以开启信号提示,以免错过最佳的交易时机。 •  本指标不但可以很好的预测趋势行情,也可以在宽幅震荡行情中获利。 •  本指标本着大道至简的原则,适合不同阶段的交易者使用。 注意事项: •  Alpha Trend sign 有明确的进出场信号,不建议逆势操作,以免造成损失。 •  Alpha Trend sign 是特别成熟的指标,我们团队人手一个,使用它可以实现稳定盈利。     
Infinity Trend Pro
Yaroslav Varankin
1 (1)
This is a trend indicator without redrawing Developed instead of the binary options strategy (by the color of the Martingale candlestick) Also works well in forex trading When to open trades (binary options) A signal will appear in the place with a candle signaling the current candle It is recommended to open a deal for one candle of the current timeframe M1 and M5 When a blue dot appears, open a deal up When a red dot appears, open a trade down. How to open trades on Forex. When a signal is rec
Trend Flasher
Amarnath K M
Trend Flasher Trend is your friend is the age old saying quote in trading arena, there are though many ways to gauge the trend and its direction, more scientific measure and logically meaningful will be an ATR break outs to identify and spot the trend and its acceleration, so we created this easy to use trend identification panel and optimized super trend based multi time frame panel entry system to aid and help the traders to make their trading decision. Unique Features of Trend Flasher 1. H
QuantumEdge Trader
Hossam Ali Ahmed Ali
QuantumEdge Trader v1.0 AI-Powered Precision Signals for Serious Traders QuantumEdge Trader is a smart and reliable indicator that delivers accurate BUY and SELL signals using advanced market analysis and trend detection. Designed for M1 to M60 timeframes, it's ideal for scalping and intraday strategies. --- Key Features: No Repaint – Signals never change after appearing Smart trend filters to reduce noise Adjustable sensitivity and alerts Perfect for XAUUSD, EURUSD, and m
Super Reversal Pattern
Parfait Mujinga Ndalika
Super Reversal Pattern Indicator Unlock the power of advanced pattern recognition with our Super Reversal Pattern Indicator. Designed for traders seeking precision and reliability, this indicator identifies one of the most effective reversal patterns in technical analysis, offering a significant edge in your trading strategy. Key Features: Non-Repainting Accuracy: Enjoy the confidence of non-repainting technology. Once a Super Reversal Pattern is detected, it remains static, providing consiste
Before
Nadiya Mirosh
The Before indicator predicts the most likely short-term price movement based on complex mathematical calculations. Most of the standard indicators commonly used in trading strategies are based on fairly simple calculations. This does not mean that there were no outstanding mathematicians in the world at the time of their creation. It is just that computers did not yet exist in those days, or their power was not enough for the sequential implementation of complex mathematical operations. Nowad
Crypto_Forex 指标 HTF Ichimoku 适用于 MT4。 - Ichimoku 指标是最强大的趋势指标之一。HTF 表示 - 更高时间框架。 - 此指标非常适合趋势交易者以及与价格行动条目的组合。 - HTF Ichimoku 指标允许您将更高时间框架的 Ichimoku 附加到当前图表。 - 上升趋势 - 红线高于蓝线(并且两条线都在云层上方)/ 下降趋势 - 红线低于蓝线(并且两条线都在云层下方)。 - 仅当价格突破 Ichimoku 云层顶部边界时才打开买入订单。 - 仅当价格突破 Ichimoku 云层底部边界时才打开卖出订单。 - HTF Ichimoku 指标提供了捕捉大趋势的机会。 点击这里查看高质量的交易机器人和指标! 它是仅在此 MQL5 网站上提供的原创产品。
PABT Pattern Indicator - it's classical system one of the signal patterns. Indicator logic - the Hi & Lo of the bar is fully within the range of the preceding bar, look to trade them as pullback in trend. In the way if indicator found PABT pattern it's drawing two lines and arrow what showing trend way.  - First line - it's entry point and drawing at: 1. On the high of signal bar or on middle of the signal bar (depending from indicator mode) for buy; 2. On the low of signal bar or on middle of t
Wolfe Wave Scanner
Jalitha K Johny
4.5 (2)
Wolfe Waves scanner - It scans all the Symbols and identify the movement of price and it gives confidence in trade. It automatically plots  fifth wave breaks out of the channel. According to the theory behind the pattern, a line drawn from the point at the beginning of the first wave and passing through the beginning of the fourth wave predicts a target price for the end of the fifth wave. If a trader properly identifies a Wolfe Wave as it forms, the beginning of the fifth wave represents an op
Signal From Level
Yaroslav Varankin
Binary Options Support Resistance Indicator This indicator is designed for binary options trading and effectively shows retracements from support and resistance levels. Signals appear on the current candle. A red arrow pointing downwards indicates a potential selling opportunity, while a blue arrow pointing upwards suggests buying opportunities. All that needs adjustment is the color of the signal arrows. It is recommended to use it on the M1-M5 timeframes as signals are frequent on these timef
Rainbow Price Visualizer
Vincent Jose Proenca
Rainbow Price Visualizer v1.21 See where the market really breathes. Turns your MT4 chart into an ultra-precise heatmap that highlights price zones favored by big players. Why it matters 300 price levels at 0.2‑pip resolution — microscopic detail. 8 visual themes (Rainbow, Fire, Ocean…) for instant readibility. Smart opacity: low noise fades, real zones pop. Lightweight rendering with automatic cleanup. Fully customizable: saturation, opacity, resolution, history depth. Bands project into the f
TrendMaster MT4
Giacomo Donati
How TrendMaster Works TrendMaster is a trading indicator designed to streamline and enhance your chart analysis. Using algorithmic logic, it reviews historical price data to generate a dynamic reference line. When price action crosses this line, a "BUY" or "SELL" signal is displayed on your chart. The goal is to assist in identifying potential shifts in price behavior with a clear and user-friendly visual approach. Why Use TrendMaster? The TrendMaster MT4 Indicator helps highlight potential tre
Delta Fusion Pro
Francesco Secchi
5 (2)
Delta Fusion Pro – 高级订单流分析,专为日内交易设计 Delta Fusion Pro 是一款专业的 MetaTrader 4 指标,能够揭示市场中的主动订单流,实时显示机构压力的强度和方向。与传统的成交量指标不同,它分析买盘(Ask)与卖盘(Bid)之间的成交量差值(Delta),用于提前预测反转、确认趋势并识别专业兴趣区域。 主要特点 智能自动调节系统 根据以下条件自动调整所有参数: 交易品种类型(外汇、加密货币、指数、大宗商品、股票) 操作周期 市场波动率(ATR) 最近平均成交量 无需手动配置,适合新手交易者——指标自动完成校准! 核心功能 净Delta与累计Delta 计算主动买盘/卖盘成交量差值,支持自定义 EMA 平滑 实时显示方向性压力 可自定义直方图颜色(买入/卖出) 价格/成交量背离 自动检测常规与隐藏背离 强度分类:强/中/弱 高级过滤:成交量确认、趋势、时间距离 图形信号(彩色箭头) 市场失衡 识别显著的买盘/卖盘比例失衡(可配置比率) 最小成交量阈值验证 图表显示彩色点(多头/空头) Infusion Volume 检测异常成交量峰值(
NexusSignal Scalping
Vincent Jose Proenca
技术说明 Nexus Signal System 是一款 MT4 指标,结合了 12 个技术指标来生成交易信号。该系统在确认信号前会分析多种因素的共振(趋势、动量、成交量、支撑/阻力区),与只使用单一指标的工具相比,可减少假信号的数量。 分析标准(评分 0–15 分): 图形形态识别(Pin Bar、吞没形态) 多时间框架分析(高时间框架趋势确认) ADX 市场状态(避免无趋势市场) 支撑/阻力区(自动识别波段点) 均线 20/50/200(趋势对齐) RSI 14 周期(动量指标) 相对成交量(机构确认) ATR(波动率) 功能特点: 带透明评分的信号(0–15 分) 自动检测支撑/阻力区并在图表上显示 初步信号(当前K线)与确认信号(已收盘K线) 止损和止盈通过 ATR 计算 实时市场信息面板 8 种颜色主题可供视觉定制 56 个可配置参数,可适应您的交易风格 使用方法: 安装: 在 MetaEditor 编译并加载到图表 关键参数: Min_Signal_Score :设置最低信号质量阈值(默认 6.5/15) MTF_Timeframe :确认用时间框架(默认 H4) Colo
Trend PA
Mikhail Nazarenko
5 (3)
The Trend PA indicator uses   Price Action   and its own filtering algorithm to determine the trend. This approach helps to accurately determine entry points and the current trend on any timeframe. The indicator uses its own algorithm for analyzing price changes and Price Action. Which gives you the advantage of recognizing, without delay, a new nascent trend with fewer false positives. Trend filtering conditions can be selected in the settings individually for your trading style. The indicator
Trendiness Index
Libertas LLC
5 (3)
"The trend is your friend" is one of the best known sayings in investing, because capturing large trendy price movements can be extremely profitable. However, trading with the trend is often easier said than done, because many indicators are based on price reversals not trends. These aren't very effective at identifying trendy periods, or predicting whether trends will continue. We developed the Trendiness Index to help address this problem by indicating the strength and direction of price trend
UniversalIndicator
Andrey Spiridonov
UniversalIndicator is a universal indicator. A great helper for beginners and professional traders. The indicator algorithm uses probabilistic and statistical methods for analyzing the price of a trading instrument. The indicator is set in the usual way. Advantages of the indicator works on any time period works with any trading tool has a high probability of a positive forecast does not redraw Indicator Parameters LengthForecast = 30 - the number of predicted bars
Chart Patterns Detect 15 patterns (Ascending Triangle, Descending Triangle, Rising Wedge, Falling Wedge, Bullish Flag, Bearish Flag, Bullish Rectangle, Bearish Rectangle Symmetrical triangle, Head and Shoulders, Inverted Head and Shoulders, Triple top, Triple Bottom, Double Top, Double Bottom) Use historical data to calculate the probability of each pattern to succeed (possibility to filter notification according to the chance of success) gives graphic indication about the invalidation level and
VR Cub
Vladimir Pastushak
VR Cub 这是获得高质量切入点的指标。该指标的开发是为了促进数学计算并简化对仓位入场点的搜索。多年来,该指标所针对的交易策略已被证明其有效性。交易策略的简单性是其巨大的优势,即使是新手交易者也能成功进行交易。 VR Cub 计算开仓点以及获利和止损目标水平,这显着提高了效率和易用性。查看使用以下策略进行交易的屏幕截图,了解简单的交易规则。 设置、设置文件、演示版本、说明、问题解决,可以从以下位置获取 [博客] 您可以在以下位置阅读或撰写评论 [关联] 版本为 [MetaTrader 5] 计算入场点的规则 开仓 要计算入场点,您需要将 VR Cub 工具从最后一个高点拉伸到最后一个低点。 如果第一个点在时间上早于第二个点,交易者等待柱线收于中线上方。 如果第一个点在时间上晚于第二个点,交易者等待柱线收于中线下方。 根据上述条件,严格在 柱线收盘 后建仓。 换句话说,如果我们在小时图上进行交易,那么从最高点到最低点的时间距离必须超过24小时,最高点和最低点之间的点数必须大于或等于平均价格变动每天。 维持和改变市场地位 可以有多个未平仓头寸;每个头寸都可以单独修改。 VR Cub
Minotaur Waves Signal
Leandro Bernardez Camero
Minotaur Waves 是一款高精度市场分析工具,结合双重信号引擎设计,旨在识别趋势转折点并确认价格动量的变化。系统集成了强大的 Minotaur Oscillator (牛头人振荡器)与动态区间结构,提供清晰可视的非重绘入场信号,适用于所有货币对,尤其在 EURUSD、GBPUSD、USDJPY 的 M1、M5、M15 和 M30 时间周期下表现最佳。 获取最新更新和操作指南: https://www.mql5.com/en/channels/forexnewadvisor 系统核心组成: 动态区间系统: 实时跟踪价格动量变化,展示关键趋势与突破区域 Minotaur Oscillator: 通过柱状图展示动量极值,精确确认买卖转折点 信号逻辑与入场条件: 交易信号仅在价格行为与振荡器状态共同满足下生成,满足以下全部条件时发出交易提醒: Minotaur Oscillator 出现已确认极值: 高点为 +33 (买入),低点为 -33 (卖出) 价格突破动态区间的关键确认水平 所有计算基于已收盘的K线 ,确保信号不重绘且稳定可靠 在满足以上条件后,系统将触发: 多通道提
Mirror
Stanislav Korotky
This indicator predicts rate changes based on the chart display principle. It uses the idea that the price fluctuations consist of "action" and "reaction" phases, and the "reaction" is comparable and similar to the "action", so mirroring can be used to predict it. The indicator has three parameters: predict - the number of bars for prediction (24 by default); depth - the number of past bars that will be used as mirror points; for all depth mirroring points an MA is calculated and drawn on the ch
Gvs Undefeated Trend   indicator is designed for trend and signal trading. This indicator generates trend signals.  It uses many algorithms and indicators to generate this signal. It tries to generate a signal from the points with the highest trend potential. This indicator is a complete trading product. This indicator does not need any additional indicators.  You can only trade with this indicator. The generated signals are displayed on the graphical screen.  Thanks to the alert features you ca
The new update makes this indicator a complete tool for studying, analyzing and operating probabilistic patterns. It includes: On-chart Multi-asset percentage monitor. Configurable martingales. Twenty-one pre-configured patterns , including Mhi patterns and C3. An advanced pattern editor to store up to 5 custom patterns. Backtest mode to test results with loss reports. Trend filter. Hit operational filter. Martingale Cycles option. Various types of strategies and alerts. Confluence between patte
The King of Forex Trend Cloud Indicator is a trend following indicator based on moving averages. The Indicator is meant to Capture both the beginning and the end of a trend. This indicator can be used to predict both short and long terms market trends.  The king of Forex Trend Cloud if paired together with the King of Forex Trend Indicator can give a broad picture in market analysis and forecasts. I have attached images for both the  The king of Forex Trend Cloud on its own and  The king of Fore
Renko, Heiken Ashi, Ticks Bar, Range Bar.    Easy switching, easy setup, all in one window.        Place the Custom Chart indicator and view Renko, Heiken Ashi, Tick bar, Range bar charts in real time at real chart.    Position the offline chart window so that the indicator control panel is visible.    Switch the chart mode by click of a button.    Connect to the output chart any indicator, expert advisor without any restrictions.    No, it doesn't work in the tester.    Yes, you can use an
Crosskalp1
Mikhail Bilan
Добрый День уважаемые трейдеры!  Вашему вниманию индикатор созданный и работающий на базе трендовика ADX,  для торговли на смене направления движения который учитывает коррекцию и даёт возможность на ней заработать.  Применяю этот индикатор для скальпинга. Рекомендую таймфреймы от 15 ти минутного(М15) до часового (Н1) периодов.  Красный кружок сигнал на продажу- Sell) Зелёный кружок  сигнал на покупку Buy) Чем меньше ваш таймфрейм тем меньше пунктов вы зарабатываете.   Важно выставлять стопы! !В
Forex Gump Trend 是一種通用指標,用於高效確定趨勢方向。如果您正確識別趨勢,這就是 95% 的交易成功,因為您將能夠在價格變動的方向上開倉並從中受益。 Forex Gump Trend 指標幫助交易者以高度的效率確定當前趨勢方向,以及趨勢反轉點。趨勢的方向在圖表上用彩色線表示,趨勢反轉點用箭頭表示。該指標有許多設置,允許您在幾乎所有時間框架和所有貨幣對上使用它。 如何與外匯阿甘趨勢交易? 交易策略取決於交易者的交易風格和他所使用的貨幣對。但在全球範圍內,使用該指標的交易策略始終基於趨勢方向的開單。該指標用彩色線條顯示趨勢。因此,當指標畫出藍線時,我們建立買入交易,當指標畫出紅線時,我們建立賣出交易。考慮到大多數交易者使用剝頭皮策略進行交易的事實,我們建議將 TakeProfit 放置在最小距離。大約15-25分。這是由於剝頭皮。在剝頭皮交易中,我們的目標是在短距離內打開許多訂單。止損設置在指標信號線的上方或下方或趨勢發生變化時。我們總是以小批量交易,這使我們能夠減少交易餘額的負擔。我們嘗試每天進行大量交易以平均結果。因此,如果我們開立大量短距離交易,我們會增加盈
Interactive BB Matrix
Tsvetan Tsvetanov
2 (1)
This indicator displays Bollinger Bands signals for multiple symbols and multiple time frames. The signals are created as a simple ratios which represent the distance between the current price and the moving average measured in standard deviations. This way we create a very versatile and easy to use indicator which helps us to identify not only the strongest trends but also the most overbought and oversold conditions. Features Accurate signals in real time for multiple time frames and multiple
Crypto_Forex 指标“晨星模式”适用于 MT4。 - 指标“晨星模式”是价格行为交易的非常强大的指标:无需重绘,无延迟。 - 指标检测图表上的看涨晨星模式:图表上的蓝色箭头信号(见图片)。 - 带有 PC、手机和电子邮件警报。 - 还有它的兄弟 - 看跌“黄昏之星模式”指标可用(点击以下链接)。 - 指标“晨星模式”非常适合与支撑/阻力位结合使用。 ................................................................................................................. 点击这里查看高质量的交易机器人和指标! 这是仅在此 MQL5 网站上提供的原创产品。
该产品的买家也购买
Ultimate Sniper Dashboard
Hispraise Chinedum Abraham
4.82 (22)
折扣价为299美元! 未来可能会涨价! 请阅读下面的描述! 终极狙击手仪表盘的最佳进入系统。终极动态水平。(请查看我的产品) 由于MT4多币种测试的限制,终极狙击手仪表盘只适用于实时市场。 介绍Ultimate-Sniper Dashboard! 我们最好的产品包括HA-狙击手、MA-狙击手和许多特殊模式。终极狙击手仪表盘是一个绝对的野兽! 对于任何新手或专家交易者来说,这是最好的解决方案! 永远不要再错过任何一个动作! 对于那些喜欢简单和点数的交易者,我们有一个特别的产品给你。本质上很简单,该仪表板根据多种自定义算法查看28种货币对,完成所有工作。只需一张图表,你就可以像专家一样阅读市场。试想一下,如果你能在任何外汇对开始移动时准确地确定其方向,你的交易会有多大的改善。   我们的系统是为了寻找高概率信号并实时向用户发送警报。没有滞后或错误的信号。 为了保持图表的清洁,你可以在不需要时隐藏Ultimate-Sniper。只需按下箭头按钮即可隐藏仪表板。 Ultimate-Sniper适用于从1分钟到月度的所有时间框架,因此你可以在你选择的任何时间框架上快速发现趋势。 高概率信号
Scalper Inside PRO
Alexey Minkov
4.74 (69)
Scalper Inside PRO – Since 2020. An exclusive indicator that utilizes an innovative algorithm to swiftly and accurately determine the market trend. The indicator automatically calculates opening, closing, and profit levels, providing detailed trading statistics. With these features, you can choose the most appropriate trading instrument for the current market conditions. Additionally, you can easily integrate your own arrow indicators into Scalper Inside Pro to quickly evaluate their statistics
Dynamic Scalper System
Vitalyi Belyh
5 (1)
“ Dynamic Scalper System ”指标专为在趋势波内进行剥头皮交易而设计。 已在主要货币对和黄金上进行测试,并可与其他交易工具兼容。 提供顺势短线建仓信号,并提供额外的价格变动支持。 指标原理: 大箭头决定趋势方向。 在趋势波内,我们采用一种生成小箭头形式的剥头皮交易信号的算法。 红色箭头代表看涨方向,蓝色箭头代表看跌方向。 敏感的价格变动线会沿着趋势方向绘制,并与小箭头信号协同作用。 信号运作方式如下:当线在适当时刻出现时,将形成入场信号;在出现线时,持仓;线完成后,平仓。 建议的操作时间范围为M1 - H4。 箭头在当前K线上方形成,如果下一根K线已开仓,则不会重新绘制上一根K线上方的箭头。 输入参数 Trend Wave Period - 趋势方向(大箭头)的周期,改变趋势波的时间间隔。值 1 表示趋势方向的最长持续时间,参数值越大,持续时间越短。 Scalper Arrows Period - 信号箭头(小箭头)的计算周期,改变入场信号的生成频率。值 3 表示最频繁的生成频率,参数值越大,箭头频率越低,准确度越高。 这些参数可以根据不同的时间范
Smart Price Action Concepts
Issam Kassas
4.77 (13)
首先,值得强调的是,这个交易工具是非重绘、非重画和非滞后的指标,非常适合专业交易。 在线课程,用户手册和演示。 智能价格行动概念指标是一个非常强大的工具,既适用于新手,也适用于经验丰富的交易者。它将超过20个有用的指标合并到一个指标中,结合了高级交易思想,如内圈交易员分析和智能资金概念交易策略。该指标侧重于智能资金概念,提供有关大型机构交易方式的见解,帮助预测它们的动向。 它在流动性分析方面尤其擅长,有助于理解机构的交易方式。它擅长预测市场趋势,并仔细分析价格波动。通过将您的交易与机构策略对齐,您可以更准确地预测市场走向。该指标多才多艺,擅长分析市场结构,识别重要的订单区块,并识别各种模式。 它擅长识别BOS和CHoCH等模式,理解动量的转变,并突出显示供需强劲的关键区域。它还擅长发现强大的不平衡,并分析价格创造更高高点或更低低点的模式。如果您使用斐波那契回撤工具,该指标可以满足您的需求。它还可以识别相等的高点和低点,分析不同的时间框架,并通过仪表板显示数据。 对于使用更高级策略的交易者,该指标提供了工具,如公平价值差指标和优惠和折扣区域的识别。它特别关注高时间框架订单区块,并
Ultimate Dynamic Levels
Hispraise Chinedum Abraham
4.7 (10)
目前正在进行节日折扣,价格为399美元! 未来价格可能会上涨。请阅读下面的描述!   介绍 Ultimate Dynamic Levels - Ultimate Sniper Dashboard的最佳入场指标! 极低风险的及时进场和高RR!! 在这里找到终极狙击手仪表板。 对于初学者和职业交易者来说,最重要的能力是准确判断市场最可能转向的位置和时间,以及如何安全进入并获利退出。 终极动态水平指标很容易告诉你市场转折的最高可能性在哪里,这样你就可以自信地进入一个极低风险的交易,同时保持你的图表干净和简单,同时赚取美元! 终极动态水平指标有一个独特而强大的算法,可以同时在多个时间框架上找到重要的隐藏水平。它实在是太神奇了,而且永远不会像其他典型的SR指标那样重绘或重新绘制水平线!  终极动态水平指标还在图表的右侧有一个水平强度简介,以显示该水平在最近的历史上是否强劲。一个强大的奖励组合!!!。 终极动态水平指标有3个非常重要的功能。 1. 帮助你进入趋势方向的低风险交易。 2. 2.使你保持在趋势中,只要移动仍在进行。 3. 3.作为追踪止损,保护你的收益,避免把钱留在桌上! 强
Route Lines Prices -  是一款用于寻找价格方向的指标。其简洁的界面包含多种价格行为和未来方向计算算法。这些算法包括基于所用时间周期的波动率计算和价格平滑。 该指标只有一个参数,用于更改“ Calculating price values ”。默认值 1 提供均衡的自动计算, 无需手动配置即可使用。 通过手动更改 2 到 500 之间的值,您可以根据自己的交易系统自定义指标。 建议在 M1 到 H4 的时间周期内使用此指标。适用于任何交易品种。 信号箭头在蜡烛图收盘时生成;不会重绘历史数据。 主图表上提供重复箭头。 提供多种类型的警报。内置的线轨迹计数器基于收盘价工作。这意味着,当出现相反信号时,会确定价格轨迹的数值,并在信号结束后的下一根蜡烛图上显示这些数值。 总计数器将获得的值相加,以便在相应的图表上方便地调整参数。
介绍 ON Trade Waves Patterns Harmonic Elliot Wolfe,这是一款高级指标,旨在使用手动和自动方法检测各种市场模式。以下是它的工作原理: 谐波模式: 该指标可以识别出现在您图表上的谐波模式。这些模式对于练习谐波交易理论的交易者非常重要,正如Scott Carney的书《谐波交易第1卷和第2卷》所描述的那样。无论您是手动绘制它们还是依赖自动检测,ON Trade Waves Patterns都可以胜任。 控制面板: 我们配备了一个用户友好的控制面板,它会保存您的图表和时间帧设置,使您可以轻松切换不同配置。您甚至可以最小化它以最大化图表空间。如果您更喜欢使用其他分析工具,只需单击关闭按钮即可隐藏所有指标数据。 模板保存: 当您自定义设置或添加其他指标,如移动平均线或布林带时,该指标会自动保存您的模板。这意味着您可以随时轻松加载您喜欢的设置。 优化显示: 对于Windows 10用户,我们建议调整您的DPI设置以获得高清设备上的最佳屏幕体验。右键单击MetaTrader图标,选择“兼容性”,然后选择“更改高DPI设置”,将其设置为“系统(增强)”。
Currency Strength Exotics
Bernhard Schweigert
4.88 (33)
目前8折优惠! 对任何新手或专家交易者来说都是最好的解决方案! 这个指标是专门用来显示任何符号的货币强度,如异国货币对、商品、指数或期货。它是同类产品中的第一个,任何符号都可以添加到第9行,以显示黄金、白银、石油、DAX、US30、MXN、TRY、CNH等的真实货币强度。这是一个独特的、高质量的、负担得起的交易工具,因为我们已经纳入了一些专有的功能和一个新的公式。想象一下,你的交易将如何改善,因为你能够准确地确定新趋势或剥头皮机会的触发点? 用户手册:点击这里   https://www.mql5.com/en/blogs/post/708876 它适用于所有时间框架。你将很快能够看到TREND! 根据新的基础算法设计,它使识别和确认潜在交易变得更加容易。这是因为它以图形方式显示了8种主要货币和一种符号的强弱。 该指标显示了8种主要货币(澳元加元瑞士法郎欧元英镑日元新西兰美元)的强弱线,再加上一个符号! 该指标显示了符号的真实价值。例如:对于XAUUSD(黄金):价格以美元报价。如果黄金在上涨,你怎么能知道是黄金的强势还是美元的弱势?只有当黄金走强时,我们才会进行交易。该指
BTMM State Engine Pro MT4
Garry James Goodchild
BTMM State Engine Pro is a MetaTrader 4 indicator for traders who use the Beat The Market Maker approach: Asian session context, kill zone timing, level progression, peak formation detection, and a multi-pair scanner from a single chart. It combines cycle state logic with a built-in scanner dashboard so you do not need the same tool on many charts at once. What it does Draws the Asian session range; session times can follow broker server offset or be set in inputs. Tracks level progression (L
Linear Trend Predictor — 结合切入点和方向支撑线的趋势指标。按照突破高/低价通道的原理运作。该指标算法过滤市场噪音,考虑波动性和市场动态。 指示器功能  使用平滑方法,显示市场趋势和开立买入或卖出订单的切入点。  适合通过分析任何时间范围内的图表来确定短期和长期的市场走势。  输入参数可适应任何市场和时间范围,允许交易者独立定制指标。  设定的指示信号不会消失,也不会重新绘制——它是在蜡烛收盘时确定的。  几种类型的通知以箭头组合。  该指标既可以作为独立的交易系统使用,也可以作为其他交易系统的补充。  可供任何经验水平的交易者使用。 主要参数 Volatility Smoothing Level - 指标的主要参数,允许您配置指标以实现舒适的操作。 它的数字范围是 1 到 100,从而增加了您可以获得更长趋势运动的平滑度。 通过少量的数字,您可以获得短期走势并快速退出交易。 使用指标进行交易的时刻:  红线和箭头表示下降趋势和卖出开盘信号。止损应根据前一个上分形来设置。  黄线和箭头表示上升趋势和买入开盘信号。止损应根据前一个下分形来设置。
GOLD Impulse with Alert
Bernhard Schweigert
4.67 (12)
这个指标是我们2个产品 Advanced Currency IMPULSE with ALERT  +   Currency Strength Exotics 的一个超级组合。 它适用于所有时间框架,并以图形方式显示8种主要货币和一种符号的强势或弱势冲动! 该指标专门用于显示任何符号的货币强度加速,如黄金、异国货币对、商品、指数或期货。这是它的第一个指标,任何符号都可以被添加到第9行,以显示黄金、白银、石油、DAX、US30、MXN、TRY、CNH等的真实货币强度加速(冲动或速度)。 建立在新的基础算法上,它使识别和确认潜在的交易更加容易。这是因为它以图形方式显示了一种货币的强势或弱势是否正在加速,并测量了这种加速的速度--把它想象成你汽车中的速度表。当你加速时,事情显然会发生得更快,这在外汇市场上也是一样的,即如果你配对的货币正在向相反的方向加速,你就会发现一个潜在的有利可图的交易。 动态市场斐波那契28水平被用作警报触发器,将适应市场活动。如果冲动击中黄色触发线,你将收到警报。然后你就知道作为一个交易员应该做什么。货币对和方向已经给出。只需点击警报按钮,就可以切换到该货
Volatility Trend System - a trading system that gives signals for entries. The volatility system gives linear and point signals in the direction of the trend, as well as signals to exit it, without redrawing and delays. The trend indicator monitors the direction of the medium-term trend, shows the direction and its change. The signal indicator is based on changes in volatility and shows market entries. The indicator is equipped with several types of alerts. Can be applied to various trading ins
Miraculous 指标 – 100% 不重绘的外汇和二元期权工具,基于江恩九方图 这个视频介绍的 Miraculous 指标 是一款专为外汇和二元期权交易者开发的高精度、强大交易工具。该指标的独特之处在于它建立在传奇的 江恩九方图 和 江恩振动法则 之上,使其成为现代交易中可用的最精确预测工具之一。 Miraculous 指标 完全不重绘 ,这意味着它的信号在 K 线收盘后不会改变或消失——你看到的就是你得到的。这为交易者提供了可靠且一致的基础,让他们能够自信地进出场交易。 主要特点: 基于江恩九方图和江恩理论构建 100% 不重绘的信号系统 适用于所有时间周期(M1、M5、H1、H4、日线、周线) 适用于外汇和二元期权交易 清晰的买卖信号,准确率高 可用于剥头皮、日内交易或波段交易 兼容大多数 MT4 平台 这款工具旨在帮助初学者和专业交易者做出更好、更明智的决策。无论您是交易货币、指数还是二元期权,Miraculous 指标都将为您在市场中提供所需的优势。
目前八折优惠! 对任何新手或专家交易者来说都是最好的解决方案! 这个仪表板软件适用于28种货币对。它基于我们的两个主要指标(高级货币强度28和高级货币冲动)。它对整个外汇市场提供了一个伟大的概述。它显示高级货币强度值,货币运动速度和28个外汇对在所有(9)时间段的信号。想象一下,当你可以使用图表上的单一指标观察整个市场,以确定趋势和或剥头皮的机会时,你的交易将得到改善 我们已经在这个指标中建立了一些功能,使你更容易识别强势和弱势货币,同时识别和确认潜在的交易。该指标以图形方式显示货币的强势或弱势是增加还是减少,以及它在所有时间段的表现。 增加的新功能是动态市场斐波那契水平,它适应当前的市场条件变化,这是一个已经在我们的高级货币强度28和高级货币冲动指标中使用的成熟的加分项。 在交易时,总是将弱势货币和强势货币配对,这个新指标将帮助你做到这一点。 用户手册:点击这里  https://www.mql5.com/en/blogs/post/708783 特点  显示每个时间段的ACS28和GAP-speed(冲动)的货币强度值。 列:颜色代码以7种颜色显示货币强度:强势
Super Signal – Skyblade Edition 專業級無重繪 / 無延遲趨勢信號系統,擁有卓越勝率 | 適用於 MT4 / MT5 在較低的時間週期上效果最佳,例如 1 分鐘、5 分鐘與 15 分鐘圖表。 核心特色: Super Signal – Skyblade Edition 是一套專為趨勢交易設計的智能信號系統。 其採用多重濾波邏輯,僅篩選出具有明確方向性、動能強勁且波動結構健康的走勢進場點。 本系統 不預測高點或低點 ,只有在同時滿足以下三項條件時才會觸發交易信號: 趨勢方向明確 動能持續增強 波動率結構穩定 此外,系統還結合市場流動性分析,以進一步提升信號的準確性與觸發時機。 信號特性: 所有箭頭信號皆為 100% 無重繪,無延遲 信號一旦出現即固定於圖表,不會閃爍或消失 提供圖表箭頭、資訊面板、彈出通知、聲音提示及推播訊息 支援 EA 呼叫(Buffer 輸出),可整合至自動化交易或信號跟單系統 提供預設參數模板,免調整即可使用,適合新手快速上手 總結: Super Signal – Skyblade Edition 是一款邏輯清晰、穩定高效的專業趨勢型
RFI levels PRO
Roman Podpora
5 (1)
该指标能够准确显示反转点和价格回落区域。     行业领军人物 。您能洞察新趋势的形成,并以最高的精准度做出决策,掌控每一笔交易。 与……结合时,展现其最大潜力     趋势线专业版   指标  VERSION MT5 该指标显示的内容: 新趋势开始时的反转结构和反转水平及其激活。 显示屏   获利了结   和   止损   风险回报比最低的水平     RR 1:2       。 具有智能减值逻辑的止损。 显示指定指标中两种趋势类型的反转形态。 指标: 根据     趋势线     (全球趋势变化) 潮流专业版     (趋势快速变化) 简单有效   扫描器   实时趋势(新增)。 多时间框架工具筛选。 展示   利润   在 LOGIC AI 信号之后。 以下列出今日走势积极的金融工具。(RB键) 能够为终端启用通知(警报)功能,并向移动设备推送通知。 逻辑人工智能     — 利用人工智能寻找最佳切入点。 只有在启用 MTF(多时间框架分析)模式时,该功能才可用。 兼容性。 当与趋势线指标结合使用时,该指标能发挥其最大潜力。 这     RFI LEVELS PRO    
NAM Order Blocks
NAM TECH GROUP, CORP.
3.67 (3)
MT4多時限訂單塊檢測指示器。 特徵 -在圖表控制面板上完全可自定義,提供完整的交互。 -隨時隨地隱藏和顯示控制面板。 -在多個時間範圍內檢測OB。 -選擇要顯示的OB數量。 -不同的OB用戶界面。 -OB上的不同過濾器。 -OB接近警報。 -ADR高低線。 -通知服務(屏幕警報|推送通知)。 概括 訂單塊是一種市場行為,它指示從金融機構和銀行收取訂單。著名的金融機構和中央銀行帶動了外匯市場。因此,交易者必須知道他們在市場上正在做什麼。當市場建立訂單塊時,它會像發生大多數投資決策的範圍一樣移動。 訂單建立完成後,市場將朝著上升和縮小的方向發展。訂單大宗交易策略的關鍵術語是它包括機構交易者正在做的事情。由於它們是主要的價格驅動因素,因此包括機構交易在內的任何策略都可以。 您將在任何時間範圍內實時看到訂單塊,使用我們的控制面板,您將能夠在所選的歷史記錄週期內檢測常規,拒收和未大寫的訂單塊。 現在您可以接收到訂單塊接近警報,我們在MT4上顯示屏幕通知,並將通知推送到您的手機!
Quantum Breakout Indicator PRO
Bogdan Ion Puscasu
4.96 (26)
介绍     Quantum Breakout PRO   ,突破性的 MQL5 指标,正在改变您交易突破区域的方式!   Quantum Breakout PRO 由拥有超过 13 年交易经验的经验丰富的交易者团队开发,旨在通过其创新和动态的突破区域策略将您的交易之旅推向新的高度。 量子突破指标将为您提供带有 5 个利润目标区域的突破区域的信号箭头,以及基于突破框的止损建议。 它既适合新手交易者,也适合专业交易者。 量子 EA 通道:       点击这里 MT5版本:   点击这里 重要的!购买后请私信我领取安装手册。 建议: 时间范围:M15 货币对:GBPJPY、EURJPY、USDJPY、NZDUSD、XAUUSD 账户类型:ECN、Raw 或 Razor,点差极低 经纪商时间:GMT +3 经纪商:IC Markets、Pepperstone with Raw 和 Razor 的点差最低 规格: 不重漆! 最多 5 个建议利润目标区域 建议止损水平 可定制的盒子。您可以设置自己的 Box Time Start 和 Box Time End。 接触 如果您
MetaForecast M4
Vahidreza Heidar Gholami
5 (2)
MetaForecast能够根据价格数据中的谐波来预测和可视化任何市场的未来走势。虽然市场不总是可预测的,但如果价格中存在模式,MetaForecast可以尽可能准确地预测未来。与其他类似产品相比,MetaForecast通过分析市场趋势可以生成更精确的结果。 输入参数 Past size (过去的尺寸) 指定MetaForecast用于创建生成未来预测模型的柱数量。该模型以一条黄色线绘制在所选柱上。 Future size (未来的尺寸) 指定应预测的未来柱数量。预测的未来以粉色线表示,并在其上绘制了蓝色回归线。 Degree (程度) 此输入确定了MetaForecast将在市场上进行的分析级别。 Degree 描述  0 对于程度0,建议使用较大的值来设置“过去的尺寸”输入,以覆盖价格中的所有高峰、低谷和细节。  1 (建议的) 对于程度1,MetaForecast可以理解趋势,并通过较小的“过去的尺寸”生成更好的结果。  2 对于程度2,除了趋势,MetaForecast还可以识别反转点。对于大于1的程度,必须使用较高的“细节”和“噪音减少”输入值。  大于2 不建议使用大于
訂閱指標注意事項 此信號只支援電腦版MT4 不支援MT5、手機、平板 指標只顯示當日進場箭頭 非直播指標顯示歷史箭頭 (直播為展示用) 指標為交易輔助性質 非EA自動交易 無跟單功能 指標只標示進場位置 無出場(止盈)指示 進場止損點位設定30-50 PIPS 或是前高前低做為防守 止損不需拉太遠 紅色箭頭為多方進場訊號 綠色箭頭為空方進場訊號 撐阻力強度用箭頭大小表示 此指標適用於波段策略 不適合當沖策略盤整 多空反轉時不適用 指標載入後 右下角都會預設顯示盤整 載入指標一小時後 才會顯示多空 加入Youtube頻道會員 可參加每個月一次實體抽獎活動(台灣以外地區,獎品折現金用Paypal匯出) 每月抽獎時間為非農數據公布當週的週末盤勢分析(2100) 得獎者必須抽獎時在線上,逾期不候
Fxland Price Reversal Zones (MT4) FXLAND Smart Reversal Indicator is a professional technical analysis tool designed to help traders identify potential price reversal zones and key market turning points with clarity and precision. The best reversal indicator and price return by choosing only one ceiling or floor in each time frame A masterpiece of combining mathematics and Gann, fractal matrix, Fibonacci, movement angle and time. Completely intelligent Key Features Detects potential pr
Dynamic Forex28 Navigator
Bernhard Schweigert
4.43 (7)
Dynamic Forex28 Navigator - 下一代外汇交易工具。 当前 49% 折扣。 Dynamic Forex28 Navigator 是我们长期流行的指标的演变,将三种功能合二为一: 高级货币强度 28 指标 (695 条评论)+ 高级货币 IMPULSE 带警报 (520 条评论)+ CS28 组合信号(奖励)。 有关指标的详细信息 https://www.mql5.com/en/blogs/post/758844 下一代强度指标提供什么? 您喜欢的原始指标的一切,现在通过新功能和更高的精度进行了增强。 主要特点: 专有货币强度公式。  所有时间范围内的平滑和准确的强度线。 非常适合识别趋势和精确进入。 动态市场斐波那契水平(市场斐波那契)。  此指标独有的独特功能。 斐波那契应用于货币强度,而不是价格图表。 适应实时市场活动以获得准确的反转区域。 实时市场动量。  第 9 行显示市场是活跃还是被动。 对于定时交易至关重要。 全面的警报和显示。  每种货币最强的买入和卖出动量。 ​​28 对的双重动量买入和卖出。 超买/超卖警告外部范围和止损。 反转
MTF Supply Demand Zones
Georgios Kalomoiropoulos
4.82 (22)
下一代自动化供需区。适用于任何图表的创新算法。所有区域都是根据市场的价格行为动态创建的。 两种类型的警报 --> 1) 当价格触及区域时 2) 当新区域形成时 你不会再得到一个无用的指标。您将获得一个完整的交易策略和经过验证的结果。     新的功能:     价格触及供需区时发出警报     创建新的供应/需求区时发出警报     推送通知警报     以点为单位的区域宽度标签     关于 MTF 的又一个时间表。因此,现在您将能够看到高于当前 3 个时间帧,而不是高于当前 2 个时间帧     启用/禁用警报/区域/MTF 功能的按钮 您获得的优势:     消除交易中的情绪。     客观化您的交易条目。     通过高概率设置提高您的利润。     节省绘图区域的时间。     像专业人士一样交易金融市场。     任何市场的即时多时间框架分析。 你在图表上看到了什么?     蓝色和红色矩形是当前时间范围的供需区。     虚线样式线是当前上方第一个时间范围内的供需区域。     实线样式线是当前上方第二个时间范围内的
Introducing the Delta Volume Profile Indicator - Unleash the Power of Institutional Precision!  Technical Indicator: Are you ready to trade like the pros? The Delta Volume Profile Indicator is no ordinary tool. It’s a high-precision, cutting-edge indicator that puts the power of institutional-grade trading in your hands. This unique indicator analyses delta volume distribution in real-time, revealing the market's hidden buy/sell imbalances that the biggest financial institutions rely on to antic
CRT Multi-Timeframe Market Structure & Liquidity Sweep Indicator Non-Repainting | Multi-Asset | MT5 Version Available MT5 Version:   https://www.mql5.com/en/market/product/162075 Full User Guide — explains what each feature does and why:   https://www.mql5.com/en/blogs/post/767525 Quick Start User Guide  — explains how to configure and in what order:  https://www.mql5.com/en/blogs/post/767540 Indicator Overview CRT Ghost Candle HTF Fractal is a complete institutional-grade market structure too
GoldRush Trend Arrow Signal
Kirk Lee Holloway
5 (2)
GoldRush 趨勢箭頭信號 GoldRush 趨勢箭頭信號 指標為 XAU/USD 中的高速、短期短線交易者提供精確、實時的趨勢分析。 專為1分鐘時間框架設計,此工具顯示方向箭頭以明確顯示入場點,使短線交易者能在波動市場中自信操作。 該指標包含主要和次要警示箭頭。主要信號為白色和黑色方向箭頭,用於指示趨勢方向的轉變;次要信號為藍色和紅色箭頭,用於確認主要箭頭指示的方向並提示潛在交易入場點。 注意:當趨勢方向發生變化後僅出現一個主要警報箭頭時,請注意可能會出現多個次要藍/紅箭頭。次要信號將在滿足信號標準的任何蠟燭圖後出現,因此在長期趨勢移動中,螢幕上將顯示大量次要箭頭(如附帶的截圖所示)。您可在設置中開啟或關閉任一箭頭類型。 以下是我使用此指標進行交易的方式: - 對於買入入場,我會耐心等待白箭頭在蠟燭收盤時出現,並在下一根可用蠟燭收盤時出現藍箭頭時進行買入交易。 - 對於賣出入場,我會耐心等待黑箭頭在蠟燭收盤時出現,並在下一根可用蠟燭收盤時出現紅箭頭時進行賣出交易。 - 獲利了結/止損設置由使用者自行負責,但我個人使用最低R:R為1:2,並發現這在倫敦/紐約開盤等
Pulse Scalping Line - an indicator for identifying potential pivot points. Based on this indicator, you can build an effective Martingale system. According to our statistics, the indicator gives a maximum of 4 erroneous pivot points in a series. On average, these are 2 pivot points. That is, the indicator shows a reversal, it is erroneous. This means that the second signal of the indicator will be highly accurate. Based on this information, you can build a trading system based on the Martingale
System Trend Pro
Aleksandr Makarov
5 (2)
System Trend Pro - This is the best trend trading indicator!!! The indicator no repaint!!!  The indicator has   MTF   mode, which adds confidence to trading on the trend (   no repaint   ). How to trade? Everything is very simple, we wait for the first signal (big arrow), then wait for the second signal (small arrow) and enter the market in the direction of the arrow. (See screens 1 and 2.) Exit on the opposite signal or take 20-30 pips, close half of it, and keep the rest until the opposite
El indicador "MR BEAST ALERTAS DE LIQUIDEZ" es una herramienta avanzada diseñada para proporcionar señales y alertas sobre la liquidez del mercado basándose en una serie de indicadores técnicos y análisis de tendencias. Ideal para traders que buscan oportunidades de trading en función de la dinámica de precios y los niveles de volatilidad, este indicador ofrece una visualización clara y detallada en la ventana del gráfico de MetaTrader. Características Principales: Canal ATR Adaptativo: Calcula
Meravith
Ivan Stefanov
5 (3)
做市商工具。 Meravith 将: 分析所有时间周期并显示当前正在运行的趋势。 标注流动性区域(成交量均衡区),即多头与空头成交量相等的位置。 在您的图表上直接显示来自不同时间周期的所有流动性水平。 生成并展示基于文本的市场分析供您参考。 根据当前趋势计算目标位、支撑位和止损位。 计算交易的风险回报比。 根据您的账户余额计算仓位大小,并估算潜在利润。 在市场出现重大变化时,Meravith 还会发出警告。 指标的主要线条: 多头/空头成交量衰竭线 —— 作为目标位使用。 趋势线 —— 指示市场趋势方向。根据市场是多头还是空头而改变颜色,并作为趋势支撑。其颜色主要反映市场情绪。 成交量均衡线(Eq)—— Eq(Volume Equilibrium)是系统的核心。它表示买卖双方成交量的平衡点,即市场流动性所在位置。向上突破 Eq 表示多头倾向,向下突破 Eq 表示空头倾向。突破后,应等待回调——当价格回到相反趋势的偏离线或衰竭线附近时。 使用方法:只需将其添加到图表中。 Meravith 可以分析一切——趋势和回调。 趋势线与某条成交量衰竭线之间的距离越大,说明该方向的成交量越高。 趋
作者的更多信息
Mantis Shrimp Convergence (MSC) A new way to see market momentum — no lag, no confusion. What is MSC? Mantis Shrimp Convergence (MSC) is a powerful non-repainting oscillator, inspired by the logic of MACD but rebuilt for modern trading: zero lag, no false divergences, and dual-line precision. Designed for traders who demand clarity, speed, and reliability, MSC reveals momentum shifts with unmatched visual and structural accuracy. How it Works MSC uses two signal lines — Fast and Slow,
Kingdom Of Bots MT4
Andrei Vasilescu
KOB – Kingdom Of Bots MT4 This is the   MT4   version.  For the   MT5   version, please refer to the corresponding product page . Limited launch offer: ~60% discount at initial ladder level (40Θ vs.  100 Θ  baseline). *** KOB uses a deterministic Theta pricing ladder  ( Θ =  17.29 USD ). Prices increase automatically every 100 licenses. KOB uses discrete theta-function cycles to trade structured market regimes with deterministic timing. KOB trades   regime-based , not noise-based. KOB aligns ex
This is the MT4 version. For the MT5 version, please refer to the corresponding product page . StrategyTracker MT4 – Analyze, Visualize & Optimize Every Trade Stop guessing —   see exactly how your trades perform   in real & demo accounts Visual   entry & exit points   on chart with trendlines  Track   open positions, Average Price, pending orders , and full trade history Consolidated trades —   entry + exit in one row  Quickly identify   execution mistakes, risk exposure, and st
Mantis Shrimp Convergence (MSC) A new way to see market momentum — no lag, no confusion. What is MSC? Mantis Shrimp Convergence (MSC) is a powerful non-repainting oscillator, inspired by the logic of MACD but rebuilt for modern trading: zero lag, no false divergences, and dual-line precision. Designed for traders who demand clarity, speed, and reliability, MSC reveals momentum shifts with unmatched visual and structural accuracy. How it Works MSC uses two signal lines — Fast and Slow,
Kingdom Of Bots MT5
Andrei Vasilescu
KOB – Kingdom Of Bots MT5 This is the MT5 version. For the MT4 version, please refer to the corresponding product page . Limited launch offer: ~60% discount at initial ladder level (40Θ vs. 100 Θ  baseline).  ***KOB uses a deterministic Theta pricing ladder  ( Θ = 17.29 USD ). Prices increase automatically every 100 licenses. KOB uses discrete theta-function cycles to trade structured market regimes with deterministic timing. KOB trades regime-based , not noise-based. KOB aligns execution to ma
This is the MT5 version. For the MT4 version, please refer to the corresponding product page . StrategyTracker MT5 – Analyze, Visualize & Optimize Every Trade Stop guessing — see exactly how your trades perform in real & demo accounts Visual entry & exit points on chart with trendlines  Track open positions, Average Price, pending orders , and full trade history Consolidated trades — entry + exit in one row  Quickly identify execution mistakes, risk exposure, and strategy weaknes
筛选:
无评论
回复评论