Beautiful

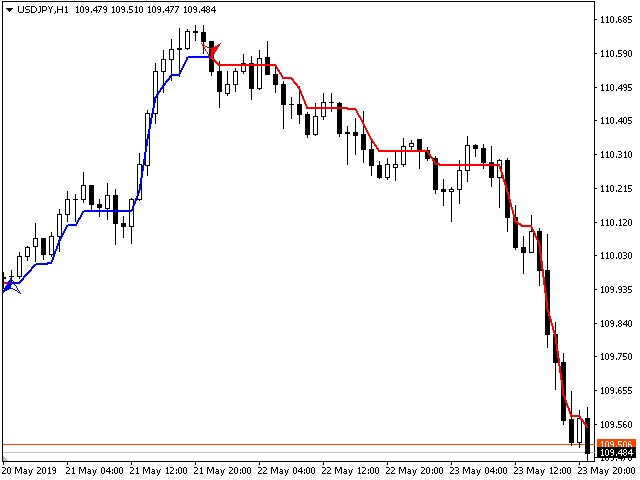
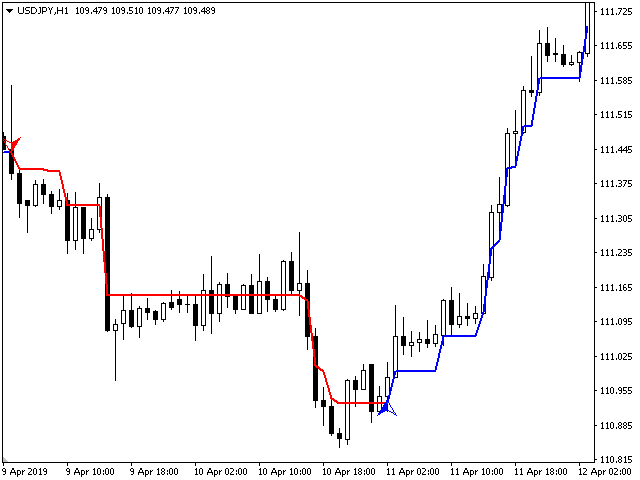
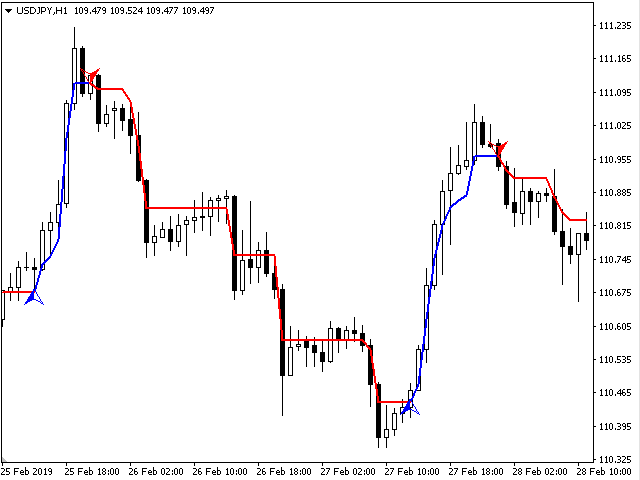
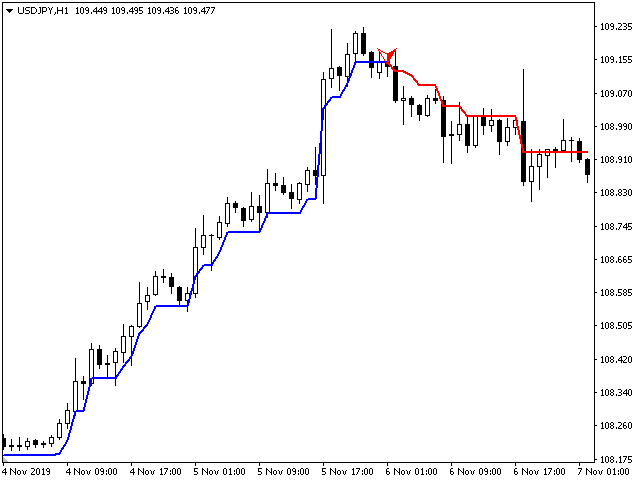
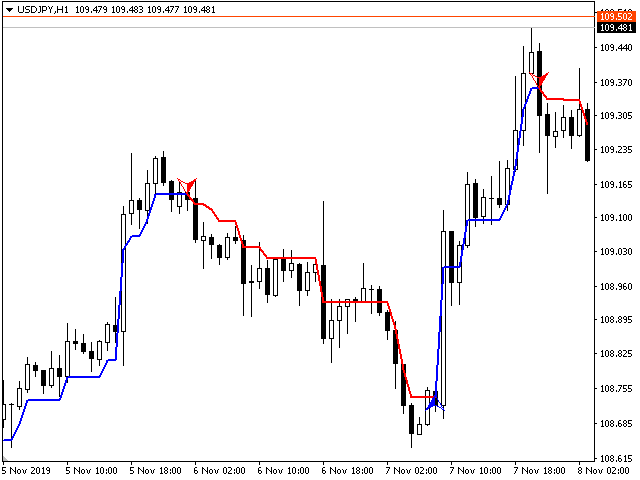
The Beautiful indicator shows potential market reversal points. The intelligent algorithm of the indicator detects the trend well, filters out market noise and generates input signals and exit levels. Uses just one parameter for settings. Simple, visual and efficient trend detection. The indicator does not redraw and does not lag. You can set up message alerts as sound or email. Works on all currency pairs and on all timeframes. Ready-made trading system.
推荐产品
SignalFxPro Breakout — Non-Repainting Indicator Overview: The SignalFxPro Breakout is a non-repainting breakout arrow indicator designed to capture explosive price moves after consolidation. It automatically marks Buy (green arrow) and Sell (red arrow) signals directly on the chart, giving traders a clear and reliable visual cue for potential entries. Key Features Non-Repainting Logic – signals confirmed only on closed bars, ensuring reliability. Dynamic Breakout Detection – identifies
Rectangle Trading Custom   is a powerful technical analysis tool designed for price action and range-based traders. It allows users to define consolidation zones and receive alerts when the price breaks out of these zones or approaches trendlines drawn on the chart. Rectangles and Trendlines will be extended into future with one click. Rectangle point size, name and prices will be displayed around rectangle. Key Features: Draw Trading Zones (Rectangle Zones) Users can manually draw rectangles t
GO Trend MultiTimeFrame
Martin Alejandro Bamonte
GoTrend 多时间框架指标 "GoTrend Multi-Timeframe" 指标是交易员寻求快速高效地评估不同时间框架内货币对整体和具体趋势的必备工具。 此指标允许交易员一目了然地获得市场方向的清晰全面视图,优化决策过程并提高其交易策略的有效性。 主要特点: 多时间框架分析: 此指标提供六个不同时间框架的详尽分析:M5, M15, M30, H1, H4 和 D1,使交易员能够了解每个时间段的趋势。 集成技术指标: 此指标使用五个可靠的技术指标:RSI, SAR, MA, MACD 和 ADX,以确定每个时间框架的趋势方向。 清晰直观的可视化: 信号显示在主图表的选定角落,使用直观的符号和颜色。这使得交易员能够一目了然地评估市场情况。 组合信号: 除了每个指标的单个信号外,"GoTrend Multi-Timeframe" 还提供一个组合信号,总结该货币对的整体市场趋势。 交易优势: 快速清晰的趋势概览: 使用此指标,交易员可以快速清晰地看到多个时间框架内的趋势方向,这对于做出知情且及时的决策至关重要。 优化进出场点: 不同时间框架内的买卖信号帮助交易员优化进出场点,增加交易成
Others
Tatiana Savkevych
The Others indicator is a trend-type indicator. In those moments when you need to make a decision to enter a position and give the trader a direction. The indicator gives the trader the opportunity to visually determine which trend will be present at a particular time interval. These are auxiliary tools for technical analysis of the market. Recommended for use in conjunction with any of the oscillators. The main application of the Others indicator is to generate buy and sell signals. Determini
XFlow4
Maxim Kuznetsov
XFlow shows an expanding price channel that helps determine the trend and the moments of its reversal. It is also used when accompanying transactions to set take profit/stop loss and averages. It has practically no parameters and is very easy to use - just specify an important moment in the history for you and the indicator will calculate the price channel. DISPLAYED LINES ROTATE - a thick solid line. The center of the general price rotation. The price makes wide cyclical movements around the
Targets
Jose Ramon Miranda Ramos
5 (1)
Targets is an indicator to determine potential turning  points , targets  are calculated to determine levels in which the sentiment of the market could change from "bullish" to "bearish." This indicator can be used in any timeframe and any currency pair: IN CASE YOU DON'T SEE THE INDICATOR WHEN YOU ADD IT TO YOUR CHARTS JUST OPEN THE INDICATOR MENU AND CLOSE THE MENU AGAIN PLEASE TAKE NOTICE: For best results use this indicator as an extra tools after you have completed your regular analysis an
FREE
PDP indicator is used for: defining price probability distributions. This allows for a detailed representation of the channel and its borders and forecast the probability of a price appearing at each segment of its fluctuations; defining the channel change moment. Operation principles and features PDP analyzes a quote history on lower timeframes and calculates a price probability distribution on higher ones. Forecast algorithms allow the indicator to calculate probability distributions and mov
Doonchian
Andriy Sydoruk
The Doonchian channel consists of two channel displays. Channel lines are determined by a simple and reliable algorithm. The channel is preferably used for trading inside the channel. The indicator does not redraw and does not lag; simple algorithms are the basis of the work. It works on all currency pairs and on all timeframes. As always a warning, we must not forget that the approach must be comprehensive, the indicator signals require additional information to enter the market.
Godfather
Ivan Simonika
The intelligent algorithm of the Godfather indicator accurately determines the trend, filters out market noise and generates entry and exit levels. The indicator will help in finding entry points when analyzing the price chart. The program first receives a "snapshot" of the graph, then analyzes it. The results are reported to the trader in the form of signals. The main purpose of this indicator is to determine the moments of entries and exits from transactions, so the indicator displays only th
Market Structure Order Block Dashboard MT4 是一款 MetaTrader 4 指标, 专为希望直接在图表上解读市场结构和主要价格反应区域的交易者设计。它结合了 BOS、ChoCH、Order Blocks、Fair Value Gaps (FVG)、流动性、Kill Zones、Volume Profile 和紧凑的仪表盘, 便于快速分析。 本指标面向使用市场结构、ICT 和 Smart Money 概念作为决策框架的交易者。它有助于以更结构化的方式识别趋势延续、可能的反转、价格不平衡、流动性目标和关注区域。 买家专属资源 购买后通过 MQL5 私信即可获取完整的 PDF 用户指南和参数设置建议。通过 MQL5 私信提供直接技术支持。 此 MT4 版本涵盖 MT5 1.20 版本的全部功能: Pending BOS / Pending ChoCH 检测 、 可拖动仪表盘 (按住标题栏可将面板拖到图表任意位置)、 多周期面板 、 Order Block 绩效统计 和 自动风险回报区 。Pending Breaks 在 K 线收盘越过前一摆动点的瞬
The SPV Volatility indicator is one of the most effective filters. Volatility filter. Shows three volatility options. The so-called limit, real, and the last most effective filter for the filter is the percentage filter. Percentage display of folatility shows the ratio of limit to real volatility. And thus, if we trade in the middle of the channel, then it is necessary to set a condition that the percentage is less than a certain indicator value. If we trade on the channel breakout - following t
SmartScalper
Oleg Borisov
5 (2)
The easy-to-use trading system SmartScalper generates the following signals: BUY SELL close BUY close SEEL SmartScalper works on the М15 timeframe and is optimized to work on GBPUSD, XAUUSD, GBPJPY, EURJPY, EURUSD. 12 different sets of trading algorithms are designed for trading (6 buy and 6 sell trades), which can be quickly selected by the trader using buttons in the indicator window, or are set in the input dialog. The efficiency of the trading algorithms chosen by the trader is measured in r
MoveWave
Andriy Sydoruk
MoveWave - Moving waves are very handy indicators for determining pivot levels. Most Forex traders make decisions based on technical analysis. This type of analysis determines patterns and trends in the market. With the help of complex mathematical equations that are combined and made out in the form of this indicator, the trader will be able to more accurately determine the price reversal levels. Wave theory mathematically represents various behavioral models of the market. It is used as the ba
The 4 headed dragon is an indicator that has two functions. 1) Set the background trend. 2) Mark the predominant trend. By combining these two indicator signals, we will be able to trade for or against the trend, adapting the signals to your reading of the market. You can download the demo and test it yourself. 1) Set the background trend.   Define four possibilities of trend that are the four heads of the dragon, marked by colors on the indicator, marking a) Powerful buying trend. b) Weak
Smart Market Analyser
Elias Mtwenge
5 (1)
REMINDER: Early buyers hot price discount: Price subject to rise after first 20 copies. Starting price $65 and final price will be $1275. Secure your discounted copy Now! Smart Money Analyser Indicator User Manual 1. Introduction Welcome to the   Smart Money Analyser Indicator This powerful tool provides traders with comprehensive market analysis by combining various technical indicators to generate actionable trading signals. Designed to be user-friendly, this indicator helps traders of all
TMoney OrderblockDay
Moises Orlando Urbina Sojo
The indicator is triggered at the start of each trading day and detects both bullish and bearish ORDERBLOCK potentials. These levels are of high operational probability, being able to use a minimum ratio of 3 to 1 to maximize profits. It is recommended to use TimeFrame M5 to M30 for a proper display and consider pending orders at the OB levels of the chart and place the SL up to a maximum of 20 pips from the entry price. Submit the indicator to Backtesting to become familiar with its performan
“ Wave Cycle Channel ”指标使用周期振荡指标以及支撑位和阻力位通道来计算价格方向。 该指标能够发现价格走势的转折点,并识别可能的反转点,从而显示市场走势的方向。 可用于确定反转点并寻找入场信号。 指标工作原理 振荡指标的波浪线会根据价格走势进行调整,其构建基于市场波动率以及输入参数中指定的“ Oscillator Period ”周期。 通道围绕振荡指标波动,使振荡指标读数更加平滑。 当振荡指标触及通道的上下边界时,支撑位/阻力位的作用会增加,价格反转的可能性也会增加。 绘制大箭头,红色箭头表示向上反转信号,绿色箭头表示向下反转信号。 如果振荡指标在反转期间未触及通道,则先前设置的信号将继续作用。绘制小箭头。 绘制所有信号箭头后,绘制信号作用点。 该指标适用于任何交易工具和时间框架,建议使用5分钟及以上时间框架。 无需重新绘制读数即可运行,所有信号箭头均出现在K线收盘价。 提供多种警报类型。 该指标将通过直观的价格行为显示和潜在信号的识别,补充趋势策略。
The Sentiment Ratio indicator gauges current Market Sentiment between -100% and 100%, where lower than -40% is considered Bearish and higher than 40% is Bullish. The channel between the two is considered Neutral. The indicator has been a very useful filter tool for signals within a trading system. Example call function:  int SentimentIndicator(double triggerLevel)//Return sentiment if trigger level is activated {   double sentimentRatio=iCustom(NULL,0,"Sentiment Ratio",0,0,0);   if(sentimentRat
FREE
Smart Channels
Ivan Simonika
Smart Channel is a non-redrawing channel indicator based on moving averages. The indicator is used to identify trends in financial markets and indicates the direction of price movement. Smart Channel, in fact, is a miniature trading strategy, since, regardless of the construction methods, it uses the tactics of rebounding from the boundaries of the built channel, and the boundaries themselves are used as guidelines for the correct placement of stop loss and take profit orders. The key differe
Macro
Andriy Sydoruk
A simple indicator algorithm with the highest accuracy generates input signals by intersecting lines. Strategy for trading by trend, filtering and all the necessary functions built into one tool! The principle of the indicator is to automatically determine the current state of the market when it is placed on a chart, analyze historical data, based on historical data and display instructions to the trader for further actions. The system itself shows in the form of intersection of lines when to bu
Retracement Pip Catcher
Christopher Graham Parish
!! FLASH SALE !!   Over 80% off !!     For ONE week only. Now only $47 - normally $297! >>>      Ends on 30 June 2023 - Don't miss it! Buy and Sell Arrows when price is about to retrace. It Also Sends Alerts – On MT4 To Your Phone To Your Email Does not repaint. Works ony any pair, any timeframe. 10 Activations allowed so you are free from limitations See an example of alerts from today (23 May 2020) using this and 2 more of my indicators  here . MT5 Version here . Spreads from 0.1pip RAW
Fibonacci BB Breakout Indicator is a powerful MT4 tool that automatically detects Bollinger Bands breakouts and draws Fibonacci extension levels as trend lines on your chart. It simplifies trading by highlighting potential support, resistance, and target zones after strong moves, with customizable alerts and an info panel for quick status checks.  Key Features - Automatic Breakout Detection: Spots bullish (price closes above upper BB) or bearish (below lower BB) breakouts on the previous close
Pacific Breakout
Anton Karabeinikov
"PACIFIC BREAKOUT" — Catch a Wave of Profit on Breakouts of Sessions!   Are You Tired Of Missing Key Breakouts? Manual calculation of levels, dozens of indicators and missed signals will be a thing of the past!   What Does Pacific Breakout Do? This is your personal analytical robot that: The pulse accumulation range of the Pacific session is automatically determined (1:00 GMT+3 Sydney).  - We analyze the second candle after the market opens, because the extended spread does not giv
Multiphase
Ivan Simonika
Multiphase is a non-redrawing channel indicator based on moving averages. The key difference between the Multiphase indicator and other channel indicators (for example, from the same Bollinger Band) is that Multiphase takes into account not simple moving averages, but double-smoothed ones, which, on the one hand, makes it possible to more clearly determine the market movement, but, with on the other hand, it makes the indicator less sensitive.
Introduction This indicator detects volume spread patterns for buy and sell opportunity. The patterns include demand and supply patterns. You might use each pattern for trading. However, these patterns are best used to detect the demand zone (=accumulation area) and supply zone (=distribution area). Demand pattern indicates generally potential buying opportunity. Supply pattern indicates generally potential selling opportunity. These are the underlying patterns rather than direct price action. T
[ MT5 Version ]  [ Kill Zones ]  [ SMT Divergences ] How to trade using Order Blocks:  Click here User Interface Performance:  During testing in the strategy tester, the UI may experience lag. Rest assured, this issue is specific to the testing environment and does not affect the indicator's performance in live trading. Elevate your trading strategy with the  Order Blocks ICT Multi TF  indicator, a cutting-edge tool designed to enhance your trading decisions through advanced order block analys
PrecisionCore Arrows
Cosmas Akamadu Nwachukwu
This indicator gives fewer signals but precise when it does. Its a little scaled down version of ControlEdge Fx indicator , that gives less number of signal with less precise. If you want one the gives more signals and more accurate in catching larger trends you might want to check out ControlEdge Fx in this link  https://www.mql5.com/en/market/product/175731 Enter Buy when the Blue Arrow appears  Exit Buy when the Red X sign appears Enter Sell when the Red Arrow Appears    Exit Sell when the
FREE
The indicator is the main part of Michael Huddleston's ICT (Inner Circle Trader) trading strategy. His legendary trading strategy is based on the concept of "Smart Money". To analyze the medium -term trend , the  ICT offers an analysis based on  twenty -day levels . The indicator builds levels , while showing the turning points with arrows . An important feature of the indicator is the automatic display of levels for different periods . You do not have to change the indicator settings when chang
Market Profile
Artem Titarenko
5 (1)
The "Market Profile" indicator displays the profiles and volumes of periods – weekly, daily, session (8-hour), 4-hour, hour, summary. The VAH/VAL price area is automatically highlighted by a dotted line for each profile (except for the summary). The indicator includes chroma Delta, which colors the profile areas. The areas of prevailing Buys is colored in green, that of Sells - in red. The intensity histogram features blue/red respectively. In the filter mode, the indicator displays the volume a
Hammer Shooting Star v1.1 – Advanced Candlestick Pattern Scanner Author: LIANG1990 Are you searching for a reliable tool to identify market reversals with precision? Hammer Shooting Star v1.1  is a professional MT4 indicator designed to scan and detect high-quality Hammer and Shooting Star candlestick formations. Unlike basic pattern indicators, this tool applies multiple built-in filters (shape, size, trend alignment, and contextual conditions) to reduce false signals and highlight only the cle
该产品的买家也购买
Genesis Matrix Pro is a professional multi-timeframe trend detection indicator designed to help traders identify high-quality market alignment with clarity and structure. It combines 12 different technical indicators into one visual alignment matrix, allowing traders to quickly see when market conditions are bullish, bearish, or neutral. A signal is generated only when the selected strategies are aligned, helping reduce noise and improve decision-making. PLEASE CONTACT ME AFTER PURCHASE TO GET
The Propfolio Master Suite is the ultimate all-in-one analytical workstation for professional traders. Combining the power of the Beat The Market Maker (BTMM) methodology, Smart Money Concepts (SND/Liquidity), and Advanced Volume Profile, this suite replaces multiple different indicators with one optimized engine. Monitor up to 14 pairs simultaneously from a single chart, instantly identify market cycles, and seamlessly map institutional footprints with the click of a button. The Command Center
Scalper Inside PRO
Alexey Minkov
4.74 (69)
Scalper Inside PRO Scalper Inside PRO 是一款适用于 MetaTrader 4 的日内趋势与剥头皮指标,使用专有算法快速识别市场方向和关键目标价位。它能够自动计算进场价、出场价以及多级止盈目标,并显示详细的绩效统计,让您了解不同交易品种和策略以往的表现情况,从而帮助您为当前的市场环境选择最合适的交易工具。此外,您还可以将自己的箭头指标轻松接入 Scalper Inside PRO,快速评估其统计数据和历史表现。 该指标可用于任何交易品种和任何周期(建议在 M5 上进行日内交易),并内置多种交易策略,因此既可以作为独立的剥头皮工具使用,也可以作为您交易系统中功能强大的分析组件。 主要功能 通过专有算法(Next‑Generation Trend Detection Algorithm,NG TDA)快速识别当前市场趋势。 自动计算日内交易的进场价、出场价和多级止盈目标。 内置策略与统计模块,用于评估不同市场环境下各品种的表现。 支持接入自定义箭头指标(PRO 模式),并计算其详细信号统计数据。 适用于外汇、金属、指数、股票、商品、期货和加密货币等各类市
PRO Renko System
Oleg Rodin
5 (30)
PRO Renko Arrow Based System for trading renko charts.  准确的信号交易任何外汇工具. 另外,我将免费提供系统的附加模块! PRO Renko系统是RENKO图表上高度准确的交易系统。该系统是通用的。 该交易系统可应用于各种交易工具。 该系统有效地中和了所谓的市场噪音,打开了获得准确反转信号的通道。 该指标易于使用,只有一个参数负责产生信号。 您可以很容易地使算法适应您感兴趣的交易工具和renko酒吧的大小。 我很乐意通过提供任何咨询支持来帮助所有客户有效地使用该指标。 祝您交易成功!购买后,立即写信给我! 我将与您分享我的建议和我的renko发电机。 另外,我将免费提供系统的附加模块!
NAM Order Blocks
NAM TECH GROUP, CORP.
3.67 (3)
MT4多時限訂單塊檢測指示器。 特徵 -在圖表控制面板上完全可自定義,提供完整的交互。 -隨時隨地隱藏和顯示控制面板。 -在多個時間範圍內檢測OB。 -選擇要顯示的OB數量。 -不同的OB用戶界面。 -OB上的不同過濾器。 -OB接近警報。 -ADR高低線。 -通知服務(屏幕警報|推送通知)。 概括 訂單塊是一種市場行為,它指示從金融機構和銀行收取訂單。著名的金融機構和中央銀行帶動了外匯市場。因此,交易者必須知道他們在市場上正在做什麼。當市場建立訂單塊時,它會像發生大多數投資決策的範圍一樣移動。 訂單建立完成後,市場將朝著上升和縮小的方向發展。訂單大宗交易策略的關鍵術語是它包括機構交易者正在做的事情。由於它們是主要的價格驅動因素,因此包括機構交易在內的任何策略都可以。 您將在任何時間範圍內實時看到訂單塊,使用我們的控制面板,您將能夠在所選的歷史記錄週期內檢測常規,拒收和未大寫的訂單塊。 現在您可以接收到訂單塊接近警報,我們在MT4上顯示屏幕通知,並將通知推送到您的手機!
Quants HL Break
Ferhat Mutlu
5 (2)
通過純價格行為進行高級計算,以找到 LH 和 HL 突破。 它會給你一個很好的市場反轉點。 LH 和 HL 信號也可用於 traingle 突破。 一旦突破發生,則表明強烈反轉。 移動平均線的漂亮過濾器。 我強烈建議將其與趨勢指標一起使用。 可用作支撐和阻力、供需指標的額外確認。 可以在以下外匯線程中找到更多詳細信息: 該指標未重新繪製。 Buffers :   SetIndexBuffer ( 0 ,UpBar);      SetIndexBuffer ( 1 ,UpBar2);           SetIndexBuffer ( 2 ,DnBar);      SetIndexBuffer ( 3 ,DnBar2);           SetIndexBuffer ( 4 ,UpBarTop);      SetIndexBuffer ( 5 ,UpBarLow);                    SetIndexBuffer ( 6 ,DnBarTop);      SetIndexBuffer ( 7 ,DnBarLow);           SetIn
Dynamic Forex28 Navigator
Bernhard Schweigert
4.43 (7)
Dynamic Forex28 Navigator - 下一代外汇交易工具。 当前 49% 折扣。 Dynamic Forex28 Navigator 是我们长期流行的指标的演变,将三种功能合二为一: 高级货币强度 28 指标 (695 条评论)+ 高级货币 IMPULSE 带警报 (520 条评论)+ CS28 组合信号(奖励)。 有关指标的详细信息 https://www.mql5.com/en/blogs/post/758844 下一代强度指标提供什么? 您喜欢的原始指标的一切,现在通过新功能和更高的精度进行了增强。 主要特点: 专有货币强度公式。  所有时间范围内的平滑和准确的强度线。 非常适合识别趋势和精确进入。 动态市场斐波那契水平(市场斐波那契)。  此指标独有的独特功能。 斐波那契应用于货币强度,而不是价格图表。 适应实时市场活动以获得准确的反转区域。 实时市场动量。  第 9 行显示市场是活跃还是被动。 对于定时交易至关重要。 全面的警报和显示。  每种货币最强的买入和卖出动量。 ​​28 对的双重动量买入和卖出。 超买/超卖警告外部范围和止损。 反转
PZ Harmonacci Patterns
PZ TRADING SLU
3.17 (6)
可以说,这是您可以为MetaTrader平台找到的最完整的谐波价格形成自动识别指标。它检测19种不同的模式,像您一样认真对待斐波那契投影,显示潜在的反转区域(PRZ),并找到合适的止损和获利水平。 [ 安装指南 | 更新指南 | 故障排除 | 常见问题 | 所有产品 ] 它检测19种不同的谐波价格形态 它绘制了主要,衍生和互补的斐波那契投影(PRZ) 它评估过去的价格走势并显示每个过去的形态 该指标分析其自身的质量和性能 它显示合适的止损和获利水平 它使用突破来表明合适的交易 它在图表上绘制所有样式比率 它实现了电子邮件/声音/视觉警报 受斯科特·M·卡尼(Scott M. Carney)的书的启发,该指标旨在满足最纯粹和最熟练的交易者的需求。但是,它采取了一种使交易更容易的方式:在向交易发出信号之前,它会等待Donchian朝正确方向突破,从而使交易信号非常可靠。 斐波那契投影与向量无关 它实现了电子邮件/声音/推送警报 它绘制了ABCD投影 重要提示: 为了符合 Scott M. Carney先生 的商标申诉,某些图案名称已重命名为不言自明的替代方式, Scott M.
RFI levels PRO
Roman Podpora
5 (1)
该指标能够准确显示反转点和价格回落区域。     行业领军人物 。您能洞察新趋势的形成,并以最高的精准度做出决策,掌控每一笔交易。 与……结合时,展现其最大潜力     趋势线专业版   指标  VERSION MT5 该指标显示的内容: 新趋势开始时的反转结构和反转水平及其激活。 显示屏   获利了结   和   止损   风险回报比最低的水平     RR 1:2       。 具有智能减值逻辑的止损。 显示指定指标中两种趋势类型的反转形态。 指标: 根据     趋势线     (全球趋势变化) 潮流专业版     (趋势快速变化) 简单有效   扫描器   实时趋势(新增)。 多时间框架工具筛选。 展示   利润   在 LOGIC AI 信号之后。 以下列出今日走势积极的金融工具。(RB键) 能够为终端启用通知(警报)功能,并向移动设备推送通知。 逻辑人工智能     — 利用人工智能寻找最佳切入点。 只有在启用 MTF(多时间框架分析)模式时,该功能才可用。 兼容性。 当与趋势线指标结合使用时,该指标能发挥其最大潜力。 这     RFI LEVELS PRO    
Trend Catcher ind
Ramil Minniakhmetov
趨勢捕捉指標 趨勢捕捉指標結合了作者獨有的客製化自適應趨勢分析指標,用於分析市場價格趨勢。它透過過濾掉短期噪音,並專注於潛在的動能強度、波動性擴張和價格結構行為,來識別真實的市場方向。此外,它還結合了平滑和趨勢過濾等客製化指標,例如移動平均線、相對強弱指標 (RSI) 和波動率過濾器。 您可以在這裡查看實際運行情況以及我的其他產品: https://www.mql5.com/en/users/mechanic/seller 請注意,我不會在 Telegram 上出售 EA 或任何設置,那是騙局。所有設定都可以在我的部落格上免費取得。 重要提示!購買後請立即聯繫我,以獲取使用說明和額外獎勵! 請注意,我不會在 Telegram 上出售 EA 或任何設置,那是騙局。所有設定都可以在我的部落格上免費取得。
Grabber System
Ihor Otkydach
5 (2)
向您介绍一款优秀的技术指标——Grabber,它是一套即开即用的“全包式”交易策略。 在一个代码中集成了强大的市场技术分析工具、交易信号(箭头)、提醒功能和推送通知。 每位购买该指标的用户还可免费获得以下内容: Grabber辅助工具:用于自动管理已开仓位 视频操作指南:逐步教学如何安装、设置和使用该指标进行交易 原创Set文件:可快速自动配置,帮助实现最佳交易效果 忘掉其他策略吧!只有Grabber能够真正激励你在交易中攀登新高峰! Grabber策略的主要特点: 交易周期:从M5到H4 适用资产:任意,但我推荐我亲自测试过的品种(GBPUSD、GBPCAD、GBPCHF、AUDCAD、AUDUSD、AUDSGD、AUDCHF、NZDUSD、NZDCAD、EURCAD、EURUSD、EURAUD、EURGBP、EURCHF、USDCAD、USDSGD) 交易时间:全天候 24/7 交易类型:波段交易(反转系统)
GoldRush Trend Arrow Signal
Kirk Lee Holloway
5 (2)
GoldRush 趨勢箭頭信號 GoldRush 趨勢箭頭信號 指標為 XAU/USD 中的高速、短期短線交易者提供精確、實時的趨勢分析。 專為1分鐘時間框架設計,此工具顯示方向箭頭以明確顯示入場點,使短線交易者能在波動市場中自信操作。 該指標包含主要和次要警示箭頭。主要信號為白色和黑色方向箭頭,用於指示趨勢方向的轉變;次要信號為藍色和紅色箭頭,用於確認主要箭頭指示的方向並提示潛在交易入場點。 注意:當趨勢方向發生變化後僅出現一個主要警報箭頭時,請注意可能會出現多個次要藍/紅箭頭。次要信號將在滿足信號標準的任何蠟燭圖後出現,因此在長期趨勢移動中,螢幕上將顯示大量次要箭頭(如附帶的截圖所示)。您可在設置中開啟或關閉任一箭頭類型。 以下是我使用此指標進行交易的方式: - 對於買入入場,我會耐心等待白箭頭在蠟燭收盤時出現,並在下一根可用蠟燭收盤時出現藍箭頭時進行買入交易。 - 對於賣出入場,我會耐心等待黑箭頭在蠟燭收盤時出現,並在下一根可用蠟燭收盤時出現紅箭頭時進行賣出交易。 - 獲利了結/止損設置由使用者自行負責,但我個人使用最低R:R為1:2,並發現這在倫敦/紐約開盤等
Introduction to Fractal Pattern Scanner Fractal Indicator refers to the technical indicator that makes use of the fractal geometry found in the financial market. Fractal Pattern Scanner is the advanced Fractal Indicator that brings the latest trading technology after the extensive research and development work in the fractal geometry in the financial market. The most important feature in Fractal Pattern Scanner is the ability to measure the turning point probability as well as the trend probabi
Advanced Currency Strength28 Indicator
Bernhard Schweigert
4.91 (657)
目前40%的折扣 任何新手或专家交易者的最佳解决方案! 这个指标是一个独特的、高质量的、可负担得起的交易工具,因为我们纳入了一些专有的功能和一个新的公式。只需一个图表,你就可以读出28个外汇对的货币强度!想象一下,你的交易将如何得到改善,因为你的交易是在你的手中进行的。想象一下,你的交易将如何改善,因为你能够准确地确定新趋势或剥头皮机会的触发点? 用户手册:点击这里  https://www.mql5.com/en/blogs/post/697384 这是第一本,原版的! 不要买一个毫无价值的崇拜者的克隆品。 特别的 子窗口中的箭头显示强劲的货币势头GAP将指导你的交易! 当基础货币或报价货币处于超卖/超买区域(外盘斐波那契水平)时,在个人图表的主窗口中出现警告信号。 当货币力量从外围区间回落时,回撤/反转警报。 十字星模式的特别警报 可选择多个时间框架,以快速查看趋势! 货币强度线在所有的时间框架中都非常平稳,当使用较高的时间框架来识别总体趋势,然后使用较短的时间框架来确定精确的入口时,效果非常好。你可以根据自己的意愿选择任何时间框架。每个时间框架都由其自身进行了优化。
Advanced Supply Demand
Bernhard Schweigert
4.91 (300)
现在优惠 40%! 任何新手或专业交易者的最佳解决方案! 该指标是一款独特、高质量、且价格合理的交易工具,因为我们已经整合了许多专有功能和新公式。 依据此更新,您将能够显示双重时间帧区域。 您不仅可以显示一个较高的时间帧,还可以同时显示图表时间帧,加上更高的时间帧:显示嵌套时区。 供需双方所有交易者都会喜欢它。 :) 重要信息披露 高级供需的最大潜力,请访问 https://www.mql5.com/zh/blogs/post/720245   想象您的交易如何得以改善,是因为您能够精准定位入场或目标位吗? 构建于新的底层算法,它可以更轻松地识别出买卖双方之间的潜在失衡。 这是因为它以图形方式展示供需最强劲区域,及其过去的表现(显示旧区域)。 这些功能旨在帮助您更轻松地发现最佳入场区域和价位。 现在您可以针对您的交易品种和时间帧来优化和编辑区域强度! 高级供需指标适用于所有产品和时间帧。 它是一个新的公式,非常新的功能是两个区域强度函数可由用户输入进行调整! 这在交易中是一大优势。 当您学习如何使用专有功能,例如带有价格游离最小 X 因子的区域强度时,您能够判断该区域强劲与否。 供需
Market Structure Patterns MT4
Samuel Manoel De Souza
5 (18)
Market Structure Patterns   is an indicator based on   smart money concepts   that displays   SMC/ICT   elements that can take your trading decisions to the next level. Take advantage of the   alerts ,   push notifications   and   email messages   to keep informed from when an element is formed on the chart, the price crosses a level and/or enters in a box/zone. Developers can access the values of the elements of the indicator using the   global variables  what allows the automation of trading d
Advanced UT BOT ALERTS for MT4 專業多重濾波趨勢識別系統|強化版 UT BOT 引擎 我們只提供高品質的指標。 Advanced UT BOT 為專業交易者設計,採用穩定的信號邏輯與安全運算結構,確保無延遲與錯誤更新。 它 不會重繪、不會重畫、不會刪除或修改 任何過去的信號。 所有 BUY 和 SELL 信號均在 K 線收盤後生成並固定 ,確保穩定性與準確性。 在即時行情中 不會重繪 ,信號會在收盤後即時出現。 限時優惠中 —— 下一次價格將調整為 49 美元。 請把握現在的優惠價格,售完即漲。 產品概述 Advanced UT BOT ALERTS   是新一代的趨勢信號系統,基於   UT BOT   的核心邏輯重新打造, 全面升級為 MT5 版本,融合多重濾波、動態視覺化與高精度警報系統。 UT Bot 指標最初由   Yo_adriiiiaan   開發,本版本由   PioneerAlgoFX   團隊深度強化, 在穩定性、精準度與自訂性方面均達到專業級水準,為實戰交易者而設計。 此系統能夠高精準地識別趨勢反轉與動能變化, 透過多層動態濾波與
购买后请联系我,获取基于此指标的奖励EA。 Self Optimizing Double MA Strategy 是一款专业级别的交易工具,旨在消除参数猜测。它由内置的自动优化引擎驱动,通过在后台模拟数千种参数组合,不断适应不断变化的市场条件,从而保持统计上的优势。 该指标不依赖于静态、过时的设置,而是动态更新其内部逻辑,为当前的时间周期和交易品种寻找最赚钱的配置。 核心功能 内置自动优化:系统会根据您选择的更新频率,定期重新计算快速 MA、慢速 MA 和 RSI 的周期,确保您的设置始终与当前的市场节奏保持一致。 MA 发散过滤器:一项核心的趋势强度指标,仅在移动平均线积极发散时才确认信号的有效性。这可以防止在均线收敛或平缓的盘整市场中产生虚假的入场信号。 时序评分引擎:内部模拟器在图表上绘制任何实时信号之前,会根据您的具体目标(例如最大化利润因子或最小化回撤)对历史信号进行评估。 动态 ATR 区域:根据实时市场波动率,自动计算并在图表上直观地投射出止盈和止损区域。 实时绩效仪表板:直接在您的图表上跟踪并显示实时的系统指标,包括历史胜率、平均回撤以及产生的总点数。 完美支持 EA
如果您进行外汇交易,了解货币强弱和货币对相关性等详细信息,可以让您的交易更上一层楼。通过相关性分析,您可以将风险减半,而强弱分析将帮助您最大化利润。 本指标通过结合货币强弱分析和货币对相关性,提供了一种混合的方法,帮助选择最合适的货币对进行交易。 如何使用货币强弱分析 假设您的交易策略在AUD/JPY上提供了买入机会,但通过KT货币强弱分析发现JPY比AUD更强。那么,这笔交易很可能以亏损告终。有了这个指标,您可以轻松避免此类亏损。 如何使用货币对相关性 假设您的交易策略同时在NZD/USD和GBP/JPY上提供了卖出机会。通过KT货币对相关性功能,您发现这两个货币对的相关性达到77%。  由于这些货币对高度相关,同时交易它们只会加倍您的风险。如果在NZD/USD上出现亏损,GBP/JPY上的交易也很有可能出现亏损。 功能特点 快速识别最强和最弱货币,用以验证交易策略生成的交易机会。 通过避免交易高度相关的货币对,将风险降低一半甚至三分之一。 当某个货币成为最强或最弱时,接收警报通知。 通过货币金字塔分析强弱报告,将货币按强到弱进行排序。 详细了解货币强弱分析 货币强弱分析通
KURAMA GOLD SIGNAL PRO(MT4版)— 7层过滤器、自动TP/SL、品质评分搭载 XAUUSD完整交易系统 不重绘。不重画。不延迟。每个信号永久固定。所见即所得。 福利:购买买断版许可证可免费获得 AI Zone Radar(价值$59)+ 完整PDF手册。购买后请给我发消息。 AI Zone Radar: https://www.mql5.com/en/market/product/175834 交易员的信赖:已被活跃的黄金交易员社区使用。因精度和易用性获得赞誉。 你的问题 — 以及解决方案 你知道黄金每天波动$30-50。你知道这里有钱可赚。但是: - 入场过早,价格反向$10后才朝你的方向走 - 每次MA触碰都入场,结果一半都失败 - 没有TP/SL系统,所以持仓太久或离场太早 - 在死寂时段交易,然后想为什么什么都不顺 KURAMA GOLD SIGNAL PRO解决了这一切。不是用一个过滤器,而是七个。 工作原理 — 3步 1. 图表上出现箭头信号 2. 在面板上查看TP价格、SL价格、品质评分、风险回报比 3. 下单并等待 无
Dynamic Scalper System
Vitalyi Belyh
5 (1)
“ Dynamic Scalper System ”指标专为在趋势波内进行剥头皮交易而设计。 已在主要货币对和黄金上进行测试,并可与其他交易工具兼容。 提供顺势短线建仓信号,并提供额外的价格变动支持。 指标原理: 大箭头决定趋势方向。 在趋势波内,我们采用一种生成小箭头形式的剥头皮交易信号的算法。 红色箭头代表看涨方向,蓝色箭头代表看跌方向。 敏感的价格变动线会沿着趋势方向绘制,并与小箭头信号协同作用。 信号运作方式如下:当线在适当时刻出现时,将形成入场信号;在出现线时,持仓;线完成后,平仓。 建议的操作时间范围为M1 - H4。 箭头在当前K线上方形成,如果下一根K线已开仓,则不会重新绘制上一根K线上方的箭头。 输入参数 Trend Wave Period - 趋势方向(大箭头)的周期,改变趋势波的时间间隔。值 1 表示趋势方向的最长持续时间,参数值越大,持续时间越短。 Scalper Arrows Period - 信号箭头(小箭头)的计算周期,改变入场信号的生成频率。值 3 表示最频繁的生成频率,参数值越大,箭头频率越低,准确度越高。 这些参数可以根据不同的时间范
头肩形态是一种图表形式,类似于具有三个峰的基线,外部两个峰的高度接近,中间峰最高。它可以预测牛市到牛市的趋势反转,并且被认为是最可靠的趋势反转模式之一。它是几种顶部模式之一,以不同程度的准确性发出趋势即将结束的信号。 [ 安装指南 | 更新指南 | 故障排除 | 常见问题 | 所有产品 ] 清除交易信号 可自定义的颜色和尺寸 实施绩效统计 可定制的斐波那契回撤水平 显示适当的止损和获利水平 该指标可用于查找连续或反转形态 它是不可重涂和不可重涂的 它实现了电子邮件/声音/视觉警报 设置 将指标加载到任何图表时,将显示一组选项作为输入参数。如果您认为它们太多,请不要感到失望,因为参数被分组为不言自明的块。这就是每个参数块的作用。 幅度-幅度表示替代价格点之间的最小柱线量。要找到大图案,请增加幅度参数。要查找较小的模式,请减小幅度参数。您可以在图表中多次加载具有不同幅度的指标。 闵。回撤-形态中所需的最小斐波那契回撤。设置为零不对其进行评估。 最大。回撤-形态中可能的最大斐波那契回撤。设置为零不对其进行评估。 领口扁平率-此参数描述图案领口必须如何“平坦”。 最大历史柱线-指标在图
PZ Double Top Bottom
PZ TRADING SLU
5 (1)
该指标找到双顶和双底反转形态,并使用突破引发交易信号。 [ 安装指南 | 更新指南 | 故障排除 | 常见问题 | 所有产品 ] 清除交易信号 可自定义的颜色和尺寸 实施绩效统计 可定制的斐波那契回撤水平 它显示合适的止损和获利水平 它实现了电子邮件/声音/视觉警报 这些图案可以扩展,并且指示器通过重新绘制跟随图案。但是,该指标采用了一种扭曲方式,以使其更容易交易:它在向交易发出信号之前等待Donchian突破,然后发出交易信号,使其信号非常可靠,并且几乎没有重涂。 输入参数 幅度:幅度表示替代价格点之间的最小柱线量。要找到大图案,请增加幅度参数。要查找较小的模式,请减小幅度参数。 闵。回撤:形态中所需的最小斐波那契回撤。 最大。回撤:形态中可能的最大斐波那契回撤。 最大历史柱数:指标在图表中加载时要评估的过去柱数。 显示统计信息:显示或隐藏统计信息显示板和效果数据。 显示SL / TP电平:显示或隐藏每个信号的合适的止损和获利水平。 绘图选项:看涨或看跌的线条和标签的颜色和大小以及字体大小。 突破:突破箭头的颜色和大小。 警报:启用或禁用各种警报。 作者 Arturo
Cyclic Impulse
Vitalyi Belyh
构建图表并识别周期性价格变动的技术指标。 可以在任何图表上工作。 几种类型的通知。 图表本身还有额外的箭头。 无需重新绘制历史记录,只需关闭蜡烛即可。 建议使用 M5 及以上的 TF。 易于使用和配置参数。 当使用 2 个具有不同参数的指标时,您可以单独使用它们,而无需其他指标。 有 2 个输入参数 周期性和信号持续时间 这两个参数处理图表结构的处理。 Cyclicity 调节反转周期的变化频率,平滑周期。 Signal duration 为最小数字,检测价格变动中的脉冲,最大长期趋势变动。    ---------------------------------------------------------------------------------------
KuKl
IGOR KIRIANEN
The indicator is built on a non-standard Zig Zag, it draws accumulations after which if the price leaves this zone and a test of this zone occurs, then a sound signal is given and an arrow appears - after the test candle closes.The indicator does not redraw its signals, it is very easy to use, there are only three settings 1- this is the zig zag parameter 2- this is the minimum price exit from the zone 3- this is the maximum price exit from the zone. The lower the parameter for Zig Zag, the more
购买此指标即可免费获得我的专业交易管理器。 首先,值得强调的是,这个交易系统是一个非重绘、非重画和非滞后的指标,这使得它非常适合手动和机器人交易。 在线课程,手册和下载预设。 “智能趋势交易系统 MT5”是专为新手和经验丰富的交易者量身定制的综合交易解决方案。它结合了超过 10 个优质指标,具有 7 多个强大的交易策略,使其成为适用于各种市场条件的多功能选择。 趋势跟随策略:提供精确的入场和止损管理,以有效地跟随趋势。 反转策略:识别潜在的趋势反转,使交易者能够利用区域市场的机会。 剃头策略:专为快速准确的日内交易和短期交易而设计。 稳定性:所有指标都不会重绘、不会重画和不会滞后,确保可靠的信号。 定制:支持自定义策略,以满足个人交易偏好。超过 7 种策略和组合可帮助您找到最佳策略。 信号清晰度:提供箭头信号,以指示清晰的入场和退出点。 实时警报:通过交易进出警报使交易者保持了解。 深入分析:提供更高时间框架的趋势分析和实时交易监控。 自适应颜色编码:利用蜡烛颜色编码来显示成交量、趋势和反转蜡烛信号。通过蜡烛颜色分析市场方向。 “智能趋势交易系统 MT5”赋予交易者必要的工具,以便在
The Super Arrow Indicator provides non-repainting buy and sell signals with exceptional accuracy. Key Features No repainting – confirmed signals remain fixed Clear visual arrows: green for buy, red for sell Real-time alerts via pop-up, sound, and optional email Clean chart view with no unnecessary clutter Works on all markets: Forex, gold, oil, indices, crypto Adjustable Parameters TimeFrame Default: "current time frame" Function: Sets the time frame for indicator calculation Options: Can be set
Advanced Currency IMPULSE with ALERT
Bernhard Schweigert
4.9 (490)
目前40%的折扣!! 对任何新手或专家交易者来说都是最好的解决方案! 这个指标是一个独特的、高质量的、负担得起的交易工具,因为我们已经纳入了一些专有的功能和一个秘密的公式。只需一张图表,它就能给出所有28种货币对的警报。想象一下,你的交易将如何改善,因为你能够准确地确定新趋势或剥头皮机会的触发点 建立在新的基础算法上,它使识别和确认潜在交易变得更加容易。这是因为它以图形方式显示了一种货币的强势或弱势是否正在加速,并测量了这种加速的速度--把它想象成你汽车中的速度表。当你加速时,事情显然会发生得更快,这在外汇市场上也是一样的,即如果你配对的货币正在向相反的方向加速,你就会发现一个潜在的有利可图的交易。 货币动量的垂直线和箭头将指导你的交易! 动态的市场斐波那契23水平被用作警报触发器,将适应市场活动。如果冲动触及黄色触发线,您将在MetaTrader或您的电子邮件或推送警报中收到警报。然后你就知道作为一个交易员应该做什么。货币对和方向已经给出。只要点击警报按钮,就可以切换到该货币对或打开一个新的图表,以便进一步分析。警报级别可以通过用户输入来改变,可以选择3个敏感度级别。 尽
Atomic Analyst
Issam Kassas
5 (6)
首先值得强调的是,该交易指标是非重绘、非延迟的指标,这使其成为手动和机器人交易的理想选择。 用户手册:设置、输入和策略。 Atomic Analyst是一种PA价格行动指标,利用价格的力量和动量来寻找市场上更好的机会。配备了高级过滤器,可帮助去除噪音和假信号,并提高交易潜力。使用多层复杂的指标,Atomic Analyst扫描图表,并将复杂的数学计算转化为任何初学者都能理解并用来做出一致交易决策的简单信号和颜色。 “Atomic Analyst”是专为新手和经验丰富的交易者量身定制的综合交易解决方案。它将高级指标和一流功能融合为一体的交易策略,使其成为所有类型交易者的多功能选择。 日内交易和剥头皮策略:专为快速准确的日内交易和短期交易而设计。 日内和摆动交易策略:可用作追求价格大幅波动的日内和摆动交易者的可靠工具。 多货币和市场:凭借其可靠的精度,在不同的工具和市场上运作。 多个时间框架:可在多个时间框架上使用,性能良好。 稳定性:所有指标均不重绘、不重绘和不滞后,确保可靠的信号。 信号清晰度:提供箭头信号,用于清晰的入场和出场点。 实时警报:通过交易入场、SL和TP警报通知交易者
NAM Divergences
NAM TECH GROUP, CORP.
5 (1)
MT4多時限發散和超買/超賣檢測指標。 特徵 -在圖表控制面板上完全可自定義,提供完整的交互。 -隨時隨地隱藏和顯示控制面板。 -有關非大寫差異的實時信息。 -有關超買/超賣情況的實時信息。 -有關規則差異的實時信息。 -有關隱藏分歧的實時信息。 -可用於發散檢測的振盪器:AO,RSI,CCI,MACD,STOCH,RMI,TDI,RSIOMA。 -通知服務(屏幕警報|推送通知)。 概括 使用差異交易有助於發現趨勢減弱或勢頭逆轉。有時,您甚至可以將其用作趨勢持續的信號。我們的工具在一個非常舒適和直觀的控制面板中同時提供所有時間範圍的差異檢測,並具有顯示和隱藏的可能性,以使您的圖表盡可能保持清潔。 您會在選擇的歷史時期實時看到超買和超賣情況,定期背離,隱藏背離和無資本背離。 對於沒有大寫字母的差異,我們會在屏幕上顯示MT4通知,並將通知推送到您的手機!
作者的更多信息
Smart Analiz
Tatiana Savkevych
Working with the Smart Analiz indicator is very simple - you just react to the arrows that the indicator reflects, that is, the arrow is a command for action. The indicator signals are accurate enough and you can trade using this information! The indicator builds a very high-quality channel in which it generates entry signals! Which is the ideal strategy for a trader as the trader is always hesitant when choosing a strategy to work with. That is, this indicator will allow you to solve the dilemm
Arrows Forecasters
Tatiana Savkevych
The Arrows Forecasters indicator is simple, visual and effective trend detection. The intelligent algorithm of the indicator determines the trend with a good probability. Uses just one parameter for settings. The indicator shows the points of potential market reversal. Ready-made trading system. The indicator does not redraw and does not lag. Works on all currency pairs and on all timeframes. You should remember that using a combination of forecasting tools, it is advisable to choose 2-3 indic
Balanced Costing
Tatiana Savkevych
Balanced Costing - shows signals - can be used with an optimal risk factor. The indicator can be used both for pipsing on small periods and for long-term trading. The Balanced Costing trend indicator uses reliable algorithms in its calculations. Shows favorable moments for entering the market with arrows, that is, using the indicator is quite simple. Works on all currency pairs and on all timeframes. Of course, the approach to trading should be complex and in order to make a decision, you shou
Signal Point Channel
Tatiana Savkevych
The Signal Point Channel indicator predicts the most likely short-term price movement based on complex mathematical calculations. One of the biggest challenges traders face is finding a trading system that's right for them. This indicator is designed to detect trends in price movement and allows you to quickly determine not only the direction of the trend, but also to understand the levels of interaction between buyers and sellers. It has no settings and therefore can be perceived as it signals.
Transition Trend
Tatiana Savkevych
The Transition Trend indicator shows the points of potential market reversal. The indicator's smart algorithm detects the trend, filters out market noise and generates entry signals and exit levels. Simple, visual and efficient trend detection. Uses just one parameter for settings. The indicator does not redraw and does not lag. You can set up message alerts as sound or email. Works on all currency pairs and all timeframes. Ready-made trading system.
World Trend
Tatiana Savkevych
5 (1)
World Trend is a hybrid trend indicator, as it is based on the signals of elementary indicators and a special algorithm for analysis. The indicator shows favorable moments for entering the market. The intelligent algorithm of the indicator determines the trend, filters out market noise and generates entry signals. You can use the indicator as the main one to determine the trend. The indicator can work both for entry points and as a filter. Uses two options for settings. The indicator uses colo
Generic Trend
Tatiana Savkevych
The Generic Trend indicator is a trend type indicator. It smooths out price fluctuations when generating a signal by averaging the data and the signal only at certain moments! In those moments when you need to make a decision to enter a position and give the trader a direction. The indicator gives the trader the opportunity to visually determine which trend will be present at a particular time interval. This indicator was created to quickly determine the situation in the market, reflect the st
Trend Privacy
Tatiana Savkevych
The Trend Privacy indicator is easy to set up and works on all pairs and all time frames. Identifies the mainstream and helps analyze the market at a selected time frame It is extremely important for any trader to correctly determine the direction and strength of the trend movement. Unfortunately, there is no single correct solution to this problem. Many traders trade on different time frames. For this reason, the received signals are perceived subjectively. Trend indicators provide an opportu
Chaos Trend
Tatiana Savkevych
Chaos Trend is an arrow indicator for identifying potential entry points. I like it, first of all, because it has a simple mechanism of work, adaptation to all time periods and trading tactics. More reliably, the Forex Chaos Trend indicator is a real trading strategy with which you can achieve the desired results. As soon as the Chaos Trend indicator is installed, the main indicators for the price of the traded pair will immediately begin to be recalculated, based on the postulates of technica
Channel Smooth
Tatiana Savkevych
Channel Smooth - Forex channel indicator is a very useful and relevant tool for any trader, thanks to which you can efficiently and competently perform plotting on the chart, including automatically, without wasting time on independent calculations and eliminating the risk of incorrect point selection. Channels are needed to trade channel strategies that involve working within a certain price range. The key difference between the Channel Smooth indicator and other channel indicators (for examp
Trend Improved
Tatiana Savkevych
Trend Improved - Arrow trend indicator, without lagging and redrawing, is used by traders in trending strategies in trading on financial markets (Forex, CFDs, binary options). Key parameter MinAngle - The parameter is set in pips. For each instrument, select individually, start from scratch. If the parameter is too large then there will be no signals. The tool, at the very least, deserves attention for its signal accuracy and intuitiveness. Increasing the Period parameters decreases the numbe
Forex Roulette
Tatiana Savkevych
Forex Roulette - Trend Following Strategy! The most reliable indicator is used for the trend - the moving average. Only for the global trend, then the strategy itself is implemented. On screenshots, testing from $ 10,000, but the bot works without problems with $ 100. The first graph is optimization, the second is forecast. You can repeat yourself on another period, observing the principle indicated below. How the bot works. Optimization for the m15 period, after which works for 3 months. Very
Projection Trend
Tatiana Savkevych
Projection Trend - a Forex arrow indicator without redrawing does not change its signals when the market situation changes, does not adjust to the chart. The signals given by him are unambiguous. Traders build a trading system that provides good signals 80-90% of the time. The indicator showing the points of entry and exit from the market with arrows is able to bring results not only in the Forex market, but also when working with binary options. You can buy it and install it in MetaTrader you
Calc Trend
Tatiana Savkevych
Calc Trend is a Forex trend indicator based on the familiar RSI, but there is one "but"! We display RSI indicator signals on a price function chart using a mathematical approach. As you know, the overbought and oversold zones that the standard RSI fixes are often broken by the price and the price goes the other way. This makes the standard indicator inapplicable for real work in its pure form. Also, for sure, each user has noticed that at any part of the history, it is possible to change the R
Calc Trend Ex
Tatiana Savkevych
Calc Trend Ex is a forex trending bot based on the Calc Trend indicator. A bot created on the basis of this Calc Trend indicator and working on the principle - if there is an indicator signal, then the bot has closed an opposite deal and opened a new deal in the specified direction, it can be downloaded and used for work. The bot is as simple as possible! The bot fully reflects the work of the indicator. Moreover, the bot can be optimized (by optimizing the parameters of the indicator itself)
First Derivative RSI
Tatiana Savkevych
First Derivative RSI is a forex indicator based on all familiar RSI, based on the first derivative of the price function. The indicator combines the functionality of an oscillator and a trend indicator. At the bottom of the chart, a part of the indicator similar to the RSI will be displayed, but only calculated as the first derivative of the price. On the chart itself, trend signals will be displayed by arrows, they are filtered by the algorithm and always alternate buy / sell. It also shows th
Trend First Derivative RSI is a Forex indicator based on all familiar RSI, based on the first derivative of the price function. On the chart itself, trend signals will be displayed by arrows, they are filtered by the algorithm and always alternate buy / sell. It also shows the number of profitable pips that the indicator can give at the specified interval (LimitCalcHistory). The indicator has a parameter (Spread), which deducts a part of the profit per spread for each signal. To control the pe
Trend First Derivative RSI is a Forex trending bot based on the First Derivative RSI indicator. In the screenshots you can see tests that show the bot can work for 1,3,6 years, the timeframe is one hour. These are demo tests that show that it is realistic to go through significant sections of history with a different indicator and simple rules. Below in the text you will see a description of the rules of work. For real work, optimization is proposed for 3-12 months and work up to 1-2 months. O
Second Derivative RSI is a forex indicator based on all familiar RSI, based on the second derivative of the price function. Just a note on the use of the indicator. The indicator requires selection of settings not only for each currency pair but also for each timeframe. If there is no setting, then as a last resort, the indicator may not show signals! In order to pick up the settings, just use a bot that will help you do it. The indicator combines the functionality of an oscillator and a tren
Trend Second Derivative RSI is a forex indicator based on the usual RSI, based on the second derivative of the price function. On the chart itself, trend signals will be displayed by arrows, they are filtered by the algorithm and always alternate buy / sell. It also shows the number of profitable pips that the indicator can give at the specified interval (LimitCalcHistory). The indicator has a parameter (Spread), which deducts a part of the profit per spread for each signal. Immediately notice
Trend Second Derivative RSI Ex is a forex trending bot based on the Trend Second Derivative RSI indicator. Principle of operation. A bot created on the basis of this Trend Second Derivative RSI indicator and working on the principle - if there is an indicator signal, then the bot has closed the opposite deal and opened a new deal in the specified direction. It is also possible to work only for buy or sell, in which case the bot will simply close the deal without opening it in the opposite dire
Intel Trend
Tatiana Savkevych
Intel Trend is a forex trend indicator based on all the usual SAR, using differential calculus to generate a signal not directly from the price but from the derivative of the function. Also, when using the SAR indicator, the first point often changes, which is why the default parameter ShiftBar = 1. To skip the first baoa and read information directly from the second bar. If you set ShiftBar = 0, there will be perfect signals, but they are false. real signals for each timeframe and for each cur
Intel Trend Ex
Tatiana Savkevych
Intel Trend Ex is a forex trending bot based on the Intel Trend indicator. Principle of operation. A bot created on the basis of this Intel Trend indicator and working on the principle - if there is an indicator signal, then the bot has closed an opposite deal and opened a new deal in the specified direction. It is also possible to work only for buy or sell, in which case the bot will simply close the deal without opening it in the opposite direction. The bot is also equipped with an adaptive
Nuremberg
Tatiana Savkevych
The Nuremberg tool presents a channel-like algorithm. The best arrow algorithms use channels without redrawing. Its settings indicate the parameters of the length and width of the channel. The indicator was created in such a way that you can fix the reaction to the channel breakout and display it in the form of an arrow. Arrow indicator Nuremberg on Forex indicates points of entry into transactions without redrawing. It generates fairly frequent and accurate signals. When an upward arrow appea
Unchained
Tatiana Savkevych
Unchained is intended for scalping trading. It is used to trade on five and fifteen-minute timeframes. But it works on H1 and higher too. According to the traders themselves, the best arrow indicator is the one that does not redraw, i.e. does not imply changes in indicators. When an upward arrow appears on the chart, the trader opens a buy order. If a downward arrow appears during trading, the buy order is closed. After analyzing the situation in this case, you can open a sell position. It is
Clustering Trend
Tatiana Savkevych
Clustering Trend is always in operation - after the first position, provided that the position is not closed with stops. You can test the bot on any part of the history, the bot is configured to pass the entire history, but if you need to increase productivity in a specific area, you can optimize the bot for more productive work, but in a shorter part of the history. The bot works without trailing stops, breakevens or anything like that. The principle of operation is that there is a signal, th
Toroid
Tatiana Savkevych
Toroid - The indicator reflects information in a visual form, it can be used both for pipsing on small periods and for long-term trading. It generates fairly frequent and accurate signals. The indicator can be used as the main one for determining the trend. The indicator can work both for entry points and as a filter. Uses two parameters for settings. The smart indicator algorithm detects the trend, filters out market noise and generates input signals. It is based on the signals of elementary in
Platoon
Tatiana Savkevych
Platoon is an indicator designed to be able to detect a bottom or top similar to the Fractals indicator, but of course a different algorithm is used. In other words, you should not enter into a buy deal if the fractal is below. And you should not enter into a sell deal if the fractal is higher. The indicator only denotes fractals on the chart without performing any additional calculations, therefore, theoretically, any trader can find these patterns by himself. But what is a fractal, how exact
Provided
Tatiana Savkevych
Provided is a trend trading Expert Advisor based on the simplest indicator strategy of following the market towards global price movements. The robot can effectively trade on almost any trading asset or currency pair, but subject to proper optimization. It is recommended to use the robot on the hourly chart of the Euro / Dollar currency pair. List of all settings: Magic - Magic number. StartVolume - Sets the lot size for entering the market. OnRisk - Activates Money Management. PercentRisk - A
About
Tatiana Savkevych
About - Forex indicator. This trend indicator is used to determine the current trend in price movement, making it clear in which direction it is better to open a position: buy or sell. The About trend indicator is displayed on the chart and moves in parallel with the price. The Forex About trend indicator allows you to determine in time a change in the direction of price movement, thereby minimizing the likelihood of capital loss. In trading practice, various combinations of About and other ind
筛选:
无评论
回复评论