Probabilities distribution of price
- 指标
-
Aleksey Ivanov
 👑 理论物理学家,程序员,交易员,拥有15年的经验。
-------------------------------------------------------------
💰 生產的產品:
1) 🏆 具有对市场噪音进行最佳过滤的指标(用于选择开仓和平仓点)。
2) 🏆 统计指标(确定全球趋势)。
3) 🏆 市场研究指标(以澄清价格的微观结构,建立渠道,识别趋势反转和回调之间的差异)。
--------------------------------------------------------------------------- - 版本: 2.30
- 更新: 17 八月 2020
- 激活: 5
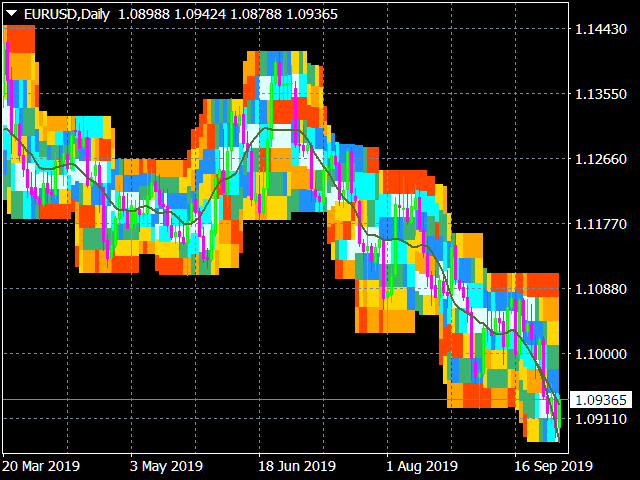
PDP indicator is used for:
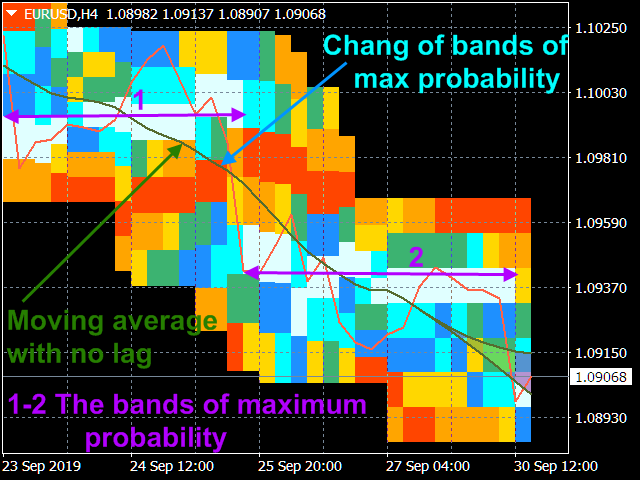
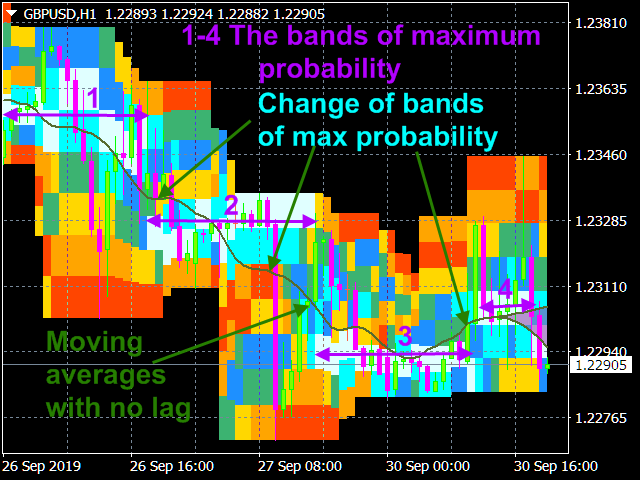
- defining price probability distributions. This allows for a detailed representation of the channel and its borders and forecast the probability of a price appearing at each segment of its fluctuations;
- defining the channel change moment.
Operation principles and features
PDP analyzes a quote history on lower timeframes and calculates a price probability distribution on higher ones. Forecast algorithms allow the indicator to calculate probability distributions and moving averages without delays that usually accompany conventional moving averages.
The indicator operation is based on processing a deep and detailed quote history. Therefore, before launching PDP on a symbol chart, make sure to download the quote history (Tools/History Center) of the symbol and increase "Max bars in history" and "Max bars in chart" to the maximum possible value (Tools/Options/Charts). PDP produces a large amount of calculations and therefore is resource-intensive. It requires at least a 4-core 2.8 GHz CPU and 4.00 GB of RAM. If the indicator causes much load on MetaTrader 4, decrease the "Number of countable bars of the current chart" parameter in the indicator settings having the default value of 200.
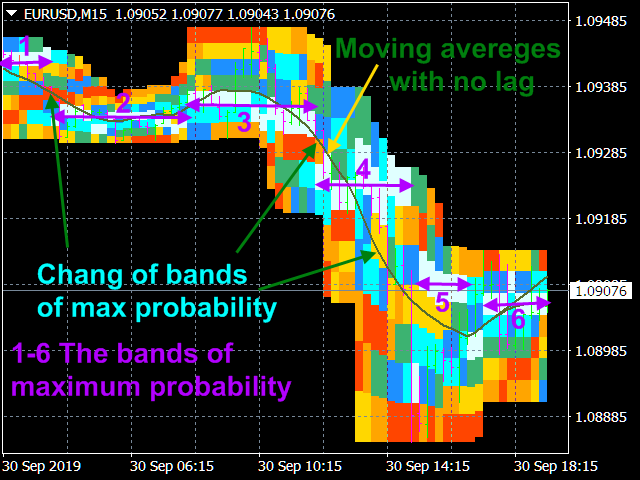
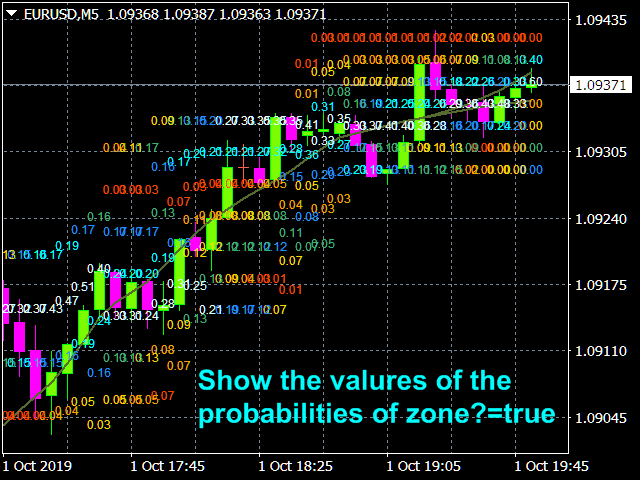
The program splits the total price fluctuation for a given averaging period by seven equal intervals and calculates the frequency of price hits at these intervals. Based on these calculations, the indicator builds the probability columns, which can be displayed in the main terminal window in two ways:
- as a color code, by the type of the visible light spectrum when the most probable values are closer to the violet area, while the least probable values are close to the red one. The intervals are colored accordingly (the order of coding of the decreasing probability by means of the color scale is specified in the settings and can be changed by users);
- as values specifying the probability of hitting the given intervals with the corresponding color.
Operation modes and settings
Algorithm settings:
- The averaging period in the bars of the current graph (2n+1) - averaging period (1-99).
- Number of countable bars of the current chart (<=200) - number of calculated indicator graph bars (1-200).
- Shifting the calculation area of the indicator - global indicator shift (0-100).
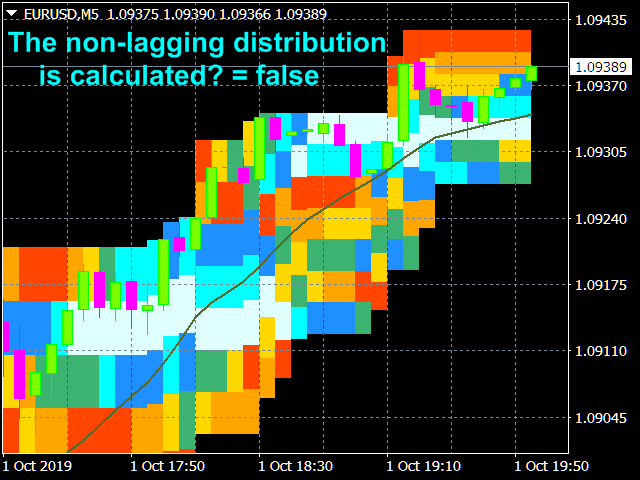
- The non-lagging distribution is calculated - calculate a non-lagging distribution.
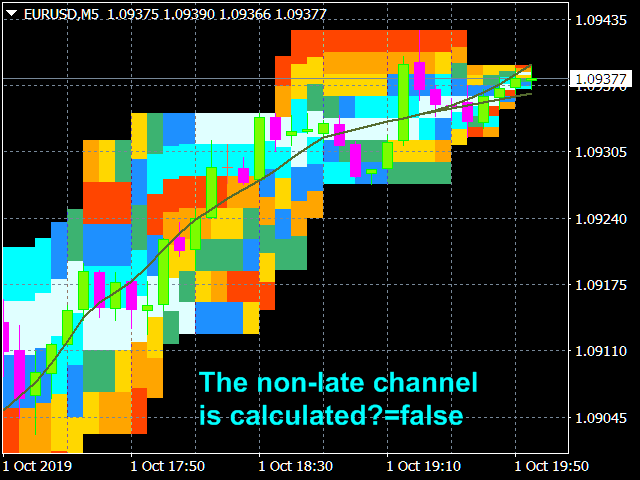
- The non-late channel is calculated - calculate the current non-lagging channel.
- Show the values of the probabilities of zones - display area probability values.
Color and display settings:
Colors in probability density descending order.
- Color of the maximum probability zone (0);
- Color of zone (1);
- Color of zone (2);
- Color of the zone of average probability (3);
- Color of zone (4);
- Color of zone (5);
- Color of the minimum probability zone (6);
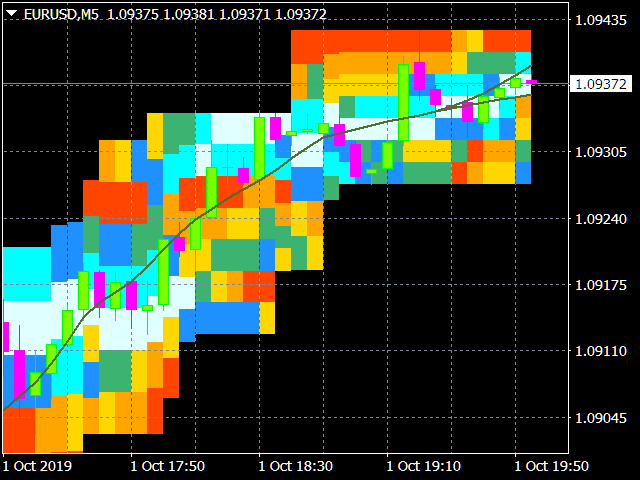
Parameters of non-lagging moving average.
- Moving average price type
- The averaging method
- Confidence probability - Values: from 0 to 0.999 (0.5 by default).
- Color of the moving average line=clrDarkOliveGreen; - The color of the indicator line and its figure sector.
- Paint over the confidence interval? Values: true, false (by default)
Trading mode settings:
- Calculate the lot size from the risk, deposit and channel
- Deposit in $
- Allowable losses in %
- The channel strategy is used - true - intra-channel strategy (false - channel breakthrough strategy)
- Color of message about the size of the lot
- Information about the lot at the bottom of the channel (false - information at the top of the channel)
Using in trading
Intra-channel strategy. The strategy is used in case of a formed white line - area of maximum probability. Open order when the price deviates into the yellow or orange areas. Close when the price returns to the white area.
Trend-following strategy. Open order during a roll-back when the price deviates against a trend to the yellow or orange areas.
StopLoss is placed slightly further than the channel borders.


Good product. I like this indicator.