MT4 high accuracy indicators17
- 指标
-
Xue Hang Pan
 The millionaires foreign exchange development co., LTD., the company was established in 2002, is a global financial derivatives investment services and investment consulting services provider, the service coverage is widespread, has the first-class credit rating, with the mature financial management
 - 版本: 1.0
- 激活: 5
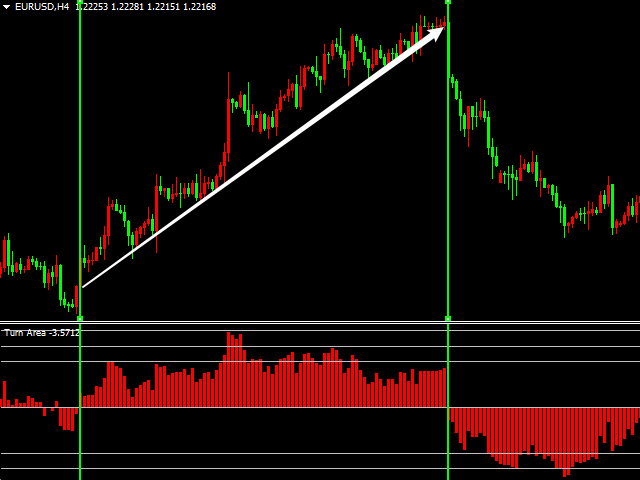
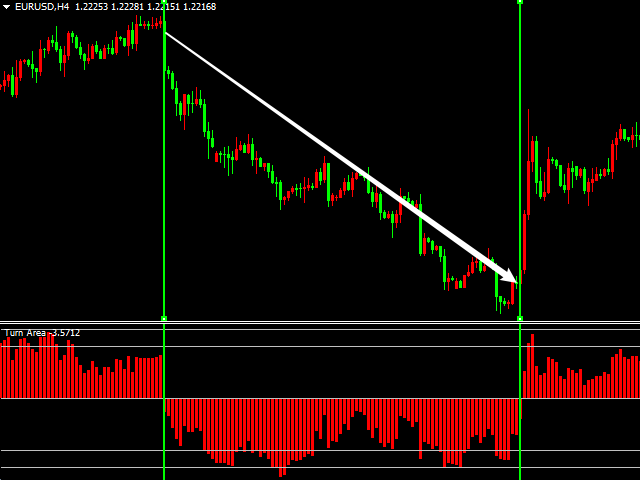
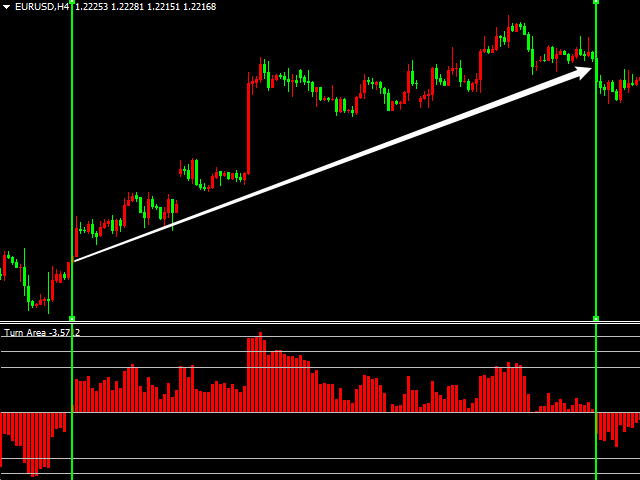
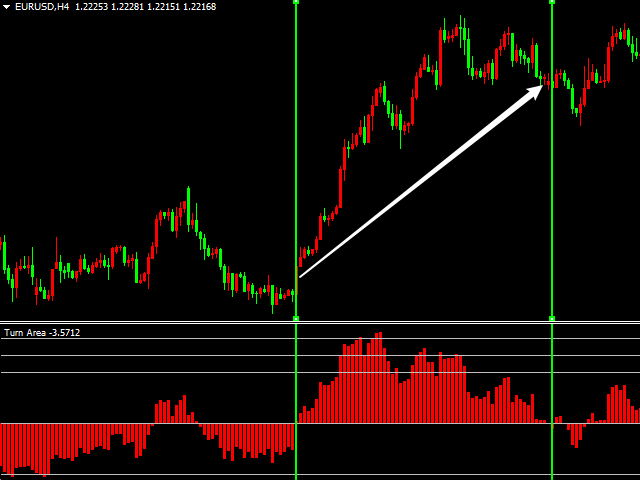
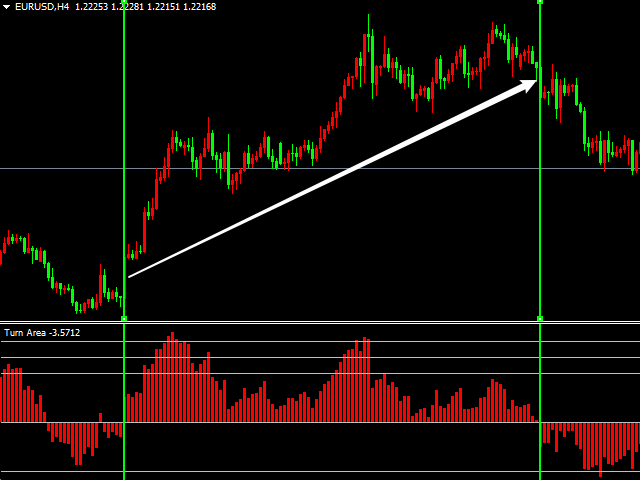
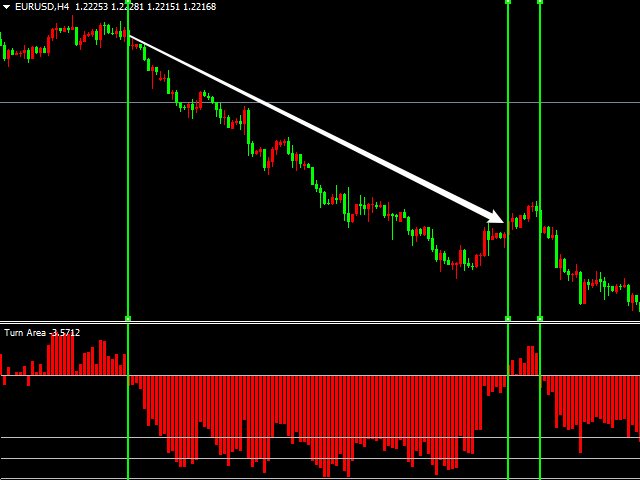
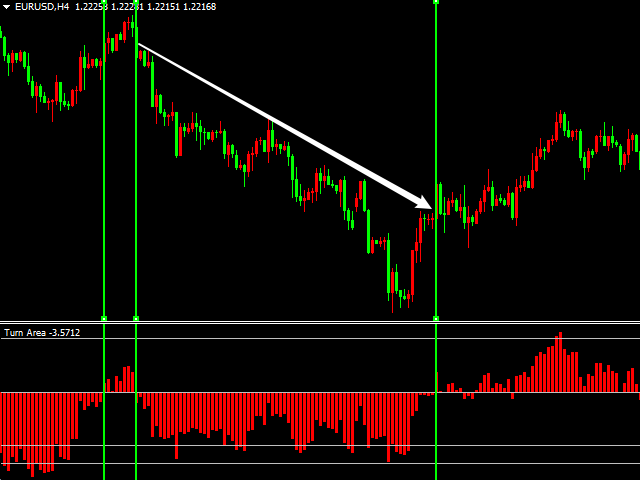
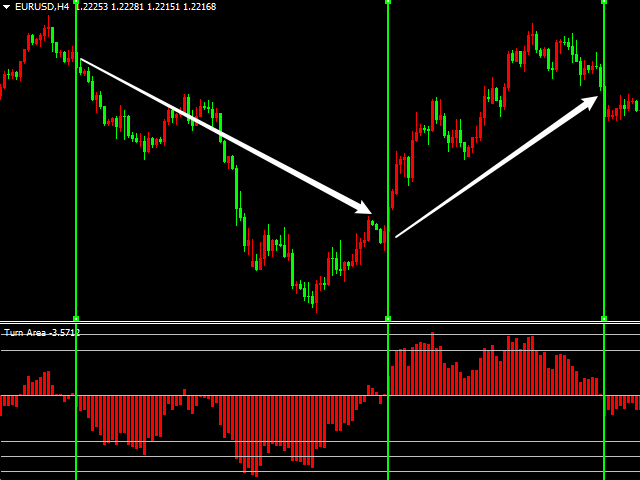
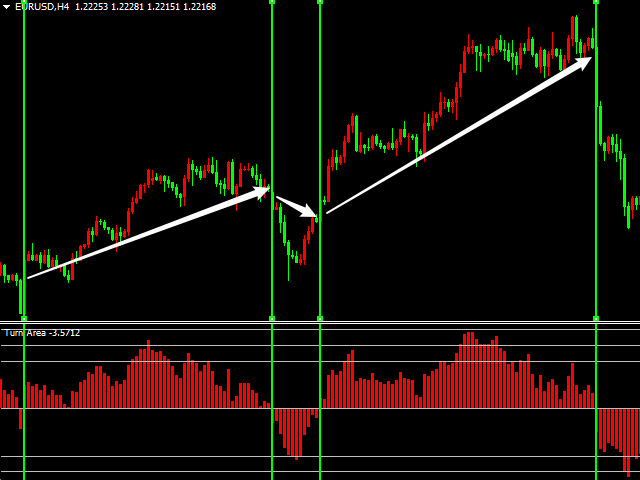
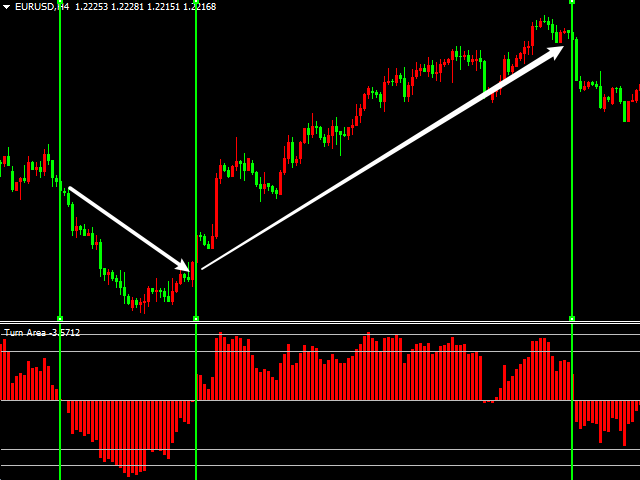
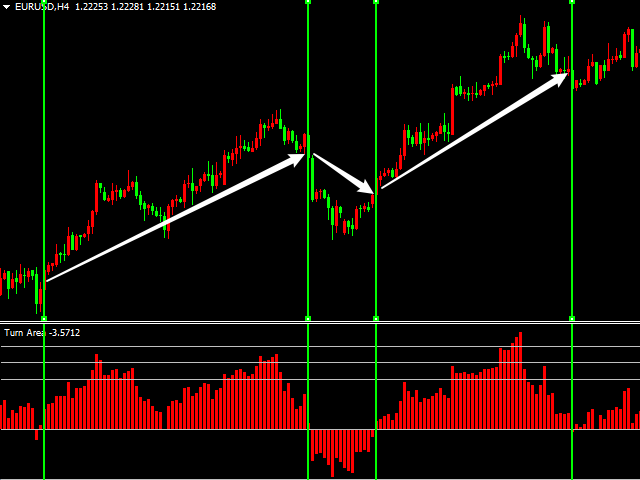
Indicator function
Choose to buy or sell at the critical point of indicator zero
It is best to use 1H for testing
About update questions
In order to be more suitable for market fluctuations, the company regularly updates the indicators
Product cycle and trading time applicable to indicators
Applicable mainstream currency pair
EUR/USD GBP/USD NZD/USD AUD/USD USD/JPY USD/CAD USD/CHF
Applicable mainstream cross currency pair
EUR/JPY EUR/GBP EUR/CHF EUR/CAD EUR/NZD
AUD/CAD AUD/NZD AUD/CHF AUD/JPY
GBP/JPY GBP/CHF
NZD/JPY
Applicable precious metal XAUUSD
Applicable crude oil XTIUSD XBRUSD
This indicator applies to transactions in any cycle and at any time
用户没有留下任何评级信息