Delta AG Free
- 指标
- 版本: 1.3
- 更新: 4 一月 2022

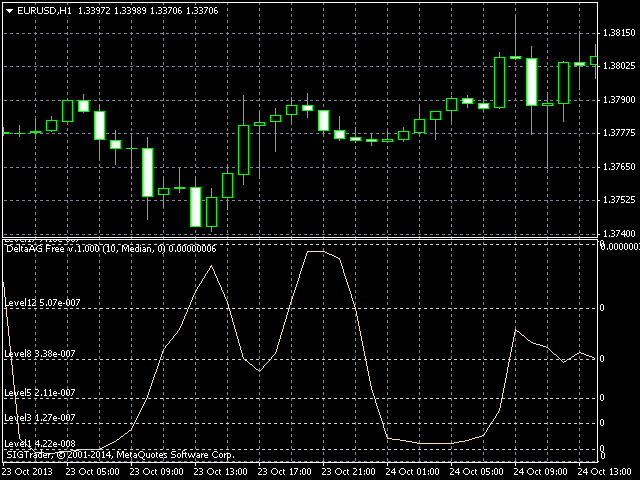
The difference between the arithmetic and geometric means at the specified range. Since the greater is the difference between the values, the greater the resulting figure is, actually the indicator shows volatility fluctuations.
The arithmetic mean of a certain number of values is the sum of the values divided by their number.
The geometric mean is the root of the power of the number of values extracted from the product of these values.
If all values are equal, the arithmetic mean and the geometric mean are equal. The greater is the difference between the values , the average of which is calculated, the greater the difference between the arithmetic and geometric means is.
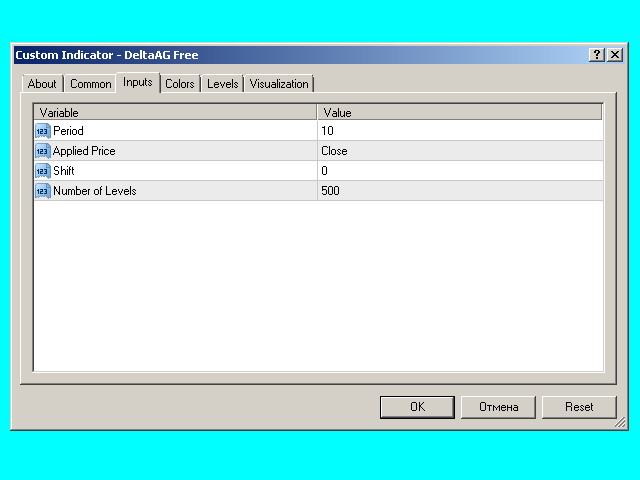
Input Parameters
The indicator has four input parameters:
Period - a positive number greater than one, it shows the number of candlesticks used for calculations (the number of values to calculate the means values). If you enter one or zero, there will be no error, but the indicator will not be drawn.
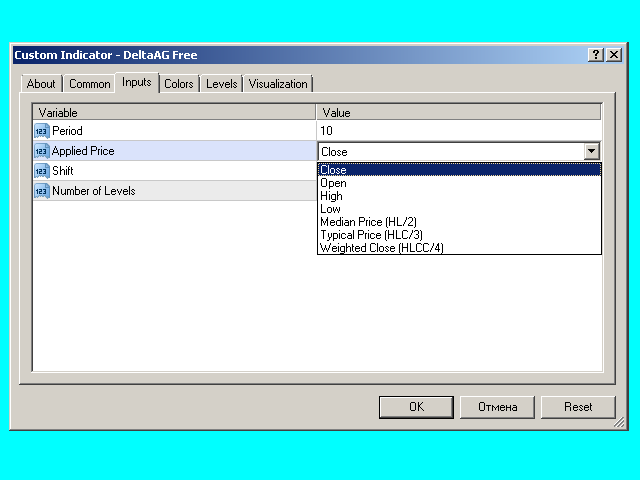
Applied Price - the standard "Apply to:" set meaning data used for the indicator calculation:
- Close - Close prices;
- Open - Open prices;
- High - High prices;
- Low - Low prices;
- Median Price (HL/2) - average of high and low prices, (high+low)/2;
- Typical Price (HLC/3) - average of high, low and close prices, (high+low+close)/3;
- Weighted Close (HLCC/4) - average of high, low and double value close prices, (high+low+close+close)/4.
Shift - shift or offset.
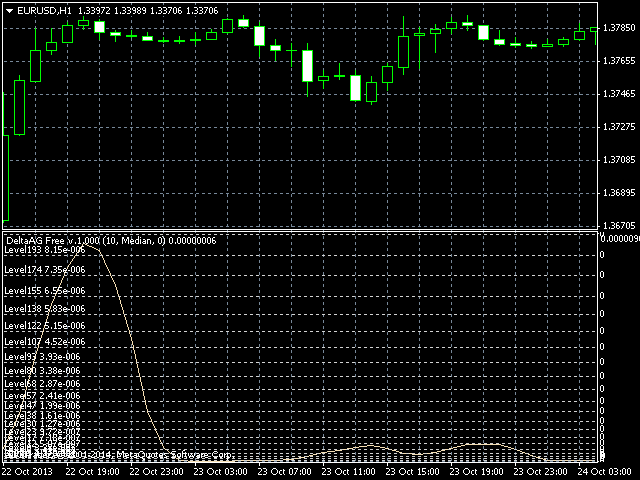
Number of Levels - number of levels. MetaTrader 4 can show maximum 32 levels. In order to actually break this limit without breaking it formally, the indicator is searching for its own maximum in history, assigns its value to the highest level and divides the distance between the zero value and the highest level by the specified number of ranges. After that, based on a special algorithm, the indicator selects 32 levels to display so that the distance between them uniformly increases to the maximum.
The lines of the levels are implemented in the style of a grid of the main chart. To the left above each level, its number and a numeric value are displayed. To provide correct search of maximum in the history, it is recommended to download history before installing the indicator.
Differences from the Paid Version
This is a free version. The paid version of Delta AG includes the following options:
- an extended set of Applied Price values;
- calculation on the history and optional display of the average value as a separate line of the indicator; the share of the levels in the mean average is shown in their descriptions.

用户没有留下任何评级信息