DeMarker alert MT4
- 指标
- 版本: 1.30
- 激活: 5

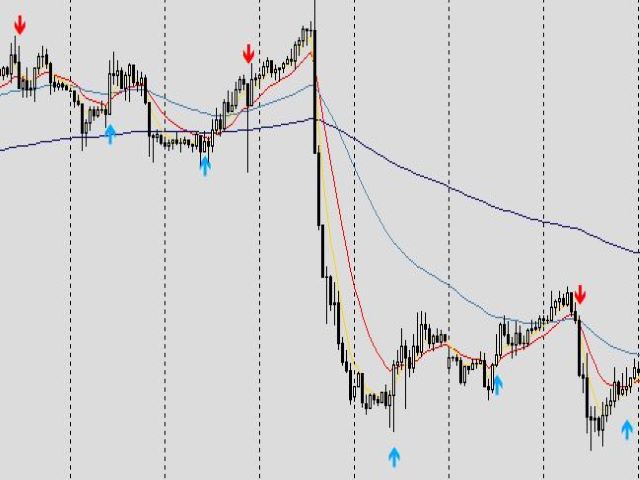
the indicator will show signal arrows on the graph at the crossing of a given level
it has push and audible alerts.
By crossing from low to high level 0.3, a blue arrow will come out for the purchase, at the same time an audible signal will sound.
By crossing from low to high level 0.7, a red arrow will come out for the sale, at the same time an audible signal will sound.
Possibility to deactivate push and audible alerts.
MT5 version : https://www.mql5.com/en/market/product/51968