MACD Scanner With Alerts
- 지표
- 버전: 1.0

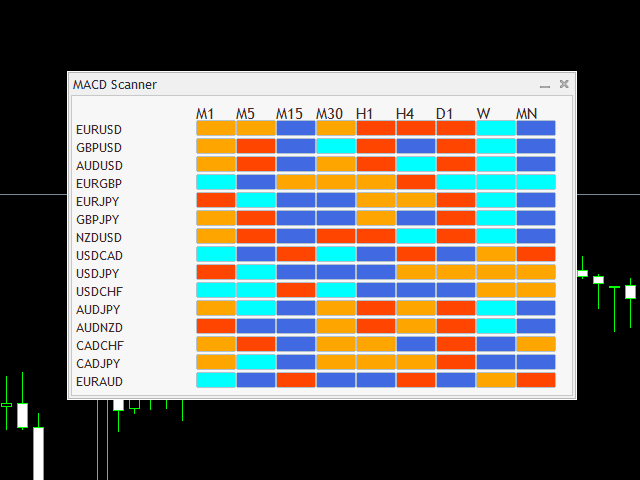
MACD Dashboard Panel
This indicator helps you to scan symbols which are in the Market Watch window and filter out a trend according to MACD.
Moving Average Convergence Divergence (MACD) is a trend-following momentum indicator that shows the relationship between two moving averages of a security’s price. The MACD is calculated by subtracting the 26-period Exponential Moving Average (EMA) from the 12-period EMA.
The result of that calculation is the MACD line. A nine-day EMA of the MACD called the "signal line," is then plotted on top of the MACD line, which can function as a trigger for buy and sell signals. Traders may buy the security when the MACD crosses above its signal line and sell - or short - the security when the MACD crosses below the signal line. Moving Average Convergence Divergence (MACD) indicators can be interpreted in several ways, but the more common methods are crossovers, divergences, and rapid rises/falls.
It shows MACD trend of Each Time-frame in Single Window. Also you can open chart by clicking on values
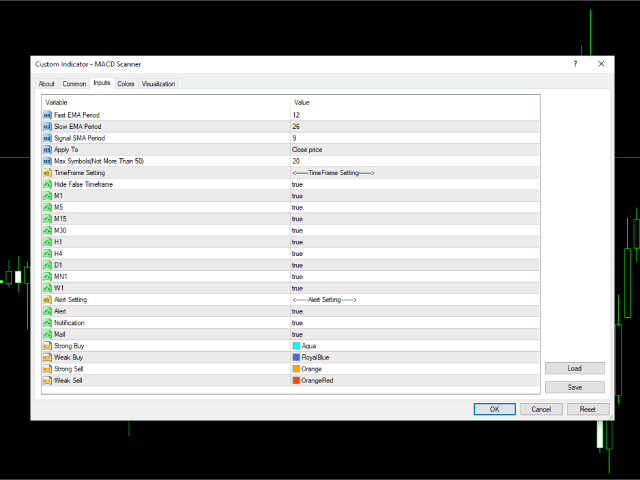

Hi! Thanks to the author, the indicator is working. But unfortunately, notifications are not coming through. Please fix this issue. Create your template and save it as Default. By pressing the button (red or green), the chart will open immediately in your template. --------------------------------------------------------------------------- Request to the author: can you add the option to select signals: 1) By crossing the zero line 2) Histogram below/above EMA 9 + 3) Both signals THANK YOU!!!