FXC iRSI DivergencE MT5
- 指标
- 版本: 1.3
- 更新: 16 一月 2023
- 激活: 20

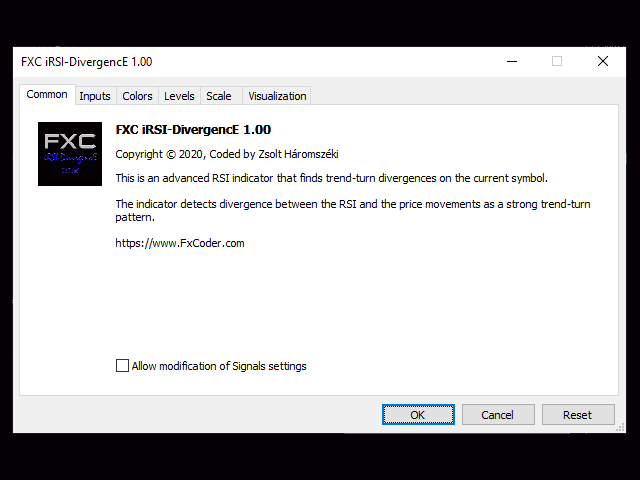
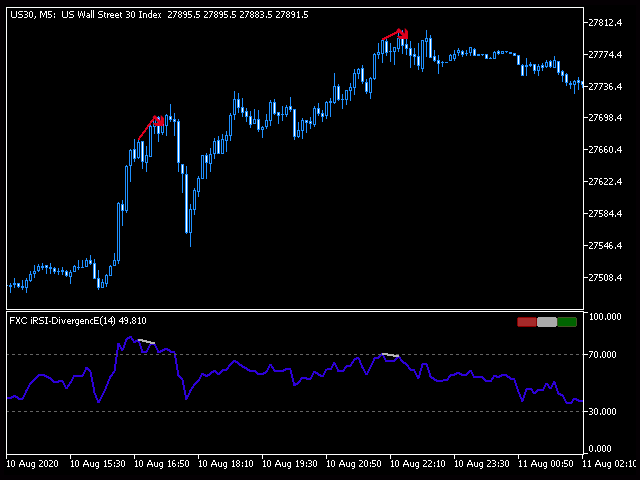
FXC iRSI-DivergencE MT5 指示符
這是一個高級RSI指標,可找到當前交易品種上的趨勢轉折差異。 該指標將RSI和價格走勢之間的背離檢測為強烈的趨勢轉變模式。
主要特點:
- 高級發散設置
- 價格基於收盤價,開盤價或最高價/最低價
- 發出買/賣開放信號
- 推送通知
- 郵件發送
- 彈出警報
- 可定制的信息面板
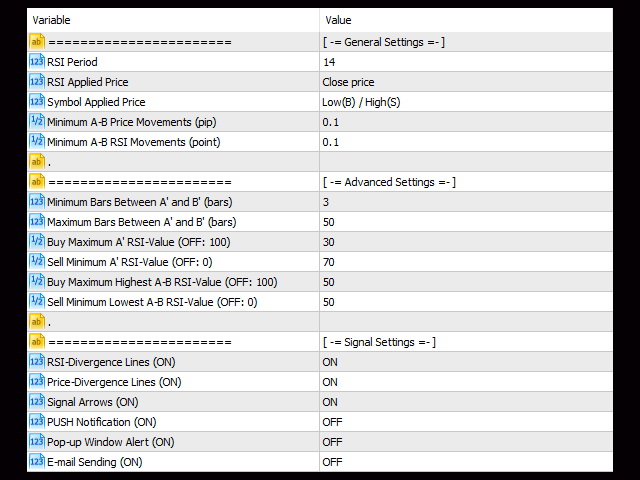
- RSI Period: RSI指標的周期大小。
- RSI Applied Price: RSI指標的適用價格。 可以是:關閉,打開,高,低,中位,典型,加權。
- Symbol Applied Price: 當前符號的適用價格。 可以是:關閉,打開,低(B)/高(S)。
- Minimum A-B Price Movements (pip): 確定差異的A點和B點之間的最小價格變動。
- Minimum A-B RSI Movements (point): 確定散度的A點和B點之間的最小RSI值移動。
- Minimum Bars Between A' and B' (bars): A點和B點之間允許的最小條形數量。
- Maximum Bars Between A' and B' (bars): A點和B點之間允許的最大柱數。
- Buy Maximum A' RSI-Value (OFF: 100): 購買散度A點的最大RSI值。
- Sell Minimum A' RSI-Value (OFF: 0): 賣出背離的A點的最小RSI值。
- Buy Maximum Highest A-B RSI-Value (OFF: 100): 購買散點在A點和B點之間允許的最高RSI值。
- Sell Minimum Lowest A-B RSI-Value (OFF: 0): 賣出背離的A點和B點之間允許的最低最低RSI值。
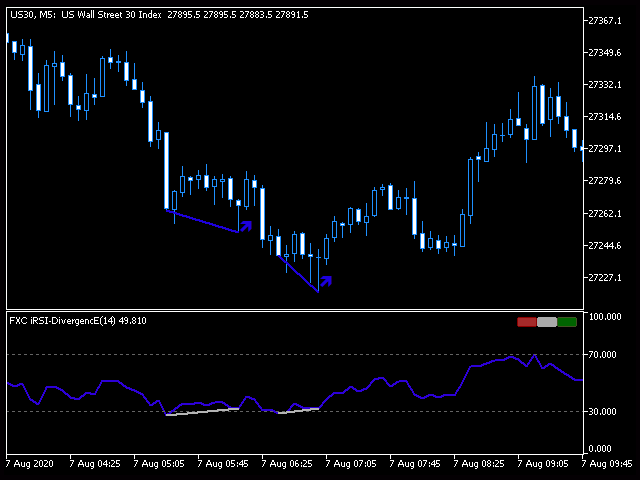
- RSI-Divergence Lines (ON): 在信號處向指示器窗口繪製發散線。
- Price-Divergence Lines (ON): 在信號處向價格圖繪製分歧線。
- Signal Arrow (ON): 在信號處向圖表繪製箭頭。
- PUSH Notification (ON): 在信號處發送PUSH通知。
- Pop-up Window Alert (ON): 在信號處發送彈出警報。
- E-mail Sending (ON): 通過信號發送電子郵件。
- Infopanel (ON): 開關打開或關閉信息面板。
- Infopanel Color-1: 信息面板的顏色1。
- Infopanel Color-2: 信息面板的顏色2。
- Infopanel Color-3: 信息面板的顏色3。
- Infopanel Background (ON): 打開或關閉信息面板的背景。
- Infopanel Background Color: 設置信息面板的背景色。
- Divergence Price-Line Buy-Color: 購買標誌的發散價線顏色。
- Divergence Price-Line Sell-Color: 賣價標誌的發散價線顏色。
- Divergence Price-Line Width: 價格線的寬度。
- Divergence Price-Line Style: 價格線樣式。
- Divergence RSI-Line Buy-Color: 購買標誌的發散RSI線顏色。
- Divergence RSI-Line Sell-Color: 賣出標誌的RSI線發散色。
- Divergence RSI-Line Width: RSI線的寬度。
- Divergence RSI-Line Style: RSI線的樣式。
- Arrow Color Buy: 購買信號的箭頭顏色。
- Arrow Color Sell: 箭頭顏色代表賣出信號。
- Arrow Size (pixel): 箭頭大小(以像素為單位)。
- Arrow Shift Buy (Low + X pip): 使用此參數,您可以相對於低價移動買入箭頭的價格。
- Arrow Shift Sell (High + X pip): 使用此參數,您可以相對於高價移動賣出箭頭的價格。
- Drawback (bars): 過去繪製的分歧跡象的柱數。
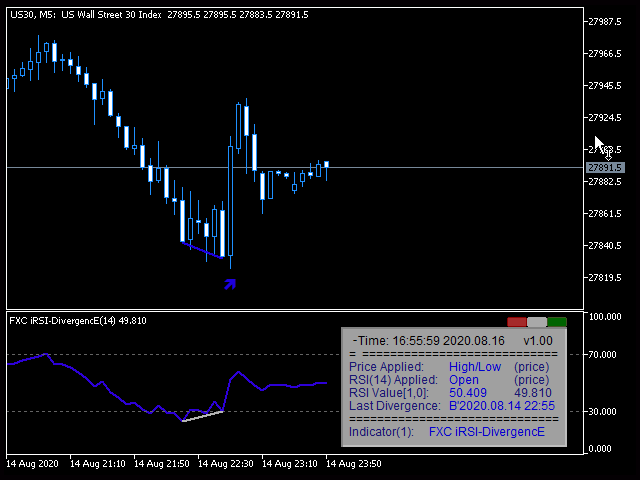
- Price Applied: 當前符號的適用價格。
- RSI(14) Applied: RSI指標的適用價格。 括號中有RSI的“期間”大小。
- RSI Value[0,1]: 最後兩個柱的RSI值。
- Last Divergence: 顯示最後一個發散符號的時間。 B“或S”代表方向:買或賣。
- Indicator(1): 顯示指標的名稱。 括號中的數字表示指標的子窗口。
鈕扣:
- 信息面板的右上角有三個小按鈕。
- 紅色按鈕:將其從圖表中刪除。
- 白色按鈕:什麼也不做。
- 綠色按鈕:打開或關閉信息面板。