Trend Code
- 指标
- 版本: 2.1
- 更新: 10 十一月 2020
- 激活: 5

Trend Code
趋势码指标
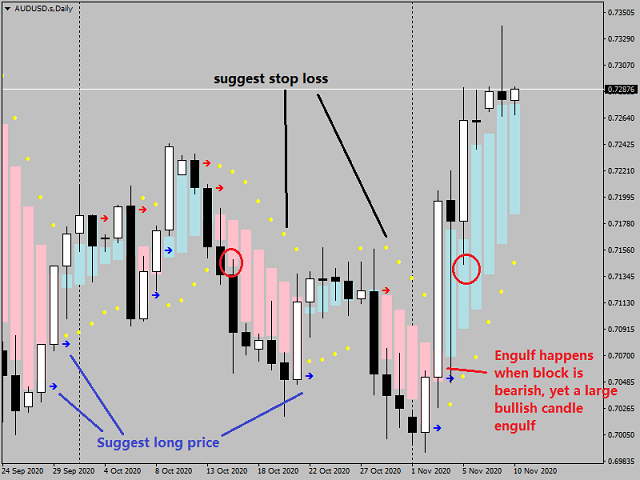
趋势码指标是个简单而有效的指标,能够捕捉价格趋势,检测趋势反转信号,计算入场价格及止损价格。
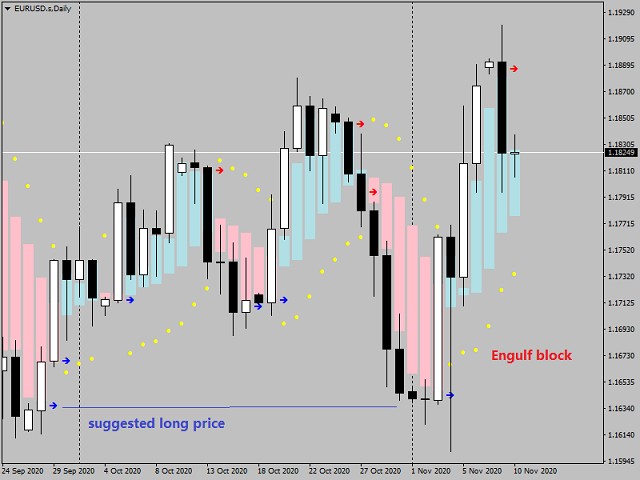
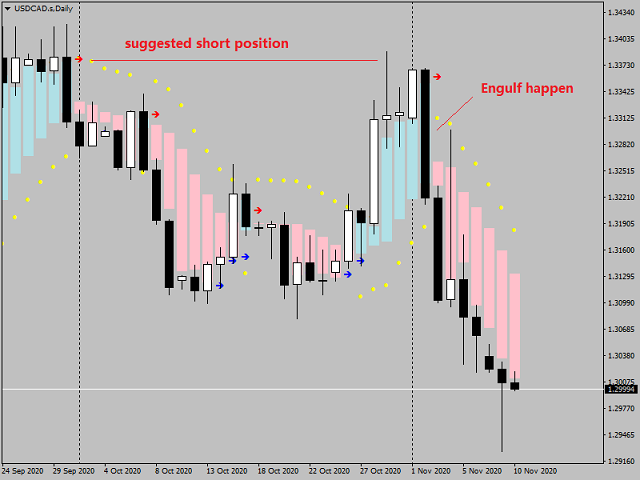
趋势码指标是由一序列的颜色块组成,浅蓝色代表牛市,红色代表熊市。熊市块指标开盘价是方块上边,指标收盘价是方块下边,牛市则相反。
主要参数
TrendOpenAdjustment = 0.8, (range 0~1.0)
TrendCloseAdjustment = 0.75, (range 0~1.0)
TrendStopAdjustment = 0.5, (range 0~1.0)
EnableKeyPriceLabel = true or false
TrendOpenAdjustment 计算趋势快的开盘价
TrendCloseAdjustment 计算趋势快的收盘价
TrendStopAdjustment 计算推荐的趋势止损价
EnableKeyPriceLabel 选项为计算推荐关键价位
主要功能
一. 没有延迟,在一个图标时间周期内保持色彩形状不变。
二. 捕捉趋势
三. 检测趋势反转
四. 计算入场价
五. 计算止损价
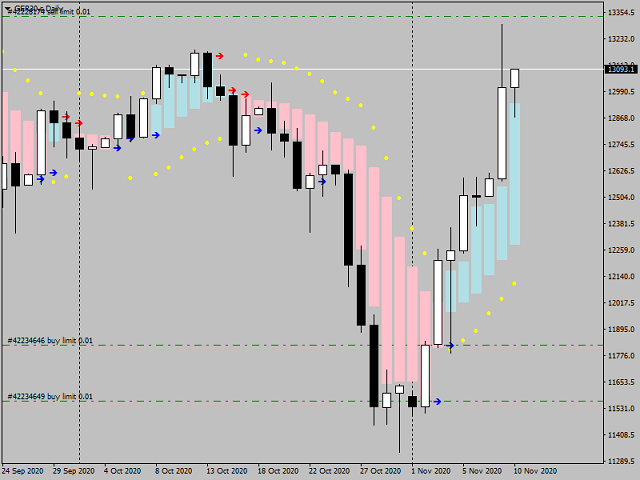
六. 计算关键价,可以在此价位挂单
建议的交易策略
根据指标颜色确认趋势
挂单在指标方块收盘价上等待价格回抽入场
挂单触发后,设置止损在指标方块开盘价,之后可以移动止损。
希望您能给与回馈以方便产品更新
looks usefull...