Alpha Indicator
- 指标
- 版本: 1.0
- 激活: 10

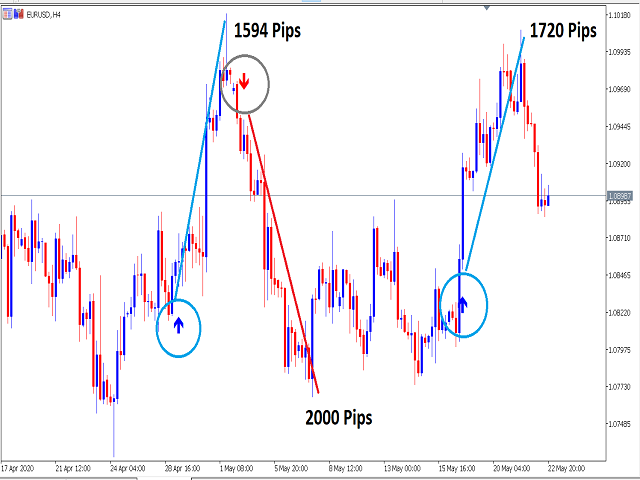
MT5的ALPHA TRADER指标是一种利用平均方向运动指数和ATR指标的有效性的指标,该指标能够深入了解市场趋势以及使反转信号具有生命力的各个超卖和超买区域,因此,它是一种非常可靠的资源,可用于制定能够直观地向投资者提供反转信号的指标-因为最终,该指标的作用是它通过使用彩色箭头准确地发出输入信号在交易图表上。
向下的红色箭头指示卖出信号,而向上的蓝色箭头指示买入信号,但是,交易者必须确保不要盲目地使用该指标,因为他们不应丢弃常规例程从技术分析和看跌趋势来看,交易者只能决定对卖出信号进行优先排序,而在看涨趋势中,交易者可以决定仅对购买信号进行优先排序,尽管如此,交易者仍可以大幅度降低风险,尽管有时指标和交易者是错误的,但是,只要坚持严格的资金管理系统,交易者仍然会在大部分时间获利。
对于交易者而言,将指标与交易量指标一起使用非常重要,因为在某些移动中,它们可能是由于新闻或重大交易引起的,并且不表示趋势变化。
我们建议在较短时期内进行操作时,应将其与更长时期一起进行分析,并遵循由ALPHA TRADER指示器的箭头指示的最长时期的趋势。
推荐期间:全部
资产:全部