Local Time Bar and Clock for MT4 Retina
- 指标
- 版本: 1.3
- 激活: 5
Layout modified version for high-resolution displays!
The different server times for each broker can be a heavy load when trading in short period.
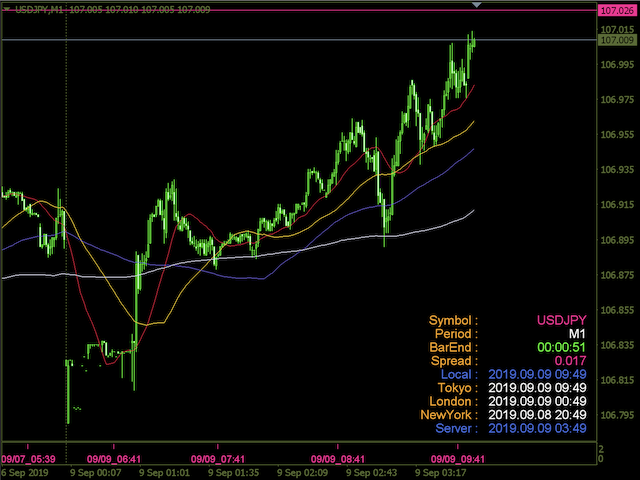
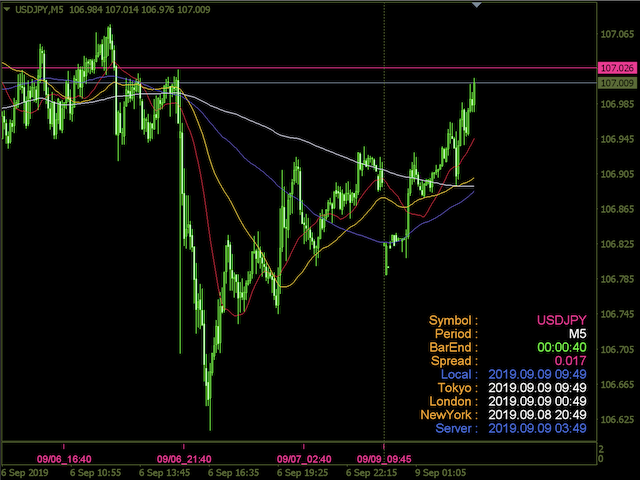
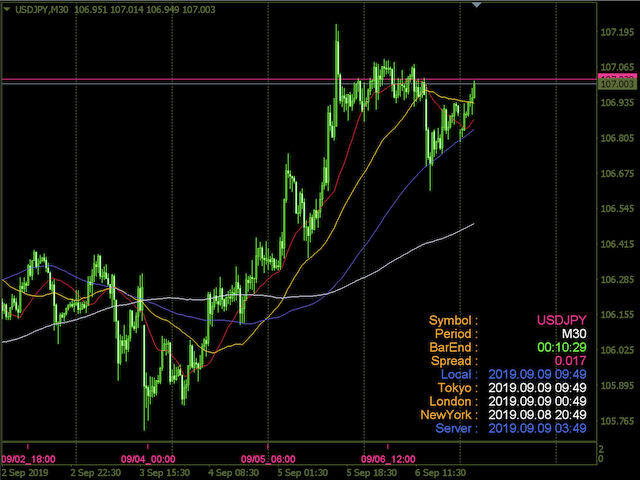
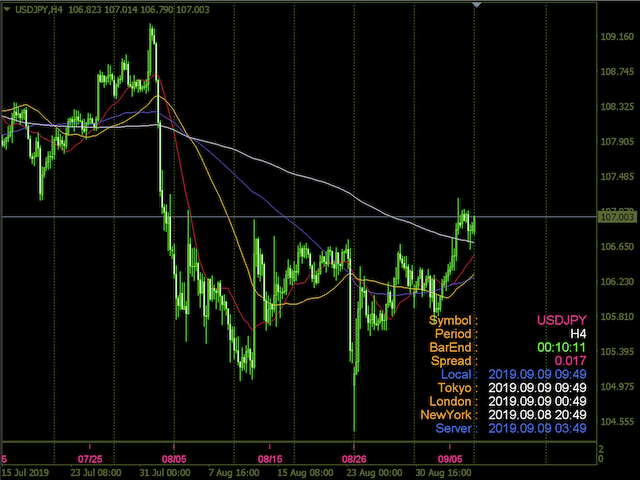
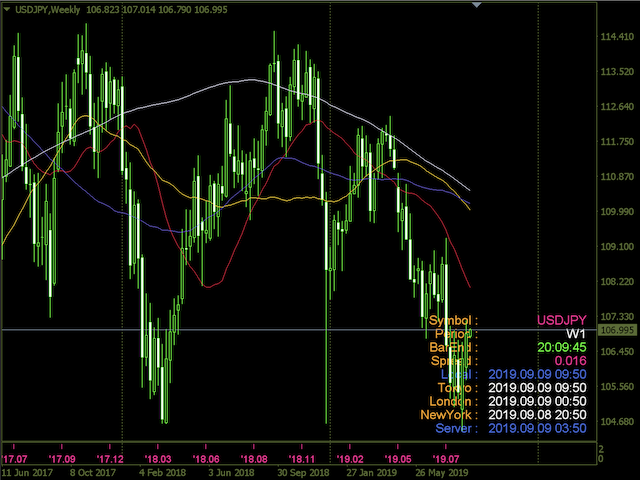
This indicator displays the minimum trade information required to win at a glance.
The sub window displays the local time, and the main chart displays not only the local time,
-Symbol
-Period
-BarEndTime
-Spred
-TokyoTime
-LondonTime
-NewYorkTime
-ServerTime
and so on...
The information display on the main chart can be selected from four places: upper right, lower right, upper left, and lower left.
The different server times for each broker can be a heavy load when trading in short period.
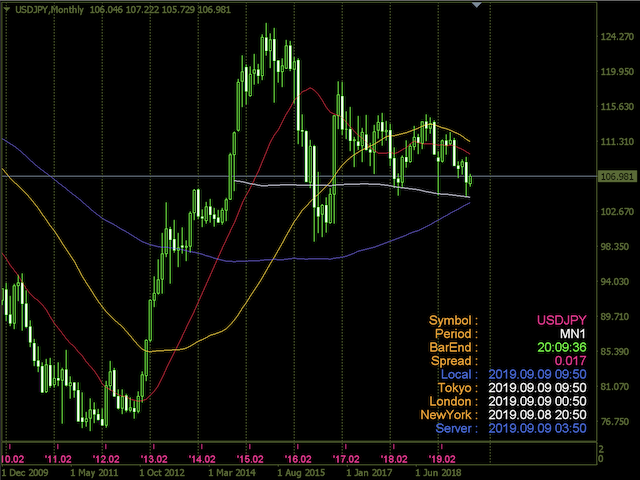
This indicator displays the minimum trade information required to win at a glance.
The sub window displays the local time, and the main chart displays not only the local time,
-Symbol
-Period
-BarEndTime
-Spred
-TokyoTime
-LondonTime
-NewYorkTime
-ServerTime
and so on...
The information display on the main chart can be selected from four places: upper right, lower right, upper left, and lower left.