Local Time Bar and Clock for MT4 Retina
- インディケータ
- バージョン: 1.3
- アクティベーション: 5
高解像度ディスプレイ対応のレイアウト修正版!
各ブローカーに依って異なるサーバー時間は、短時間足でトレードする際には大きな負荷となります。
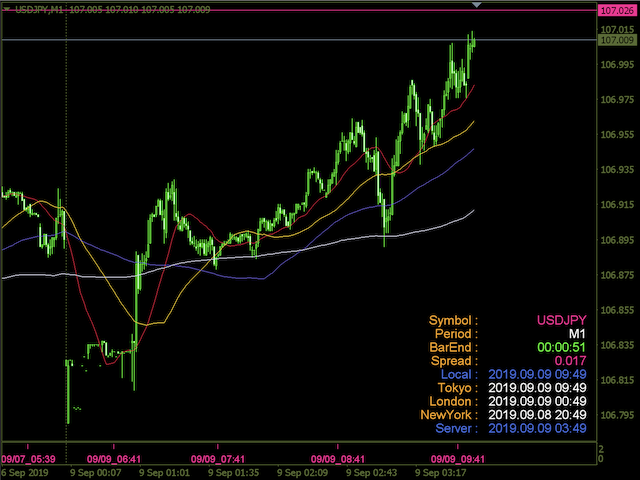
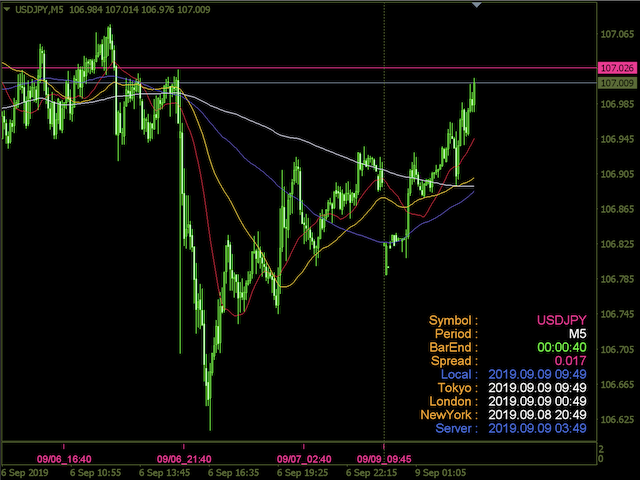
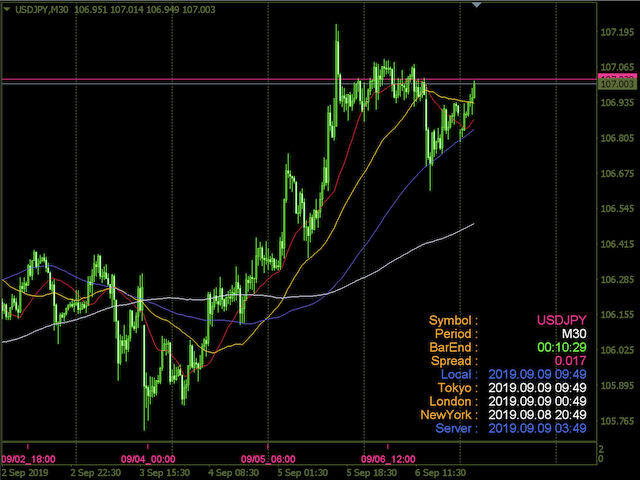
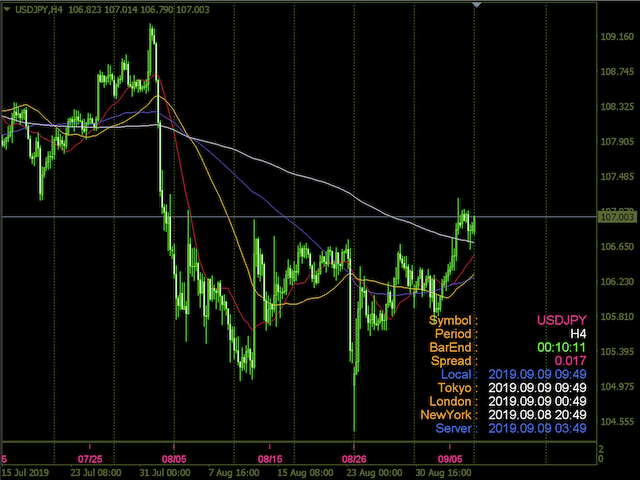
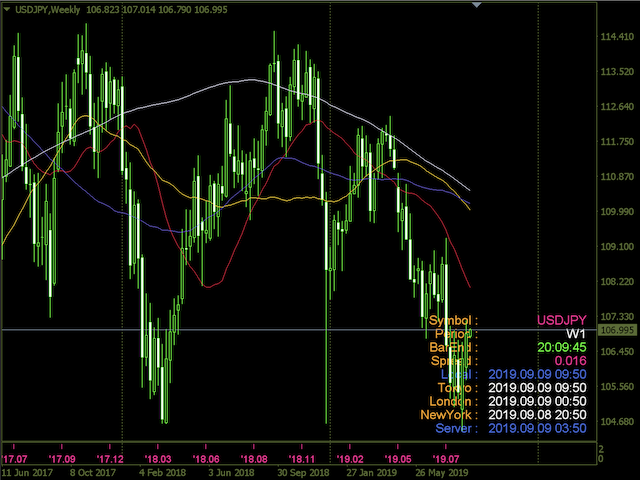
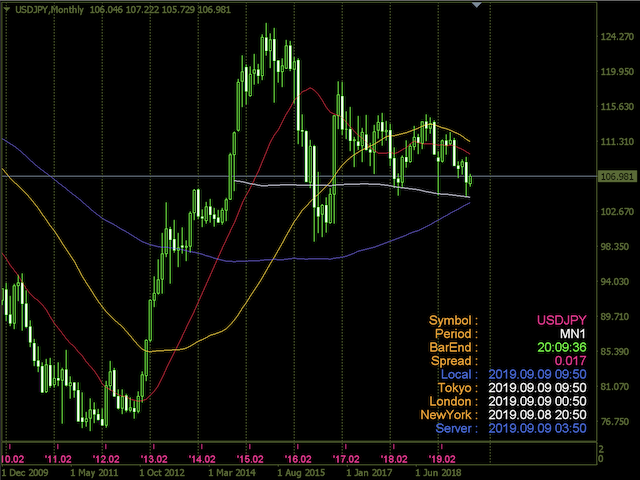
このインジケータは、勝つために必要な最低限のトレードインフォメーションをひとめでわかりやすいように表示します。
サブウインドウにはローカルタイムを表示し、メインチャートにはローカルタイムだけでなく、
-Symbol(通貨ペア)
-Period(時間足)
-BarEndTime(バー残り時間)
-Spred(スプレッド)
-TokyoTime(東京時間)
-LondonTime(ロンドン時間)
-NewYorkTime(ニューヨーク時間)
-ServerTime(サーバー時間)
を表示します。
メインチャートでのインフォメーション表示は、右上・右下・左上・左下の4箇所から選択可能です。