Wpr Mtf Mt5
- 指标
- 版本: 1.0
- 激活: 5

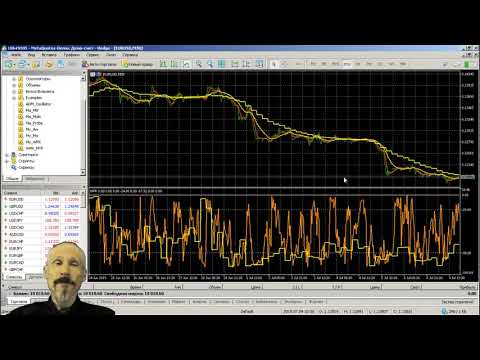
This is a multi-frame version of the standard indicator "Williams Percent Range", that was previously available only for Mt4.
Now there is a version for Mt5.
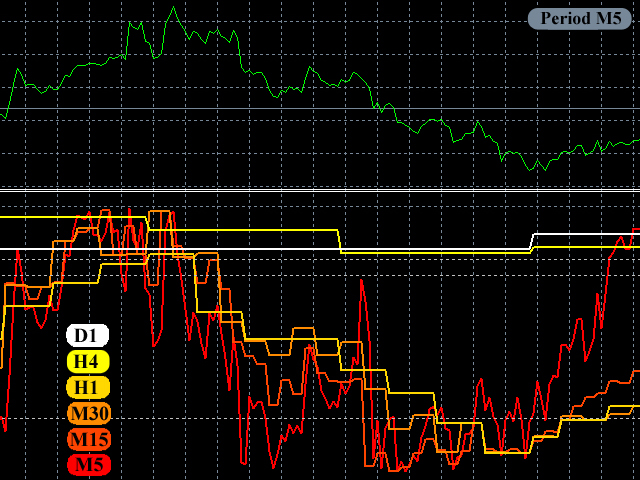
Like the other indicators of the author, it allows you to see any set of timeframes at the same time, and all they will be presented on a scale of the current price chart. You can choose any set of timeframes of the indicator and freely switch to the price chart in both the highter and the lower direction. For each price period, indicator charts will always be displayed at the correct scale.
Indicator is tested on Just2trade
Parameters:
- WPeriod - WPR calculation period.
- M1 - show/hide the minute chart
- M5 - show/hide the 5- minute chart
- M15 - show/hide the 15-minute chart
- M30 - show/hide the 30-minute chart
- H1 - show/hide the hourly chart
- H4 - show/hide the 4-hour chart
- D1 - show/hide the daily chart
- W1 - show/hide the weekly chart