Tendency Inside Bars

Description

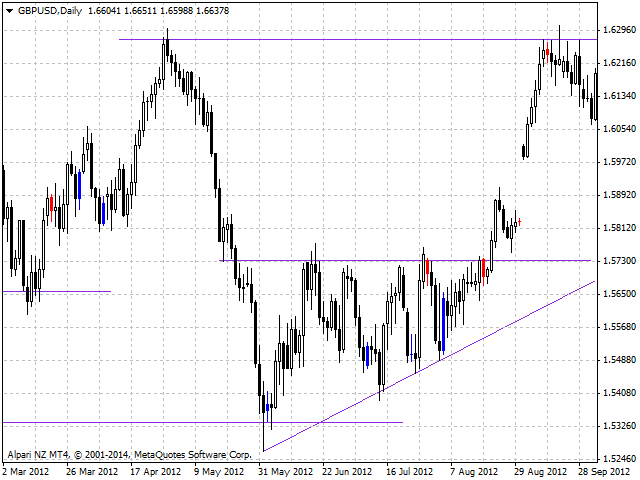
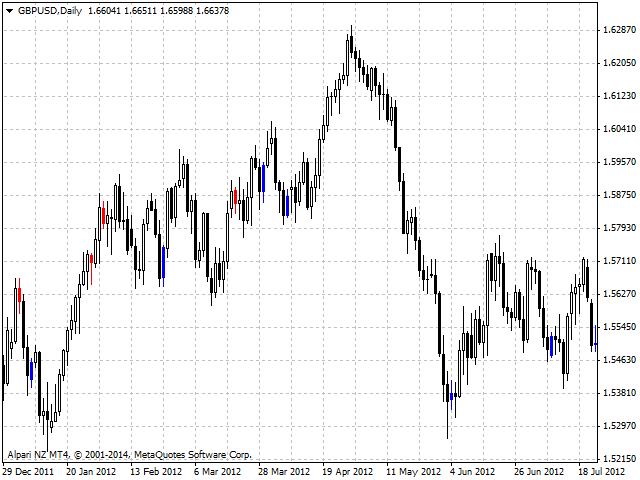
The indicator determines the appearance of internal bars on the chart, and paints them in accordance with the bullish and/or bearish mood.

The indicator is different from Inside Bar in the same way as Tendency Reversal Bars is different from Reversal Bars. In other words, the indicator defines the appearance of internal bars during a bullish or bearish trend rather than defining their single appearance.

The indicator can notify of the appearance of a formed internal bar by playing a beep, as well as display the time remaining until the end of the formation of the current bar in the format of <d:h:m:s, where:

  • < means the current bar.
  • d - days.
  • h - hours.
  • m - minutes.
  • s - seconds.

The bullish and bearish mood can be colored.


Input Parameters

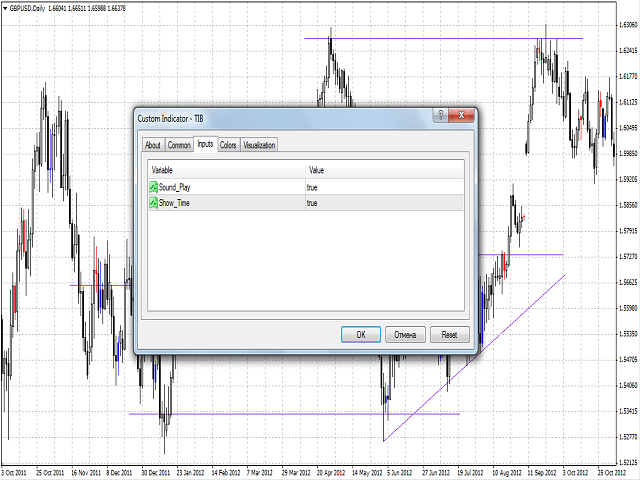
  1. Sound_Play - a flag that allows the sound notification.
  2. Show_Time - a flag that allows the display of time remaining until the formation of the current bar.


Use

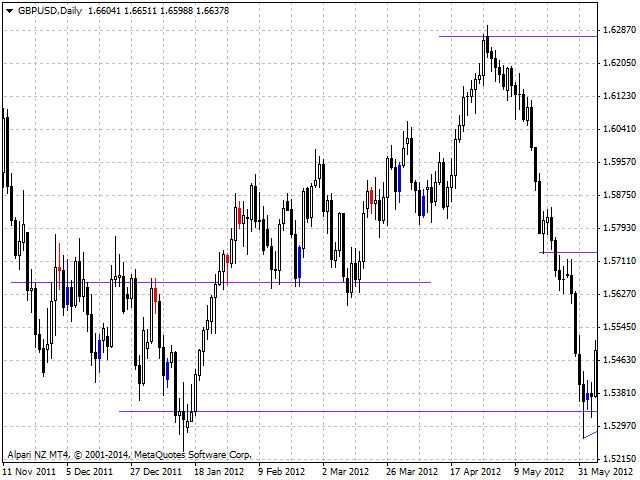
Appearance of an internal bar during a trend means that the trend is weakening and bulls and bears are in a temporary balance. This can be used as a signal for closing open positions, as well as for opening the positions opposite to the previous trend.

The indicator becomes more efficient if the following conditions are met:

  1. Closing positions or opening new ones near support/resistance levels, trend lines or Fibo levels.
  2. Opening positions within a day according to the bullish or bearish mood by the signal received from D1 timeframe.

See the screenshots for details. 

The indicator can be used for manual or automated trading within an Expert Advisor. For automated trading it can use values of any indicator buffer of type double: 0, 1, 2 or 3. The value must not be zero!
推荐产品
自适应图表垂直缩放 忘记频繁手动调整图表! 市场在变化 —— 图表也应该自动适应。 ScaleFix Smart Auto Scaling 是一款适用于 MetaTrader 4 的智能工具,可自动将价格保持在舒适的可视区域内: • 上方极值 —— 距离顶部边缘约 ~10%; • 下方极值 —— 距离底部边缘约 ~10%。 无论市场波动如何,您的图表始终保持整洁、专业且易于阅读。 为什么交易者选择 ScaleFix Smart Auto Scaling 节省注意力 在高强度交易过程中,每一秒专注都非常重要。 无需再在每次价格波动后手动调整图表缩放。 更舒适的分析体验 价格不再“贴”在图表边缘。 您可以更清晰地观察市场结构、动能、区域与形态。 特别适用于: 剥头皮交易 日内交易 Price Action 分析 支撑阻力位交易 多时间周期分析 专业级图表外观 您的交易终端将显得整洁且专业 —— 如同专业交易员和 Prop 团队所使用的界面。 工具功能 自动进行图表垂直缩放 保持上下最佳边距 实时运行 无需手动调整缩放(开启一次即可长期使用) 帮助您将全部注意力集中在市场本身 技术特点 安
Description  Fibo Retracement  is an indicator that automatically plots  Fibonacci  levels in the main chart based on Close prices , which distinguishes it from the Fibo Levels indicator that plots levels based on High/Low prices. Thus, using both indicators provides the trader with the opportunity of determining support and resistance zones by Fibonacci! The levels are calculated and plotted over a certain interval using the number of bars specified by the user. The user can display Fibonacci l
Description  Fibo Levels  is a color multicurrency/multi-symbol indicator that automatically plots Fibonacci   levels  on any of the following six standard indicators ( AD, OBV, MA, Momentum, ATR and StdDev ) in a separate window below the chart of the main financial instrument. It can be used with any broker, regardless of the name of a financial instrument used because the symbol name must be entered manually as an input parameter. If you enter a non-existent or invalid name of a financial ins
RRBCTC uses real Tick data to create custom Range, Time, Renko and Volume bar charts for MT4. Tick data use is RRBCTC unique feature, which allows highest quality charting of current and historical price movement. Custom inputs provide option to create range bars with sizes from 0.1 pip all the way to 100+ pip and time bars periods from second all the way to a month. Charts are updated with new data in real time, allowing user use of MT4 indicators and advisors (EA). RRBCTC greatly extends MT4 c
This indicator is a great utilities tools for Fibonacci Trader that draw their chart manually. This indicator do not draw any Fibonacci Retracement or Fibonacci Expansion. It is a utilities tool for modifying the Fibonacci level for Fibonacci object manually drawn on the chart. Just draw using the Fibonacci Retracement or other Fibonacci tool in MT4 as per normal. The select the Fibonacci you have just drawn. Make sure you have only 1 object selected. Then open up this Fibonacci Level Management
Description Bears CD HBT (Bears Convergence/Divergence High Bottom Top) is a universal analytical bears convergence/divergence indicator between a financial instrument and any of the twenty two standard indicators included in МT4 package. The indicator is the first out of the two possible versions (HBT and HTB) of the bearish convergence/divergence origins. Due to its multiple use feature, the indicator allows you to find convergences/divergences between the price and various standard indicators
The Find Levels utility scans the range of prices and bars indicated by you on the chart, finds the levels most often related to High and Low prices and provides a full report. The color of the level line depends on the number of touches and changes in the program settings. The level is drawn in the event that if the shadow of the High or Low candle was at least two touches during the period specified in the parameters. The characteristics of the candle, namely, what should be its parameters for
The   Five Minutes Strategy   EA is designed for trading binary options. EURUSD on the five-minute period is strongly recommended. Trading is performed by the opening prices based on the signals of the   Five Minutes   indicator. It requires at least 100 bars in history to operate. Input Parameters Initial Deposit - initial deposit. Lot Value - lot size. Lot Type - lot type: Fixed - fixed. Variable - variable. Last Lot Value - last lot value (used in cases when the EA is reattached) Day lot typ
FIBO Price Calculator 功能简介 1. 自动绘制斐波那契回调线 本指标可自动在MT4图表上绘制斐波那契回调线,助您快速识别潜在支撑和阻力位。 2. 自定义斐波那契数列 用户可自定义斐波那契数列的数值,指标会根据当前市场价格自动换算成相应价格水平。 3. 灵活调整指标窗位置 指标窗可放置在图表的四个角中的任意位置,方便用户根据个人喜好和交易习惯调整布局。 综上所述,本指标不仅能够帮助交易者自动绘制斐波那契回调线,还提供了自定义输入斐波那契黄金数列换算成价格以及自定义指标窗位置的功能,为交易者提供了更便捷、更灵活的技术分析工具。无论是初学者还是经验丰富的交易者,都能够通过本指标更好地把握市场趋势,提高交易成功率。
BONUS INDICATOR HERE :  https://linktr.ee/ARFXTools Trading Flow Using Fibo Eminence Signal 1️⃣ Wait for the Fibonacci to Auto-Draw The system automatically detects swings (from high to low or vice versa) Once the Fibonacci levels appear, the indicator sends an alert notification “Fibonacci detected! Zone is ready.” 2️⃣ Check the Entry Zone Look at the ENTRY LINE (blue zone) This is the recommended SELL entry area (if the Fibonacci is drawn from top to bottom) Wait for the price to enter
Bulls CD LBT Global  (Bulls Convergence/Divergence Low Bottom  Top   Global) is an analytical bulls convergence/divergence indicator (C, D or CD) between a financial instrument and 22 MT4 indicators working on all periods simultaneously. The indicator measures the power of CD for indicators and periods and is the first one out of the two possible versions (LBT and LTB). Features The analyzer is not a lagging one. It works by ticks and is able to show CD in the main window even in case the MT4 i
The PUA MultiType Pivot indicator is built on the daily chart of the previous day. The PUA MultiType Pivot indicator is one of the most popular tools in technical analysis, used by traders to identify potential reversal points in financial markets. This indicator constructs three types of Pivot points: Classic, Fibonacci, and Camarilla, each offering its unique approach to market analysis. The advantages of this indicator include: Simplicity and Clarity PUA MultiType Pivot provides clearly defi
Description  Fibo Levels is a color multicurrency/multi-symbol indicator that automatically plots  Fibonacci levels on a candlestick chart in a separate window below the chart of the main financial instrument. It can be used with any broker, regardless of the name of a financial instrument used because the symbol name must be entered manually as an input parameter. If you enter a non-existent or invalid name of a financial instrument, you will receive an error message saying that the specified f
RSI Global
Igor Semyonov
Description A universal indicator RSI together with moving averages based on it. Depending on the need, moving averages can be disabled. You can color the indicator lines and levels: lines of RSI, moving average lines and thresholds of overbought and oversold levels.   The indicator can be calculated as the standard one on the basis of a price or as a derivative on the basis of the following eighteen other indicators included in the standard package of the MT4 terminal: AD - an indicator of accu
Demark mtf
Sergey Fionin
該指標顯示德馬克模式並以箭頭和警報的形式給出交易信號。 在報價歷史上顯示 De Mark 行。 具有多幀。可以在較低的時間範圍內顯示較高時間範圍的 DeMark 模式。 具有顯示分形的可切換功能。 交易信號伴隨著聲音警報,並將它們發送到郵件和移動設備。 /////////////////////////////////////////////////////////////////////////////////////////////////////////// /////////////////////////////////////////////////////////////////////////////////////////////////////////// /////////////////////////////////////////////////////////////////////////////////////////////////////////////
Flat finder MT4
Yuriy Lyachshenko
该指标检测平仓,并在发现的区域画上一个彩色的矩形。 该指标的主要思想是,当价格填满图表上的某个区域时,检测出一个平盘。 输入参数: Color rectangle - 要着色的矩形的颜色。 Bars in rectangle - 矩形中允许的最小条数。 Density in % - 扁平的密度,设置为矩形区域的百分比。 __________________________________________________________________ __________________________________________________________________ ________________________
MamchenkoTrend Complex - высокоточный индикатор, показывающий смену тенденций на рынке. Индикатор не перерисовывает сигнал после закрытия свечи. Дает вам уровень стопа для вашей сделки по его сигналам. Отлично подходит для ручной торговли и в разработке в АТС (автоматические торговые системы)   Настройки можно использовать по умолчанию , а также подбирать самостоятельно . На скриншотах изображен один и тот же участок графика пары GBPUSD на тайме Н4 но с разными настройками . На первом рисунке зн
Olimpia Dragged Trends! This dashboard indicator is a visual tool which recognizes dragged trends of 28 pairs in a easy-to-read histogram. You will see a group of squares indicating the sum and average values of trends of the last "...." minutes for each square from L to A in a dragged way. "Dragged Way" means that regardless the hour of the day or opened or closed candle it always shows the present and the pastinformation. You can configure a sequence of numbers with values between 1 minute to
Description Bulls CD LBT (Bulls Convergence/Divergence Low Bottom Top) is a universal analytical bulls convergence/divergence indicator between a financial instrument and any of the twenty two standard indicators included in МT4 package. The indicator is the first out of the two possible versions (LBT and LTB) of the bullish convergence/divergence origins. Due to its multiple use feature, the indicator allows you to find convergences/divergences between the price and various standard indicators
External Range Liquidity - Market Structure Mapper Objectively reading market structure is the foundation of any successful trading strategy. However, manually identifying Swing Highs/Lows, Higher Highs (HH), or Lower Lows (LL) is often subjective and confusing, especially for developing traders. The External Range Liquidity indicator is your complete solution. This tool automatically detects and labels these crucial market structure points directly on your MT4 chart. It provides you with a clea
FREE
Auto Levels
Yaroslav Varankin
Auto Level this tool is able to determine the levels of support and resistance. search and display when the price has broken through the level and when it pushed off from it. the indicator can be useful if you use resistance support levels in your trading. or the highs and lows of the price, then it will greatly simplify your work and help you more quickly and more accurately determine the rebound or breakdown of the current trend or tendencies level. blue line bottom uptrend red line on top dow
BazeZone MT4
Stefan Van Dockum
Baze Zone is a configurable combination of tools/levels (MT5 version also available at MT5 section) : - Fib levels, 14, 23,50 - Fib Extension 27,61 - Pivot Points - Adds boxes to indicate range 'breakout' - ATR Range  - Prev Daily Candle Range - Shortcut keys to hide/show the lines (configurable) In short, use this tool to add some extra zones to you fib tool. And use the extra's in combination with the shortcut keys to keep your chart clean. You can drag the lines for the Fib Levels. The name
The correlation coefficient reflects the relationship between two values. It shows the dependence of changes in one value on changes in another. For example, from changes in the price of EURUSD and EURNZD. The correlation coefficient in trade, currency relations is constantly changing. Special indicators of correlation help to define it, trace changes, draw correct conclusions. One of them is the Hubbles Correlator indicator. The indicator allows you to simultaneously display several other char
Todo comerciante sabe que él o ella nunca deben arriesgar más del 5% (o 7%) por operación. Esta es una ley de administración de dinero y se debe calcular un tamaño de lote utilizable cada vez porque un comerciante debe usar un valor StopLoss diferente para diferentes niveles de negociación. Este indicador calculará un tamaño de lote apropiado para el momento en que lo colocará en el gráfico y cada vez arrastrará la "Línea de stop loss" en cualquier dirección. OFERTA POR TIEMPO LIMITADO: Todos
Fibo Bands
Igor Semyonov
5 (1)
Fibo Bands is an innovative indicator and an analyzer for trading in the current trend direction. The indicator builds a Fibonacci channel (bands), and consists of a trend line (middle line), channel bands, colored bars and reference information. After completion of the current bar, the trend line, the channel and the color of the bar are not redrawn. However, the channel width can be changed after a reset or restart of the indicator depending on volatility. The channel is built in accordance wi
Window Levels
Igor Semyonov
Description The indicator draws a layout as horizontal levels of round and/or half-round prices in a separate window below the main chart. The indicator may be used with any broker, irrespective of the name of the financial instrument since it is necessary to manually enter the name as an input parameter. If you enter a non-existent or incorrect name of a financial instrument, you will receive an error message that this financial instrument is unknown (does not exist). You can color the indicato
CCI Global
Igor Semyonov
5 (1)
Description A universal indicator CCI together with moving averages based on it. Depending on the need, moving averages can be disabled. You can color the indicator lines and levels: lines of CCI, moving average lines and thresholds of overbought and oversold levels.   The indicator can be calculated as the standard one on the basis of a price or as a derivative on the basis of the following eighteen other indicators included in the standard package of the MetaTrader 4 terminal: AD - an indicato
Mean Reversion Supply Demand Indicator Mean Reversion Supply Demand is the indicator to detect the important supply demand zone in your chart. The concept of supply demand trading relies on the quantity mismatching between buying and selling volumes in the financial market. Typically, supply demand zone serves to predict the turning point. The wave pattern, for any supply demand zone to work as an successful trade, looks like the price must touch the base zone, move away and then return to zone
​ Professional Trading Expert Advisor (EA) Description for MetaTrader 4 ​ Captivating Title: SmartStop & Trail Pro: Automated Risk Management and Profit Protection EA for MT4 ​️ Full Product Description: ​Are you looking for a powerful tool to completely automate risk management and profit protection for your trades on MetaTrader 4? ​SmartStop & Trail Pro is an advanced Expert Advisor (EA) designed to take over trade management immediately after any position is opened (either manually or b
Introduction to Chart Pattern MT Chart Pattern MT is a chart pattern scanner to detect the triangle pattern, falling wedge pattern, rising wedge pattern, channel pattern and so on. Chart Pattern MT uses highly sophisticated chart pattern detection algorithm. However, we have designed it in the easy to use with intuitive user interface. Chart Pattern MT will show all the patterns in your chart in the most efficient format for your trading. You do not have to do tedious manual pattern detection an
该产品的买家也购买
Exp COPYLOT CLIENT for MT4
Vladislav Andruschenko
4.69 (65)
MetaTrader 4 专业交易复制器 快速、专业、可靠的 MetaTrader 4 交易复制器。 COPYLOT 可在 MetaTrader 4 与 MetaTrader 5 终端之间复制外汇交易,并为不同账户类型和交易场景提供灵活的同步方案。 COPYLOT MT4 版本支持: MetaTrader 4 → MetaTrader 4 MetaTrader 5 Hedge → MetaTrader 4 MetaTrader 5 Netting → MetaTrader 4   MT5 版本 完整说明 + DEMO + PDF 如何购买 如何安装 如何获取日志文件 如何测试与优化 Expforex 的全部产品 您也可以使用 MetaTrader 5 版本,在 MetaTrader 5 → MetaTrader 5 和 MetaTrader 4 → MetaTrader 5 之间进行复制: COPYLOT CLIENT for MT5 COPYLOT 是一款专业级交易复制器,可稳定运行于 2、3 甚至 10 个终端之间。 支持从模拟账户和投资者密码账户进行复制 可同时运行在多个终端上
欢迎来到 Trade Manager EA——这是一个终极风险管理工具,旨在使交易变得更直观、精准和高效。它不仅仅是一个下单工具,而是一个用于无缝交易计划、仓位管理和风险控制的全面解决方案。不论您是新手交易员、资深交易员,还是需要快速执行的剥头皮交易员,Trade Manager EA 都可以满足您的需求,适用于外汇、指数、大宗商品、加密货币等各种市场。 借助 Trade Manager EA,复杂的计算已成过去。只需分析市场,在图表上用水平线标记入场、止损和止盈,设置您的风险水平,Trade Manager 就会立即计算出理想的头寸规模,并实时显示以点、账户货币计价的止损和止盈。每笔交易都得以轻松管理。 主要功能: 头寸规模计算器 :根据定义的风险瞬间确定交易规模。 简单的交易计划 :在图表上用可拖动的水平线直接计划交易,设置入场、止损和止盈。 实时显示 SL 和 TP :以账户货币、点或分显示止损和止盈,便于分析。 高级保护工具 盈亏平衡选项 : 基本盈亏平衡 :当您的交易达到设定水平时自动保护利润。 多级盈亏平衡 :设置多达 4 个级别以逐步保护利润。 尾随止损选项 : 基本尾随
Trade Assistant MT4
Evgeniy Kravchenko
4.43 (197)
它有助于计算每笔交易的风险,容易安装新的订单,具有部分关闭功能的订单管理, 7 种类型的追踪止损和其他有用的功能。 附加材料和说明 安装说明 - 应用程序说明 - 模拟账户应用程序的试用版 线条功能  - 在图表上显示开仓线、止损线、止盈线。 有了这个功能,就可以很容易地设置一个新的订单,并在开仓前看到它的附加特性。   风险管理  - 风险计算功能在考虑到设定的风险和止损单的大小的情况下,计算新订单的成交量。它允许你设置任何大小的止损,同时观察设定的风险。 批量计算按钮 - 启用 / 禁用风险计算。 在 " 风险 " 一栏中设置必要的风险值,从 0 到 100 的百分比或存款的货币。 在 " 设置 " 选项卡上选择风险计算的变量: $ 货币, % 余额, % 资产, % 自由保证金, % 自定义, %AB 前一天, %AB 前一周, %AB 前一个月。   R/TP 和 R/SL - 设置止盈和止损的关系。 这允许你设置相对于损失的利润大小。 例如, 1 : 1 - 这决定了 TP = SL 的大小。 2 : 1 - 这意味着 TP 是 SL 的两倍。 RR - 它禁用比率。  
Local Trade Copier EA MT4
Juvenille Emperor Limited
4.96 (110)
通过 Local Trade Copier EA MT4 获得非常快速的交易复制体验。它的简单1分钟设置,使您可以在同一台Windows计算机或Windows VPS上在多个MetaTrader终端之间复制交易,具有闪电般快速的复制速度,低于0.5秒。 无论您是初学者还是专业交易者, Local Trade Copier EA MT4 都提供了广泛的选项,可根据您的特定需求进行自定义。对于任何希望增加利润潜力的人来说,这都是终极解决方案。 今天就尝试一下,看看为什么它是市场上最快、最简单的贸易复印机! 提示: 您可以在您的模拟账户中下载并试用 Local Trade Copier EA MT4 模拟版: 这里 将下载的免费演示文件粘贴到您的 MT4 >> 文件 >> 打开数据文件夹 >> MQL4 >> 专家文件夹并重新启动您的终端。  免费演示版本每次可在 4 小时内发挥全部功能,仅限演示帐户。 要重置试用期,请转至 MT4 >> 工具 >> 全局变量 >> Control + A >> 删除。 请仅在非关键模拟账户上执行此操作,不要在挑战道具公司账户中执行此操作。 如果您无法在
Telegram to MT4 Multi-Channel Copier 可自动将您 Telegram 频道中的交易信号直接复制到 MetaTrader 4。无需机器人,无需浏览器扩展,无需手动复制。您在 Telegram 上收到信号,EA 会在几秒钟内在您的终端上开仓。 本产品包含两个组件:一个监听您 Telegram 频道的 Windows 应用程序,以及在您的 MT4 终端上执行信号的 EA。同时也提供 MT5 版本。 设置指南和应用程序下载: https://www.mql5.com/en/blogs/post/768988 工作原理 Windows 应用程序使用您自己的 API 凭据连接到 Telegram,而不是机器人。这意味着它可以读取您订阅的任何频道、群组或话题,包括私人和 VIP 频道。检测到信号后,它会进行解析并发送给 EA。EA 根据您的经纪商解析交易品种名称,基于您的风险设置计算手数,然后开仓。 整个过程都是自动的。您无需守在电脑前。 打开应用程序并登录 Telegram(仅第一次)。 选择要监听的频道或话题。 按下 Start。EA 会处理其余的一切。 支持的
TradePanel MT4
Alfiya Fazylova
4.84 (95)
交易面板是一款多功能交易助手。该应用包含超过50种手动交易功能,并允许您自动执行大多数交易任务。 在购买之前,您可以在演示账户上测试演示版本。下载用于演示账户的试用版应用程序: https://www.mql5.com/zh/blogs/post/762579 。 完整说明 这里 。 贸易. 只需单击一下即可执行交易操作: 打開掛單和頭寸,並自動計算風險。 一鍵打開多個訂單和頭寸。 打開訂單網格。 按組別關閉掛單和頭寸。 反轉頭寸方向(關閉買入>打開賣出,關閉賣出>打開買入)。 鎖定頭寸(通過開啟缺少的頭寸,使買入和賣出頭寸的數量相等)。 一鍵部分關閉所有頭寸。 將所有頭寸的止盈和止損設置在同一價格水平。 將所有頭寸的止損設置在盈虧平衡水平。 開倉時,可使用以下功能: 在多個訂單或倉位之間分配計算出的數量(在單擊一次時開啟多個訂單和倉位)。 在開啟訂單前在圖表上可視化交易水平。 僅在當前點差不超過設定值時才開啟倉位。 止盈和止損之間的自動比例。 虛擬止損和止盈。 自動將止損和止盈的大小增加為當前點差的大小。 基於ATR指標讀數計算止盈和止損。 設置掛單的到期日期。 為掛單設置追蹤(掛單
CloseIfProfitorLoss with Trailing
Vladislav Andruschenko
4.87 (31)
Close If Profit or Loss with Trailing for MetaTrader 4 — 按总盈利或总亏损自动平仓 这是一款适用于 MetaTrader 4 的实用型交易管理工具。当总盈利或总亏损达到您设置的水平时,EA 可以自动关闭选定的持仓。 Expert Advisor 会监控当前交易,计算浮动盈亏,并可使用利润跟踪功能,帮助交易者比手动操作更快地管理风险和锁定结果。 MetaTrader 4 仍然被大量手动交易者、剥头皮交易者、网格交易者和 EA 用户使用。但 MT4 本身没有一个方便的内置工具,可以按一组订单的总结果来自动平仓。这个工具正是为了解决这个问题。 Close If Profit or Loss with Trailing 可用于手动交易,也可以与其他 Expert Advisors、网格系统、加仓策略、恢复策略和多品种交易一起使用。您设置规则,EA 负责监控结果,并在条件达到时执行平仓。 MT5 版本 | 完整说明 + DEMO + PDF | 如何购买 | 如何安装 | 如何获取日志文件 | Expforex 的所有产品 为什么 MT4
跟单->方便快捷的界面交互,用户上手即用       ->>>> 推荐在windows电脑,或者VPS Windows上使用 特色功能: 多样化个性跟单设置: 1.对不同的信号源可以设置不同的手数模式 2.不同的信号源分别设置正向反向跟单 3.信号分别设置注释 4.是否根据合约手数校准手数 多样化个性跟单设置2: 1.对不同的品种可以设置不同的手数模式 2.不同的品种分别设置正向反向跟单 3.信号分别设置注释 4.是否根据合约手数校准手数 注释过滤,MAGIC过滤,信号手数过滤,本地品种过滤 净持仓模式(该模式下手数计算仅支持倍率) 工作时间设置 反向同步接收端的平仓 订单绑定功能:任意订单可以绑定到设置信号源订单上 (双击表格更改) 账户风险控制  基本功能: 跟单正常交互速度0.5s以下 自动检测信号源,并显示信号源账号列表 自动匹配品种,不同平台常用交易品种(后缀不同等特殊情况)95%自动匹配,基本无需手动设置,品种映射表可随意双击更改对应品种.(映射表具有快速搜索品种功能) 4种手数计算模式(1.倍率 2.固定手数 3.自适应资金风险 4.源账户资金比例风险) 特殊手数模式
News Filter EA: Advanced Algo Trading Assistant News Filter EA is an advanced algo trading assistant designed to enhance your trading experience. By using the   News Filter EA , you can integrate a Forex economic news filter into your existing expert advisor, even if you do not have access to its source code. In addition to the news filter, you can also specify   trading days   and   hours   for your expert. The News Filter EA also includes   risk management   and   equity protection   features
Trader Evolution MT4
Siarhei Vashchylka
5 (2)
" Trader Evolution " - A utility designed for traders who use wave and technical analysis in their work. One tab of the utility is capable of money management and opening orders, and the other can help in making Elliott wave and technical analysis. Manual (Be sure to read before purchasing) | Version for MT5 Advantages 1. Trading in a few clicks. Immediate and pending orders are available in the panel 2. Money management. The program automatically selects the appropriate lot size 3. Simplifies
Grid Manual MT4
Alfiya Fazylova
4.71 (17)
Grid Manual是一个交易面板,用于处理订单网格。 该实用程序是通用的,具有灵活的设置和直观的界面。 它不仅可以在亏损方向上设置订单网格,还可以在盈利方向上设置订单网格。 交易者不需要创建和维护订单网格,实用程序会这样做。 打开一个订单就足够了,Grid manual会自动为它创建一个订单网格,并伴随它直到非常关闭。 完整说明和演示版 此處 。 该实用程序的主要特性和功能: 伴隨以任何方式打開的訂單,包括從移動終端打開的訂單。 適用於兩種類型的網格:“限制”和“停止”。 使用兩種方法計算網格間距:固定和動態(基於 ATR 指標)。 允許您更改未結訂單網格的設置。 顯示圖表上每個網格的盈虧平衡水平。 顯示每個網格的利潤率。 允許您一鍵關閉網格中的盈利訂單。 讓您一鍵關閉每個訂單網格。 允許您對訂單網格應用追踪止損功能。 允許您在訂單網格上應用將訂單網格的止損轉移到盈虧平衡水平的功能。 相對於訂單網格的盈虧平衡水平自動重新排列止盈(僅在限價網格模式下,距離取決於所選的計算類型:“保守”或“激進”)。 最多可管理 20 個訂單網格,每個網格最多可包含 100 個訂單。
Auto Trade Copier
Vu Trung Kien
4.76 (85)
自动交易复制器旨在以 100% 的准确度在多个 MT4/MT5 账户/终端之间复制交易。提供商和接收方账户必须位于同一台 PC/VPS 上。使用此工具,您可以将交易复制到同一台 PC/VPS 上的接收方账户。所有交易操作都将从提供商复制到接收方,不会有任何延迟。此版本仅适用于 MT4 账户。对于 MT5 账户,您必须使用 MT5 的自动交易复制器。参考: 参考: 对于 MT4 接收器,请下载“Trade Receiver Free” 这里 . 对于 MT5 接收器,请下载“Trade Receiver Free MT5”  这里 . 对于同一台 PC/VPS 上的 MT5 提供商,请检查“Auto Trade Copier MT5” 这里 . 如果您需要通过互联网在不同的 PC/VPS 上进行账户复制,请查看“Trade Copier Pro” 这里 . 如果您需要通过互联网在不同的 PC/VPS 账户之间进行复制,且接收方数量不限,请查看“无限交易复制器专业版” 这里 . 以下是重点功能 在 MT4 和 MT5 账户之间复制。 一个提供商可以将交易复制到多个接收者的账户。 一个提
MT4 至 Telegram 信号提供者 是一款易用、可完全自定义的工具,它使发送信号到 Telegram 成为可能,将您的账户变成信号提供者。 消息的格式 可以完全自定义! 但是,为了简便使用,您也可以选择一个预设模板,并能够启用或禁用消息的特定部分。 [ 演示 ]  [ 手册 ] [ MT5 版本 ] [ Discord 版本 ] [ Telegram 频道 ]  New: [ Telegram To MT5 ] 设置 可通过 用户指南 获取逐步说明。 无需了解 Telegram API;开发者提供所需的一切。 主要特性 自定义发送给订阅者的订单详情的能力 您可以创建分层订阅模型,例如铜牌、银牌、金牌。金牌订阅可获得所有信号等。 按订单号、符号或备注过滤订单 包括执行订单的图表的屏幕截图 在发送的屏幕截图上绘制已关闭的订单,以便额外验证 推迟发送新订单消息的可能性,以便在发送前对位置进行调整 订单详情的全透明度: 新的市场订单 *附带屏幕截图 订单修改(止损、获利点) 已关闭订单 *附带屏幕截图 部分关闭订单 ** 新的挂起订单 修改的挂起订单(进场价格) 挂起订单激活(
TPSpro Risk Manager
Roman Podpora
3.67 (3)
TPSpro 风险管理器   是一个独特的专业风险控制系统,适用于任何培训和任何资本的交易者。让您避免交易中的损失和交易中的严重错误。 TPSpro 风险管理器对于风险管理是必要的,主要是对于剥头皮交易者和日间交易者而言,但任何交易风格的交易者都可以成功使用。 该面板有 3 列,每一列都包含有用的信息。 第一列显示截至当月初的账户信息,即以百分比和存款币种显示总体结果。 第二列显示设置中指定日期的风险。 第三列显示当前账户情况。 如果一天超过规定的风险或超过订单数量,顾问将关闭所有订单,并且不允许开设新订单,从而保护交易者免受“情绪交易”的影响。 “风险管理器”允许您根据以下参数控制交易: 每日损失限额 余额损失限额 交易数量限制 单一方向交易数量限制(网格保护) 连续亏损交易后被迫止损 连续两天亏损后,交易将被锁定一天 风险管理系统允许交易者: 保持每日利润 在线查看您的交易统计数据 理顺交易纪律,显着提高盈利能力(摆脱“倾斜”和“网格”) 查看当前资金并考虑经纪佣金 为了使风险经理能够满负荷工作,它必须位于远程 VPS 或任何其他偏远的地方,在情绪爆发时交易者无法快速到达并干扰
The product will copy all telegram signal to MT4   ( which you are member  ) , also it can work as remote copier.  Easy to set up, copy order instant, can work with almost signal formats, image signal, s upport to translate other language to English Work with all type of channel or group, even channel have "Restrict Saving Content", work with  multi channel, multi MT5 Work as remote copier: with signal have ticket number, it will copy exactly via ticket number. Support to backtest signal. How to
试用版下载 Copy Cat More (跟单猫) MT4 交易跟单器 (Trade Copier) 不仅仅是一个简单的本地交易跟单器;它是一套 完整的风险管理与执行框架 (risk management and execution framework), 专为当今的交易挑战而设计。从自营公司 (prop firm) 挑战到个人投资组合管理,它凭借 稳健的执行、资金保护、灵活的配置和先进的交易处理的结合,适应各种情况。 该跟单器同时支持   主控端 (Master,发送方) 与 受控端 (Slave,接收方)   两种模式,可实时同步市价单与挂单、交易修改、部分平仓以及对锁平仓 (Close By) 操作。它兼容模拟与真实账户、交易或投资者登录,并通过持久化交易记忆 (Persistent Trade Memory) 系统确保恢复——即使 EA、终端或 VPS 重启也不例外。可借助唯一 ID 同时管理多个主控端与受控端,跨经纪商差异则通过前缀/后缀调整或自定义品种映射自动处理。 试用版:  先试用看看 :   你可以从下方链接下载并体验   Copy Cat More (跟单猫
什么是 Telegram to MT4 Pro? Telegram to MT4 Pro 可将来自私人、公开和受限 Telegram 频道和群组的信号自动复制到您的 MetaTrader 4 账户。 Telegram to MT4 Pro 是一款专业的信号复制器,可将任何 Telegram 频道或群组中的交易信号实时自动复制到您的 MetaTrader 4 账户,并对每一笔交易提供完整控制。 该系统由两个协同工作的部分组成: 此 Expert Advisor — 安装在您的 MT4 图表上以执行交易 配套桌面应用程序 — TelegramMT4Pro.exe — 连接到 Telegram 并将信号桥接到 EA 您可以同时将多个 Telegram 信号提供者连接到多个 MT4 账户。每个账户和每个提供者的所有设置都可以单独配置。 注意:系统自动运行。无需在 MetaTrader 内进行手动连接设置。 系统要求 项目 要求 操作系统 Windows 10 或更高版本 MetaTrader MetaTrader 4(任何经纪商) 配套应用程序 TelegramMT4Pro.exe — 必须在
EasyInsight AIO MT4
Alain Verleyen
4 (2)
EASY Insight AIO – 全能智能交易一站式解决方案 概述 想象一下,您可以在几秒钟内扫描整个市场——外汇、黄金、加密货币、指数,甚至股票——无需手动筛选图表、繁琐安装或配置指标。 EASY Insight AIO 是您专为 AI 交易打造的即装即用数据导出工具。它将整个市场快照一次性输出为简洁的 CSV 文件,直接支持 ChatGPT、Claude、Gemini、Perplexity 等各类 AI 平台的即时分析。 无需窗口切换,无需图表叠加,也没有任何杂乱。只需纯净、结构化的数据自动导出,让您专注于基于数据的高效决策,无需再盯盘耗时。 为什么选择 EASY Insight AIO? 真正的一体化 • 无需设置,无需安装指标,无图表叠加。只需安装、运行并导出——就是这么简单。 多资产全覆盖 • 扫描分析外汇、金属、加密货币、指数、股票——您的券商所能提供的一切市场。 AI 专属数据导出 • 高度结构化、针对 AI 优化的 CSV 文件,直接适配主流智能工具和平台。 完整导出内容: • 三个可选周期的货币强度分析 • 净多头头寸变化体现市场情绪 • 成交量变化、
Telegram to MT4 Coppy
Sergey Batudayev
4.09 (11)
Telegram 到 MT4: 终极信号复制解决方案 使用 Telegram 转 MT4 简化您的交易流程,这款先进的实用程序旨在将交易信号直接从 Telegram 频道和聊天复制到您的 MetaTrader 4 平台,无需 DLL 文件。这款强大的解决方案确保信号执行的无缝衔接,拥有无与伦比的精度和丰富的自定义选项,从而节省您的时间并提高您的效率。 [ Instructions and DEMO ] 主要特点 直接 Telegram API 集成 通过电话号码和安全码进行身份验证。 使用用户友好的 EXE 桥轻松获取和管理聊天 ID。 添加、删除和刷新多个频道/聊天以同时复制信号。 使用高级过滤器进行信号解析 跳过包含自定义例外词(例如“报告”、“摘要”)的不需要的信号。 支持灵活的 SL 和 TP 格式:价格、点数或点数。 当信号指定点而不是价格时自动计算入场点。 订单定制和灵活性 使用多种模式定制订单规模:固定手数、动态手数(% 风险)或特定符号手数。 使用信号数据或自定义参数调整 SL/TP。 配置滑点、挂单到期和重试设置以实现完美执行。 综合符号管理 排除特定符号或匹配自定义
VirtualTradePad mt4 Extra
Vladislav Andruschenko
4.85 (61)
一键交易的交易面板。处理头寸和订单!通过图表或键盘进行交易 交易小组进行人工交易。您可以从图表(图表窗口)或键盘进行交易。打开和关闭,反向和锁定。处理职位和订单! МetaТrader4中主要订单的交易控制面板:买入,卖出,买入,买入,卖出,卖出限制,收盘,删除,修改,追踪止损,止损,止损。 全新高级版本现已推出: 使用   VirtualTradePad PRO SE   升级您的交易流程 — 适用于   MetaTrader 5   和   MetaTrader 4   的新一代专业交易面板。 MT5版本 详细描述 +DEMO +PDF 如何购买 如何安装    如何获取日志文件    如何测试和优化    Expforex 的所有产品 从符号窗口交易并从键盘交易! 您正在为MetaTrader 4终端提供一个独特的插件 - 虚拟控制面板VirtualTradePad。 Description on English 注意!如果您想学习如何交易 策略测试器  ,请查看我们的免费 TesterPad 实用程序 VirtualTradePad在“  MQL5语言最佳图形面板  ”竞
神速EA跟单(TradeMirror)是一款MT4/MT5平台的订单复制软件。 使用教程 请点击 神速EA跟单使用教程 链接以查看更多使用教程 为什么选择神速EA跟单 我们深知对于金融软件而言安全、稳定和隐私的重要性,因此我们在细节处对这三大要素进行了额外的加固: 提供用户友好的图形界面,操作简单易用 注重隐私安全,适合对订单分发有隐私要求各种金融场景 精准复制订单,毫秒级分发 支持全平台,MT4/MT5全面覆盖 智能感知系统状态,邮件通知守护交易安全 核心功能列表 对于跟单软件而言,功能并不是越多越好的,因此经过严谨的需求分析,我们对程序进行了精简,并最终保留了如下核心功能: 多重连接 邮件通知 手数缩放 信号过滤 反向跟单 重置止盈/止损 免费演示 在购买Trademirror之前,你总是可以尝试免费演示。 点击本页面上的免费演示按钮 点击是的,我有Metatrader 4/5 允许浏览器打开Mt4/5 在Mt4/5中,找到专家顾问/市场/TradeMirror,打开它并点击测试 启用复盘显示(否则你将看不到GUI界面)。 点击开始 现在你可以在可视化图表上看到TradeMirro
RS Trade Copier - 超快 本地跟单系统,配备 真正的 图形界面。别再手动输入账号了。告别200多个晦涩的参数设置。 一款可靠且灵活的工具,用于在 MT4 和 MT5 多个终端之间复制交易操作。适合专业交易员、信号服务商以及个人投资者使用。能够以高精度和低延迟将一个或多个信号源(Provider)的 交易操作同步 到一个或多个接收端(Client)。支持简单自动配置和高级手动设置。不会干扰手动或其他 EA 开的订单。完全 在 MT4 本地运行 ,无需第三方服务器。 RS Trade Copier 与其他解决方案的对比 RS Trade Copier 其他解决方案 设置 可视化分步向导。 设置大约需要 1 分钟。 200 多个晦涩的输入参数。 设置大约需要 20 分钟。 速度 异步交易操作。* 批量平仓 50 个头寸仅需 ~1 秒。 缓慢的顺序执行。 批量平仓 50 个头寸需要约 25 秒。 界面 真正的图形界面,支持 11 种语言的工具提示。 无需手册即可上手。 EA 属性中“输入参数”选项卡下的长长参数列表。 需要阅读所有文档。 批量操作 完全支持。 接收端上的批量平仓
Trade Copier Global
Laszlo Tormasi
5 (15)
Trade Copier Global: The name speaks for itself. This copier allows you to copy orders between MT4 terminals even if they are not installed on the same computer. Features Copying trades between MT4 terminals around the world with a short delay. Automatically recognizes symbol prefixes. Can connect many Slaves to the same Master. Supports pending and market orders. Supports partial order close (with limitations, see below) Can send messages and notifications to the Slaves from the Master Several
Candlestick Pattern Scanner is a multi-timeframe and multi-symbol dashboard and alert system that checks all timeframes and currency pairs for different candlestick patterns that are formed in them. Scanner is integrated with support and resistance zones so you can check the candlestick patterns in the most important areas of the chart to find breakout and reversal patterns in the price chart. Download demo version   (works on M30,D1,W1 timeframes and 20 symbols of Market Watch window) Read the
立即在一張圖表上查看按日和按週的已平倉交易歷史記錄、當前未平倉交易以及外匯風險敞口!使用熱圖來識別有利可圖的交易以及您交易組合中的當前虧損情況。 快速關閉按鈕 使用快速關閉按鈕可以關閉單一符號的每筆交易、全部關閉單筆交易,或點擊按鈕以取得部分利潤或損失。不再需要在清單中尋找交易並研究如何關閉部分交易。儀表板還會顯示您在交易外匯對時目前對每種貨幣符號的風險敞口,這可以幫助您識別重大新聞事件發生前可能過度暴露的領域。您可以使用按鈕在新聞發布前立即快速降低您的風險,或者如果新聞已經發生並為您帶來利潤,只需單擊即可快速獲得該利潤! 開放交易熱圖 交易熱圖是一種視覺化工具,專為使用頭寸交易或波段交易策略的交易者設計,使用美元成本平均法來擴大和縮小交易規模。您可以快速識別您的投資組合中可以存入的單一交易,以及您可以部分平倉的虧損交易。只需使用全部或部分關閉按鈕即可立即賺錢並降低風險。 快速識別控制回撤的機會 虧損控制切換「D 按鈕」將突出顯示您的投資組合中所有虧損高於每個交易符號平均價格的交易。這是透過在所有符號的單一交易周圍添加一個矩形來實現的,這樣您就可以看到首先要關注哪些交易。 這使
Простая в управлении Торговая панель обеспечит безопасную торговлю. Вычислит объём сделки от заданного уровня Stop Loss и величины убытка. Поможет рассчитать сейф, и в ноль закрыть неверную сделку. Интуитивно понятный интерфейс делает панель удобной в управлении, освобождая внимание трейдера для принятия решения о входе в сделку. Программа сделает все расчёты за вас. Поэтому работа с помощью панели Снайпер - оптимальное решение для торговли с соблюдением Мани-менеджмента. А это главный ключ к по
Trade copier MT4
Alfiya Fazylova
4.56 (32)
Trade Copier 是一种专业实用程序,旨在复制和同步交易账户之间的交易。 复制发生从供应商的帐户/终端到收件人的帐户/终端,安装在同一台计算机或 vps 上。 促销活动 - 如果您已经购买了“Trade copier MT5”,您可以免费获取“Trade copier MT4”(用于 MT4 > MT5 和 MT4 < MT5 的复制)。欲了解更多详细条款,请通过私人消息与我们联系! 在购买之前,您可以在演示帐户上测试演示版本。 演示 这里 。 完整说明 这里 。 主要功能和优点: 支持复制MT4>MT4、MT4>MT5、MT5>MT4,包括МТ5 netting账户。 供应商和收件人模式在同一产品中实现。 简单直观的界面,允许您直接从图表中实时控制复制。 连接中断或终端重新启动时不会丢失设置和位置。 允许您选择要复制的符号,也可以替换接收者的符号,例如 EURUSD> USDJPY。 支持回拷贝。 能够仅复制某些订单。 允许您设置开仓交易价格的最大差异和最大时间延迟。 正确复制部分订单关闭的执行。 计算复制手数的几种方法。 同步止盈和止损。有几种方法可以计算它们的位置。 支持
Close by percentage MT4
Konstantin Kulikov
5 (1)
Hello friends. I wrote this utility specifically for use in my profile with a large number of Expert Advisors and sets ("Joint_profiles_from_grid_sets" https://www.mql5.com/en/blogs/post/747929 ). Now, in order to limit losses on the account, there is no need to change the "Close_positions_at_percentage_of_loss" parameter on each chart. Just open one additional chart, attach this utility and set the desired percentage for closing all trades on the account. The utility has the following function
Drawdown Protector MT4
Konstantinos Kalaitzidis
5 (2)
回撤保护器用于管理您所需的最大每日回撤。对于交易者来说,这是一个非常有价值的工具,特别是对于自营公司交易者来说,你需要小心回撤限制。  它是一种有效的 EA,易于用于股本回撤管理目的。 当浮动资产(而非余额)超过您设置的每日损失限额时,它会阻止新交易并关闭现有交易。此外,您还可以为单笔交易设置最大损失限额,如果超过该限额,则会阻止交易直到下一个日历日。 用户插入 3 个参数的值: 每日损失限额(以美元为单位): 以名义货币计的最大损失(我使用“$”仅用于示例目的)。这是 账户余额 名义值允许的最大提款额 。如果超过,EA 将阻止交易直到第二天。 每笔交易的损失限额(以美元为单位):  以名义货币计算的最大损失(我使用“$”仅用于示例目的)。这是 单笔交易 名义价值允许的最大回撤 。如果超过,EA 将阻止交易直到第二天。 (如果您将此参数的值保留为零 (0),EA 交易将不会考虑该值) 每日利润限额(以美元为单位): 如果您希望在获胜时避免过度交易,您可以设置每日利润限额,之后 EA 将在当天剩余时间阻止交易。据观察,有些交易者贪婪,为了寻求更多利润,他们也失去了最初的利润!这个参数
X2 Copy MT4
Liubov' Shkandrii
快速。精准。创新。技术驱动。使用革命性的 X2 Copy MT4 体验即时交易复制。只需 10 秒简单设置,您将获得一个强大的工具,用于在单台计算机或 Windows VPS 上的 MetaTrader 终端之间以空前的速度同步交易。 无论您是管理多个账户、跟随信号还是扩展策略,X2 Copy MT4 都能以前所未有的精度和控制力适应您的工作流程。使用最技术驱动的交易复制解决方案,更快、更可靠地工作。尝试免费试用版,在您的系统上测试其速度。 *重要提示:使用MT5终端需要单独的X2 Copy MT5版本 X2 Copy MT4/5 设置和功能说明 | 如何安装 X2 Copy 试用版 功能特点 高速复制 — 交易传输时间小于0.1秒 全面支持所有复制类型:MT4>MT4, MT4>MT5, MT5>MT4, MT5>MT5 10秒即时设置,界面直观 24/7稳定运行 — 与Windows PC和Windows VPS完全兼容 灵活复制于任何账户类型之间:所有经纪商均可进行真实>真实、真实>模拟、模拟>真实、模拟>模拟账户复制 多通道复制 — 支持从一个或多个发送账户复制到一个或多个接收
作者的更多信息
Reversal Bars
Igor Semyonov
Description The indicator determines the appearance of the bars that signal of a reversal of current local moods and plays a beep. It also paints these bars in accordance with the bullish and/or bearish priority. You can select the color for bullish and bearish moods. Inputs Sound_Play - a flag that allows the sound notification. Use Detection of the reversal bar can be a signal to perform appropriate trading activities.  The indicator can be used for manual or automated trading in an Expert A
Main Candles
Igor Semyonov
The indicator detects the following types of Japanese candlesticks: Doji, Hammer and/or Hanging Man, Shooting Star and/or Inverted Hammer, Spinning Top, Maribozu. The indicator is intended for manual and/or automated trading within an Expert Advisor. There is a possibility to choose colors for bullish and bearish candlesticks. For automated trading, use any indicator buffer of the double type: 0, 1, 2 or 3, whose value is not zero!

The indicator is intended for detecting big (long) and/or small (short) candlesticks. There is possibility of coloring the bullish and bearish candlesticks. The indicator can be used for manual and/or automated trading within an Expert Advisor. The indicator data that can be used for automated trading can be taken from one of four buffers of the double type: 0, 1, 2 or 3. Values must not be equal to zero. 
The indicator of DeMark fractals. The indicator can be drawn on the basis of price data and on the basis of a moving average. There is a possibility to color the up and down fractals. The indicator can be used for manual and for automated trading within an Expert Advisor. For automated trading, use any indicator buffer of the double type: 0 - up fractals, 1 - down fractals! Values of the buffers must not be equal to zero.  A moving average is drawn on the basis of input parameters: Calc_Method 
Stochastic Global
Igor Semyonov
4 (1)
Description A universal colored indicator Stochastic. The rising and falling lines and the levels of the indicator can be colored.   The indicator can be calculated as the standard one on the basis of a price or as a derivative on the basis of the following nineteen other indicators included in the standard package of the MetaTrader 4 terminal: AD - an indicator of accumulation and distribution of volume. OBV - On Balance Volume. Volume - tick volume indicator. AC - indicator of acceleration. AO
Description A universal colored indicator MACD Histo. The rising and falling of the indicator histogram can be colored.   The indicator can be calculated as the standard one on the basis of a price or as a derivative on the basis of the following twelve other indicators included in the standard package of the MetaTrader 4 terminal: AD - an indicator of accumulation and distribution of volume. OBV - On Balance Volume. Volume - tick volume indicator. Force - Force Index indicator. MFI - Money Flow
Description A colored universal indicator MACD Line (MA convergence-divergence indicator, shown as a histogram). The rising and falling of the indicator histogram can be colored. The indicator can be calculated as the standard one on the basis of a price or as a derivative on the basis of the following twelve other indicators included in the standard package of the MetaTrader 4 terminal: AD - an indicator of accumulation and distribution of volume. OBV - On Balance Volume. Volume - tick volume i
RSI Global
Igor Semyonov
Description A universal indicator RSI together with moving averages based on it. Depending on the need, moving averages can be disabled. You can color the indicator lines and levels: lines of RSI, moving average lines and thresholds of overbought and oversold levels.   The indicator can be calculated as the standard one on the basis of a price or as a derivative on the basis of the following eighteen other indicators included in the standard package of the MT4 terminal: AD - an indicator of accu
CCI Global
Igor Semyonov
5 (1)
Description A universal indicator CCI together with moving averages based on it. Depending on the need, moving averages can be disabled. You can color the indicator lines and levels: lines of CCI, moving average lines and thresholds of overbought and oversold levels.   The indicator can be calculated as the standard one on the basis of a price or as a derivative on the basis of the following eighteen other indicators included in the standard package of the MetaTrader 4 terminal: AD - an indicato
Description A multi-purpose multi-colored/multi-symbol indicator, which is a set of standard tools from the MetaTrader 4 terminal. The difference is that below the basic price chart it allows to calculate and build in a separate window any of the twenty indicators in a colored form, painting bulls and bears in different colors, for any financial instrument in accordance with the list below:  AD - an indicator of accumulation and distribution of volume. OBV - On Balance Volume. Force - Force Inde
AO Global
Igor Semyonov
Description A colored universal indicator AO (Awesome Oscillator). The rising and falling of the indicator histogram can be colored.   The indicator can be calculated as the standard one or as a derivative on the basis of the following eleven other indicators included in the standard package of the MetaTrader 4 terminal: AD - an indicator of accumulation and distribution of volume. OBV - On Balance Volume. Volume - tick volume indicator. Force - Force Index indicator. MFI - Money Flow Index. ATR
Description A colored universal indicator MACD Classic (MA convergence-divergence indicator) that combines two indicators: MACD Line and MACD Histo. The rising and falling lines, the signal line and the indicator histogram can be colored. The indicator can be calculated as the standard one on the basis of a price or as a derivative on the basis of the following twelve other indicators included in the standard package of the MetaTrader 4 terminal: AD - an indicator of accumulation and distributio
Description The universal colored multicurrency/multisymbol indicator MACD Classic, consisting of two MACD indicators: MACD Line and MACD Histo. The indicator may be used with any broker, irrespective of the name of the financial instrument since it is necessary to manually enter the name as an input parameter. If you enter a non-existent or incorrect name of a financial instrument, you will receive an error message that this financial instrument is unknown (does not exist). Inputs Currency_Nam
Description A colored universal indicator/oscillator based on crossing moving averages. The rising and falling lines of the indicator histogram can be colored. The combined use of the line and the histogram increases the level of the analysis when making a decision to open or close deals. The indicator can be calculated as the standard Price Oscillator or as a derivative on the basis of the following eleven other indicators included in the standard package of the MetaTrader 4 terminal: AD - an i
Description A universal colored multicurrency/multi-symbol indicator RAVI. Was proposed by T. Chand as a trend indicator. RAVI means Range Action Verification Index. The indicator may be used with any broker, irrespective of the name of the financial instrument since it is necessary to manually enter the name as an input parameter. If you enter a non-existent or incorrect name of a financial instrument, you will receive an error message that this financial instrument is unknown (does not exist).
Description A colored multicurrency/multisymbol oscillator of the market mood. The oscillator is designed for detecting the continuation or change of the market mood prior to its occurrence. An excellent example is the screenshots that show all the features of the oscillator. The oscillator may be used with any broker, irrespective of the name of the financial instrument since it is necessary to manually enter the name as an input parameter. If you enter a non-existent or incorrect name of a fin
Inside Bar
Igor Semyonov
Description The indicator determines the appearance of internal bars on the chart, and paints them in accordance with the bullish and/or bearish mood. The indicator can notify of the appearance of a formed internal bar by playing a beep, as well as display the time remaining until the end of the formation of the current bar in the format of <d:h:m:s, where: < means the current bar. d - days. h - hours. m - minutes. s - seconds. The bullish and bearish mood can be colored. Inputs Sound_Play - a
Description The indicator determines the appearance of bars that notify of the reversal of the current trend, and paints them in accordance with the bullish and/or bearish mood. The indicator can notify of the appearance of a formed reversal bar by playing a beep, as well as display the time remaining until the end of the formation of the current bar in the format of <d:h:m:s, where: < means the current bar. d - days. h - hours. m - minutes. s - seconds. You can select the color for bullish and
Description A universal colored multicurrency/multi-symbol indicator of moving averages: Moving Average, Double Moving Average, Triple Moving Average . The indicator is drawn in a separate window, so below the main trading chart a user can see the development of another financial instrument. It is very useful when considering the combined values of various moving averages for different financial instruments below the main trading chart.  The indicator may be used with any broker, irrespective of
Description A universal colored indicator of moving averages: Moving Average, Double Moving Average, Triple Moving Average . The indicator provides various opportunities for the analysis of prices based on different ways of constructing moving averages in the window of the main financial instrument. You can color bullish and bearish moods. Inputs MA_Type - type of multiplicity: Moving Average. Double Moving Average. Triple Moving Average. MA_Period - the MA period. MA_Method - the averaging met
Description A colored universal multicurrency/multi-symbol indicator Bollinger Bands to be drawn in a separate window below the main financial instrument. The rising and falling line of the main indicator and Bollinger Bands can be colored. The indicator can be calculated based on one of the eleven basic indicators included in the standard package of the MetaTrader 4 terminal: AD - an indicator of accumulation and distribution of volume. OBV - On Balance Volume. Force - Force Index indicator. MF
Description A colored universal multicurrency/multi-symbol indicator Channel to be drawn in a separate window below the main financial instrument. The indicator uses the calculation method of the Price Channel indicator. The rising and falling line of the main indicator and the Channel lines can be colored. The indicator can be calculated based on one of the eleven basic indicators included in the standard package of the MetaTrader 4 terminal: AD - an indicator of accumulation and distribution o
Keltner Channel
Igor Semyonov
5 (1)
Description Keltner's colored channel indicator,also called STARC band, drawn in the main chart window. The indicator uses the calculation technique of the three drawing options: basic, improved and modified . The first two were proposed by Keltner, the third one - by a successful trader L. Rakshe. You can also search for your own best parameters of the indicator. The upper, middle and lower bands can be colored. The indicator includes the basic analytical tool of the market moods by Keltner. Th
ZigZag Global
Igor Semyonov
Description A colored universal multicurrency/multi-symbol indicator ZigZag to be drawn in a separate window below the main financial instrument. The indicator may be used with any broker, irrespective of the name of the financial instrument since it is necessary to manually enter the name as an input parameter. If you enter a non-existent or incorrect name of a financial instrument, you will receive an error message that this financial instrument is unknown (does not exist).  The indicator can
Description A colored channel indicator Price Channel to be drawn on the main chart of a financial symbol. It can color bullish and bearish moods based on the middle line of the indicator, as well as change the color of the upper and lower lines of the channel. Purpose The indicator can be used for manual or automated trading in an Expert Advisor. Values of indicator buffer of the double type can be used for automated trading:  The middle line of the indicator - buffer 4. The upper line of the
Description Candlesticks is a colored multicurrency/multy-symbol indicator. It shows a financial instrument as a candlestick chart in a separate window below the chart of the main financial symbo. The indicator may be used with any broker, irrespective of the name of the financial instrument since it is necessary to manually enter the name as an input parameter. If you enter a non-existent or incorrect name of a financial instrument, you will receive an error message that this financial instrume
Description Candlestick Tools  is a colored multicurrency/multy-symbol indicator. It shows one of four standard indicators as a candlestick chart in a separate window below the chart of the main financial symbol. The indicator is calculated based on one of two indicators included in the standard package of the МetaТrader 4 terminal: CCI - Commodity Channel Index. RSI - Relative Strength Index. The default indicator is Commodity Channel Index. The indicator may be used with any broker, irrespecti
Pivot Pro
Igor Semyonov
Description Pivot Pro  is a universal color indicator of the  Pivot Points  levels systems. You can select one of its three versions:  Standard   Old , Standard New  and  Fibo . The system will automatically calculate the  Pivot Point  on the basis of market data for the previous day ( PERIOD_D1 ) and the system of support and resistance levels, three in each. It can also display price tags for each level. You can color the indicator lines. Only a method of calculation of the third level of supp
Price Levels
Igor Semyonov
Description The indicator is intended for labeling the chart using horizontal levels and/or half-round prices. The indicator works on any financial instrument regardless of the name and the number of digits. A user can choose colors for the indicator lines. Input Parameters Calc_Method - method of calculation of the lines: levels of round prices. levels of half-round prices. Digits_Accepted - flag for calculating the levels according to number of decimal places in the quotes of a financial inst
Description A colored universal multicurrency/multi-symbol indicator MACD Line Smart (the indicator moving average convergence divergence is displayed as a histogram) based on double or triple moving average .  Comparing to the standard MACD this indicator is more sensitive to what allows generating advance signals. he indicator may be used with any broker, irrespective of the name of the financial instrument since it is necessary to manually enter the name as an input parameter. If you enter a
筛选:
无评论
回复评论