Fibo Levels Multicurrency
- 实用工具
- 版本: 1.26
- 更新: 18 七月 2024
- 激活: 7

Description
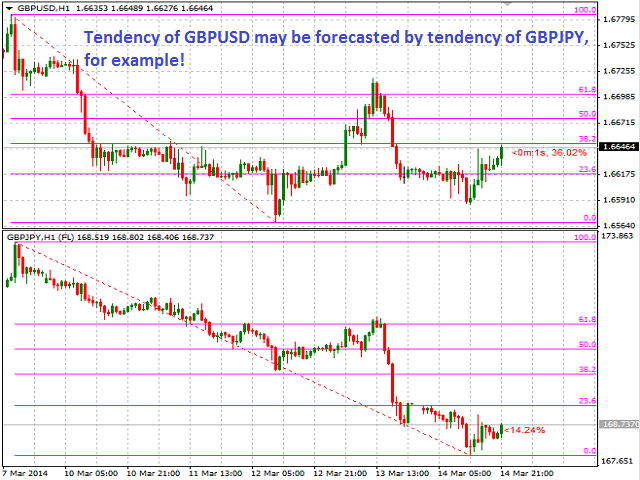
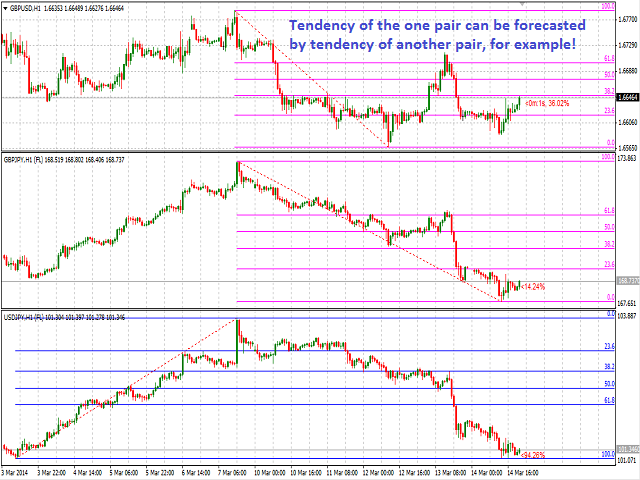
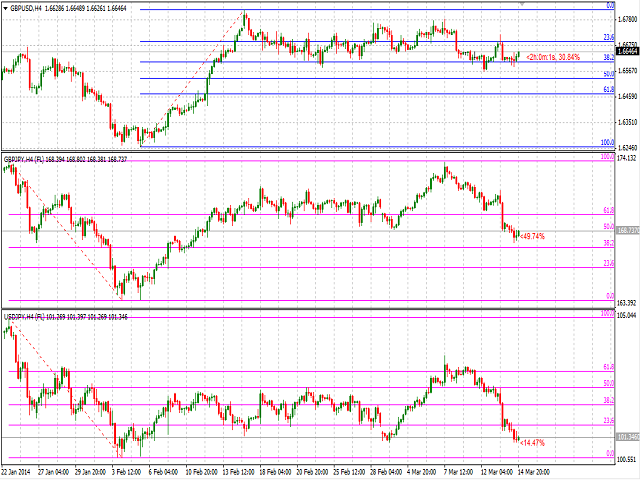
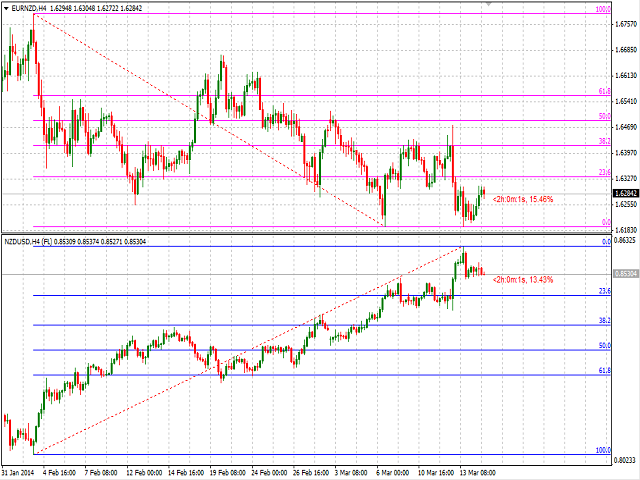
Fibo Levels is a color multicurrency/multi-symbol indicator that automatically plots Fibonacci levels on a candlestick chart in a separate window below the chart of the main financial instrument.
It can be used with any broker, regardless of the name of a financial instrument used because the symbol name must be entered manually as an input parameter. If you enter a non-existent or invalid name of a financial instrument, you will receive an error message saying that the specified financial instrument is unknown (does not exist).
You can set the number of candlesticks to be displayed, as well as a bullish and bearish color.
The indicator calculates and plots Fibonacci levels over a certain interval of user-specified bars.
The user can display Fibonacci levels of the bullish and bearish trends in different colors.
Furthermore, the indicator may be set to display the time remaining until the completion of the current bar in <d:h:m:s format, as well as Fibonacci retracements, where:
- < - an indication of the current bar.
- d - days.
- h - hours.
- m - minutes.
- s - seconds.
Purpose
The indicator can serve as a tool for intermarket analysis visualization (convergence and/or divergence).
Furthermore, it can be used for manual or automated trading as part of an Expert Advisor. For automated trading, use the indicator buffer of double type:
- Fibonacci retracement of the bullish trend - buffer 4, must not be equal to -1.
- Fibonacci retracement of the bearish trend - buffer 5, must not be equal to -1.
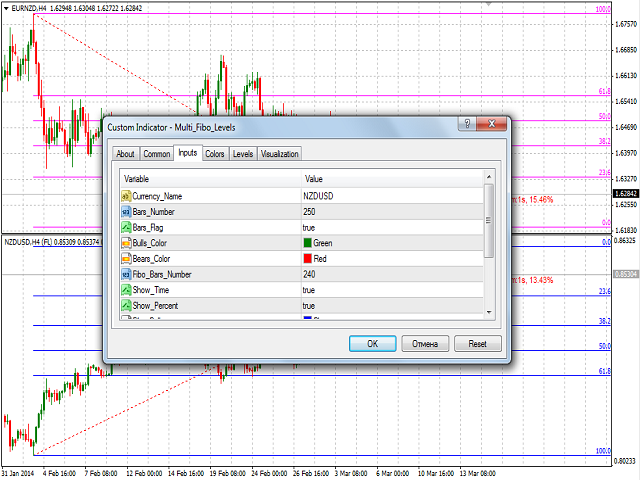
Input Parameters
- Currency_Name - name if the financial instrument.
- Bars_Number - number of bars to be displayed in a separate window (recommended value is 250).
- Bars_Flag - flag to allow to display the number of bars set in the Bars_Number parameter:
- true - in accordance with Bars_Number.
- false - maximum available number of bars in history.
- Bulls_Color - bullish candle color.
- Bears_Color - bearish candle color.
- Bid_Line_Color - color of the Bid line.
- Fibo_Bars_Number - number of bars for calculation of Fibonacci levels (recommended value is 240).
- Show_Time - permission to display the time remaining until the completion of the current bar.
- Show_Percen - permission to display the current Fibonacci retracement.
- Fibo_Bulls - color of Fibonacci levels in the bullish environment.
- Fibo_Bears - color of Fibonacci levels in the bearish environment.
- Fibo_Style - color of the auxiliary line.
- Time_Info - color of the displayed information.
- Bid_Line_Color - color of the Bid line.
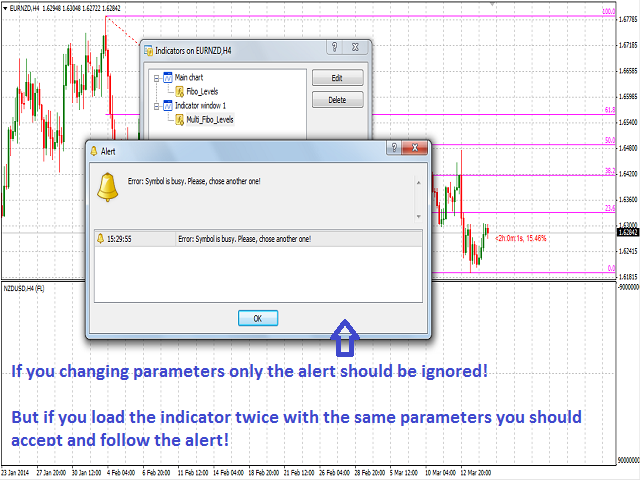
Restrictions
A chart for each financial instrument can only be displayed once. Otherwise, you will see an error caused by its repeated use which will prompt you to change the financial instrument.
Recommendations
It is recommended to use the indicator with the Bars_Number value not being higher than the number of bars that can fit in one full size window (around 250 bars).
It is further advisable to use the indicator as shown in the screenshots below.
Note
If the connection with a trade server is lost, the chart will be re-drawn from the beginning using the number of bars set by Bars_Number and Bars_Flag parameters once the connection is re-established and the data is spooled.