Double Top and Bottom Pattern
- 指标
-
Ugur Oezcan
 # ICMARKETS(21% 实时折扣)
ICMarkets 佣金 21.5% 实时折扣。您账户上的每笔交易(包括手动交易)均可享受折扣。
开立账户: https://www.ictrading.com ?camp=79397
对于现有的 IC Markets 账户,您只需发送一封包含指定文本的简单电子邮件即可。您可以在以下链接中找到该文本。 - 版本: 1.10
- 更新: 3 四月 2019
- 激活: 5
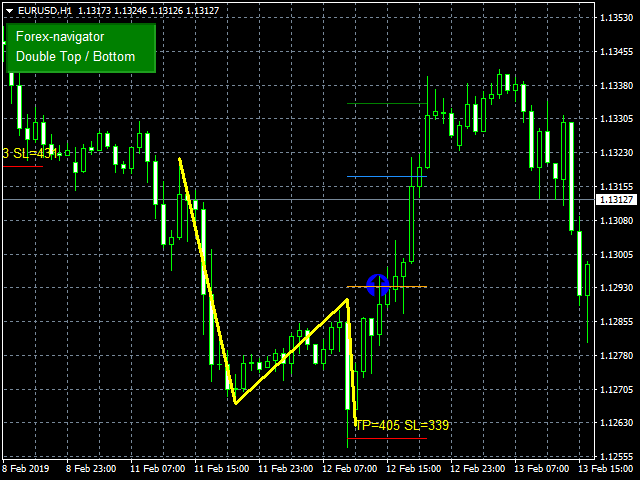
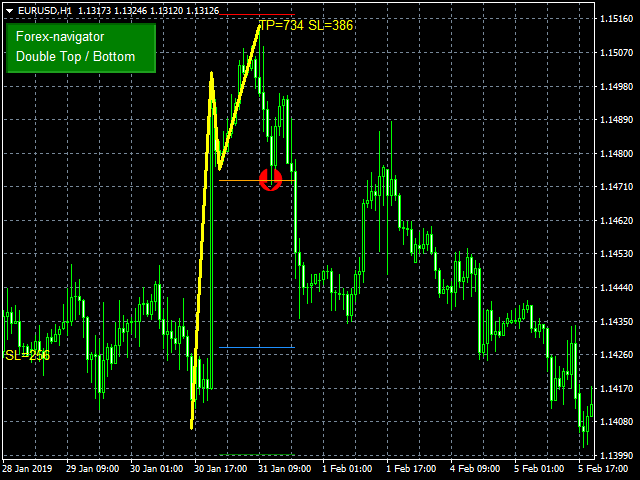
Double top and bottom patterns are chart patterns that occur when the underlying investment moves in a similar pattern to the letter "W" (double bottom) or "M" (double top). Double top and bottom analysis is used in technical analysis to explain movements in a security or other investment, and can be used as part of a trading strategy to exploit recurring patterns.
You can find MT5 version hier
Indicator shows you 2 Level target and stop loss level. Stoploss level and Take profit can be adjusted depending on your risk tolerance.
The following alert types are available:
- Popup alert,
- Email ( Settings in metatrader 4 stations necessary: instruction ),
- Notification to mql5 app ( Settings in mql5.com profile necessary: instruction ),
- sound,
- Comment at screen,
- log at expert tab
INPUT PARAMETER
*** Pattern setup
Min Points - Min points between Highs and Lows
Trend Move Min Bars - Checking min bars
Trend Move MaxBars - checking max bars
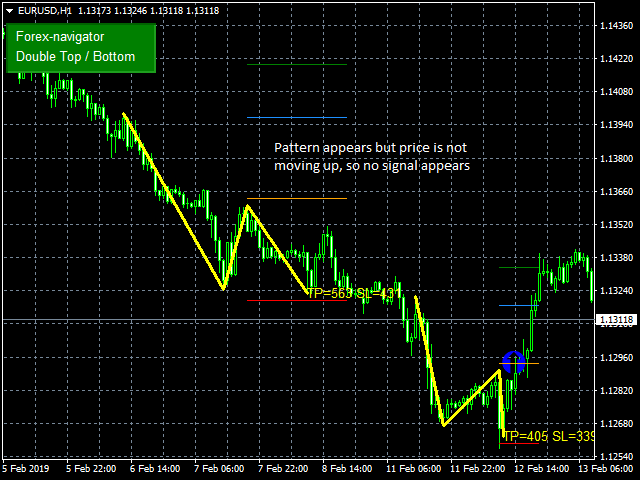
Enable reversal signal - Enable reversal signal
Enable continuation signal - Enable continuation signal
Signal Valid Bars - Signal line(Orange Line) , signal appaers if price hit this line. you can define how many bars to obeserve price after pattern appears
*** Trade setup
Stoploss Offset Points - Offset of stoploss from High or Lows (Red line)
Entry Offset Points - Offset signal line in Points (Orange Line)
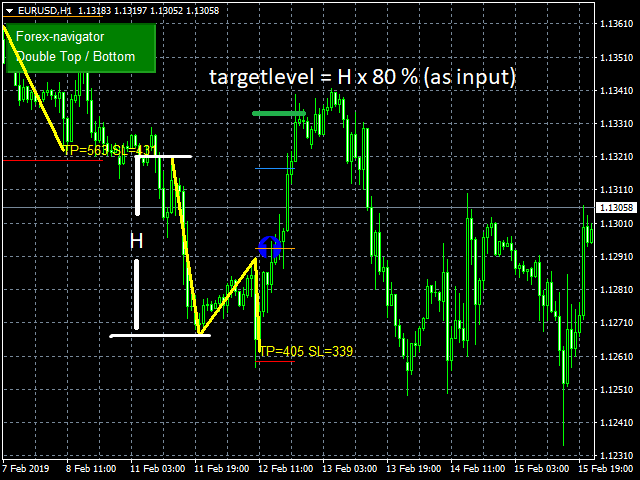
Target Level Percent - Perscent of first Trand line (Yellow line)
Safe Level Percent - Perscent of first Trand line (Blue line)
*** Visualisation
Panel Offset - Panel offset on chart
AlertType
Good work. Much superior to all of the double top and double bottom indicators available in the market.