Four Moving Averages

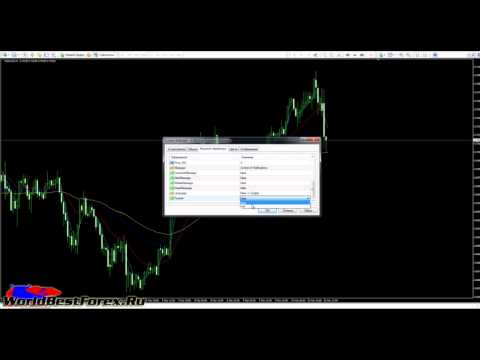
四均线指标 (请参看描述和视频), 是 四均线消息 的一个版本, 在主窗口以省缺设置显示四条均线: 绿色和红色表示短线趋势, 红色和蓝色 - 中线趋势, 而蓝色和黄色 - 长线趋势。您可以改变移动均线设置和颜色。不过,这些参数已经配置好,可在所有时间帧内交易。来看看本指标如何用于所有时间帧的可盈利多货币 交易策略, 它也适合在您的移动终端上进行交易。

祝交易好运!

Video Four Moving Averages
推荐产品
Rainbow Price Visualizer
Vincent Jose Proenca
Rainbow Price Visualizer v1.21 See where the market really breathes. Turns your MT4 chart into an ultra-precise heatmap that highlights price zones favored by big players. Why it matters 300 price levels at 0.2‑pip resolution — microscopic detail. 8 visual themes (Rainbow, Fire, Ocean…) for instant readibility. Smart opacity: low noise fades, real zones pop. Lightweight rendering with automatic cleanup. Fully customizable: saturation, opacity, resolution, history depth. Bands project into the f
Crypto_Forex 指标 HTF Ichimoku 适用于 MT4。 - Ichimoku 指标是最强大的趋势指标之一。HTF 表示 - 更高时间框架。 - 此指标非常适合趋势交易者以及与价格行动条目的组合。 - HTF Ichimoku 指标允许您将更高时间框架的 Ichimoku 附加到当前图表。 - 上升趋势 - 红线高于蓝线(并且两条线都在云层上方)/ 下降趋势 - 红线低于蓝线(并且两条线都在云层下方)。 - 仅当价格突破 Ichimoku 云层顶部边界时才打开买入订单。 - 仅当价格突破 Ichimoku 云层底部边界时才打开卖出订单。 - HTF Ichimoku 指标提供了捕捉大趋势的机会。 点击这里查看高质量的交易机器人和指标! 它是仅在此 MQL5 网站上提供的原创产品。
The Four Moving Averages Message indicator ( please see the description and video ), a version of Four Moving Averages , concurrently displays four Moving Averages with default settings in the main chart window: Green and Red ones represent a short-term trend, Red and Blue ones - mid-term trend, while Blue and Yellow ones - long-term trend. You can change the moving average settings and colors. However, these parameters have been configured so that to allow trading on all time frames. The built-
Auto Fibo Pro m
DMITRII GRIDASOV
“Auto FIBO Pro” Crypto_Forex 指标 - 是交易中的绝佳辅助工具! - 指标自动计算并放置在图表斐波那契水平和局部趋势线(红色)上。 - 斐波那契水平指示价格可能反转的关键区域。 - 最重要的水平是 23.6%、38.2%、50% 和 61.8%。 - 您可以将其用于反转剥头皮或区域网格交易。 - 还有很多机会可以使用 Auto FIBO Pro 指标来改进您当前的系统。 - 它具有信息价差掉期显示 - 它显示所连接的外汇对的当前价差和掉期。 - 显示屏还显示账户余额、净值和保证金。 - 可以将信息价差掉期显示定位在图表的任何角落: 0 - 左上角,1 - 右上角,2 - 左下角,3 - 右下角。 点击这里查看高质量的交易机器人和指标! 这是仅在此 MQL5 网站上提供的原创产品。
The indicator displays the data of the Stochastic oscillator from a higher timeframe on the chart. The main and signal lines are displayed in a separate window. The stepped response is not smoothed. The indicator is useful for practicing "manual" forex trading strategies, which use the data from several screens with different timeframes of a single symbol. The indicator uses the settings that are identical to the standard ones, and a drop-down list for selecting the timeframe. Indicator Paramet
Gobbo MT4
Alessandro Grossi
Gobbo è un indicatore professionale che evidenzia il trend del mercato con un aspetto grafico chiaro e comprensibile, è basato sulla Moving Average e può essere impostato su qualsiasi periodo di intervallo, di default impostato sul periodo 14, scegliendo un periodo più alto evidenzierà meno cambi di tendenza per un approccio sul medio o lungo periodo, con un periodo più basso più cambi di tendenza per un approccio sul breve termine L'aggiornamento e l'adattamento al time frame scelto avviene in
Noize Absorption Index MT4
Ekaterina Saltykova
5 (1)
Noize Absorption Index - is the manual trading system that measures the difference of pressure between bears forces and bulls forces. Green line - is a noize free index that showing curent situation. Zero value of index shows totally choppy/flat market.Values above zero level shows how powerfull bullish wave is and values below zero measures bearish forces.Up arrow appears on bearish market when it's ready to reverse, dn arrow appears on weak bullish market, as a result of reverse expectation. S
DYJ Alligator 信号源基于 Alligator 指示器。它可以用于任何货币对和时间框架。 蓝线(Alligator‘s Jaw)是用于构建图表的时间段的平衡线(13期平滑移动平均线,向未来移动8条); 红线(鳄鱼的牙齿)是低一级(8期平滑移动平均线,向未来移动5条)的价值时间框架的平衡线; 绿线(Alligator's Lips)是价值时间段的平衡线,再低一级(5期平滑移动平均线,向未来移动3条)。 市场进入条件 BUY:  Lips#1 > Teeth#1 and Teeth#1 > Jaws#1 SELL: Lips#1 < Teeth#1 and Teeth#1 < Jaws#1 该指标的入场信号,则是趋势转折点。 该指标使用模拟交易技术,   指标为你提供评价开盘信号和收盘信号整体盈利。   你用哪种评估模式交易都很方便。   当你选择最大利润模型评估模型时, 建议您使用跟踪止损功能。 这样可以最大程度的跟踪趋势利润。   当您选择反向信号关闭评估模式时, 建议你耐心等待反信号出现,然后关闭仓位。 这个可以一直等趋势真正结束并盈利。 如果您需要自动化跟
Delta Fusion Pro
Francesco Secchi
5 (2)
Delta Fusion Pro – 高级订单流分析,专为日内交易设计 Delta Fusion Pro 是一款专业的 MetaTrader 4 指标,能够揭示市场中的主动订单流,实时显示机构压力的强度和方向。与传统的成交量指标不同,它分析买盘(Ask)与卖盘(Bid)之间的成交量差值(Delta),用于提前预测反转、确认趋势并识别专业兴趣区域。 主要特点 智能自动调节系统 根据以下条件自动调整所有参数: 交易品种类型(外汇、加密货币、指数、大宗商品、股票) 操作周期 市场波动率(ATR) 最近平均成交量 无需手动配置,适合新手交易者——指标自动完成校准! 核心功能 净Delta与累计Delta 计算主动买盘/卖盘成交量差值,支持自定义 EMA 平滑 实时显示方向性压力 可自定义直方图颜色(买入/卖出) 价格/成交量背离 自动检测常规与隐藏背离 强度分类:强/中/弱 高级过滤:成交量确认、趋势、时间距离 图形信号(彩色箭头) 市场失衡 识别显著的买盘/卖盘比例失衡(可配置比率) 最小成交量阈值验证 图表显示彩色点(多头/空头) Infusion Volume 检测异常成交量峰值(
The indicator detects and displays 3 Drives harmonic pattern (see the screenshot). The pattern is plotted by the extreme values of the ZigZag indicator (included in the resources, no need to install). After detecting the pattern, the indicator notifies of that by a pop-up window, a mobile notification and an email. The indicator highlights the process of the pattern formation and not just the complete pattern. In the former case, it is displayed in the contour triangles. After the pattern is com
Combined MT4
Ahmed Alaaeldin Abdulrahman Ahmed Elherzawi
Welcome to Investment Castle products   This product is exclusively available in the MQL5 market and is not available and will not be available anywehere else. The Combined indicator is a multi-time frame indicator and it is built using 3 indicators: Bands indicator which draws the support and resistance key levels   using up to 5 different time frames Patterns indicator which draws the chart patterns using up to 6 different time frames Spots indicator which shows the common candlestick pattern
The   RSI Divergence + FVG Signal   indicator combines   Relative Strength Index (RSI) Divergence   with   Fair Value Gap (FVG)   detection to generate high-probability buy and sell signals based on both momentum shifts and institutional imbalance zones. Core Features: RSI Divergence Detection : Identifies both regular and hidden bullish/bearish divergences between price and RSI. Divergences indicate potential trend reversals or continuation. FVG Zone Recognition : Detects Fair Value Gaps (imbal
Super Reversal Pattern
Parfait Mujinga Ndalika
Super Reversal Pattern Indicator Unlock the power of advanced pattern recognition with our Super Reversal Pattern Indicator. Designed for traders seeking precision and reliability, this indicator identifies one of the most effective reversal patterns in technical analysis, offering a significant edge in your trading strategy. Key Features: Non-Repainting Accuracy: Enjoy the confidence of non-repainting technology. Once a Super Reversal Pattern is detected, it remains static, providing consiste
VR Cub
Vladimir Pastushak
VR Cub 这是获得高质量切入点的指标。该指标的开发是为了促进数学计算并简化对仓位入场点的搜索。多年来,该指标所针对的交易策略已被证明其有效性。交易策略的简单性是其巨大的优势,即使是新手交易者也能成功进行交易。 VR Cub 计算开仓点以及获利和止损目标水平,这显着提高了效率和易用性。查看使用以下策略进行交易的屏幕截图,了解简单的交易规则。 设置、设置文件、演示版本、说明、问题解决,可以从以下位置获取 [博客] 您可以在以下位置阅读或撰写评论 [关联] 版本为 [MetaTrader 5] 计算入场点的规则 开仓 要计算入场点,您需要将 VR Cub 工具从最后一个高点拉伸到最后一个低点。 如果第一个点在时间上早于第二个点,交易者等待柱线收于中线上方。 如果第一个点在时间上晚于第二个点,交易者等待柱线收于中线下方。 根据上述条件,严格在 柱线收盘 后建仓。 换句话说,如果我们在小时图上进行交易,那么从最高点到最低点的时间距离必须超过24小时,最高点和最低点之间的点数必须大于或等于平均价格变动每天。 维持和改变市场地位 可以有多个未平仓头寸;每个头寸都可以单独修改。 VR Cub
"Impulses and Corrections 4" is created to help traders navigate the market situation. The indicator shows multi-time frame upward and downward "Impulses" of price movements. These impulses are the basis for determining the "Base" , which is composed of zones of corrections of price movements, as well as "Potential" zones for possible scenarios of price movement. Up and down impulses are determined based on a modified formula of Bill Williams' "Fractals" indicator. The last impulse is always "U
PABT Pattern Indicator - it's classical system one of the signal patterns. Indicator logic - the Hi & Lo of the bar is fully within the range of the preceding bar, look to trade them as pullback in trend. In the way if indicator found PABT pattern it's drawing two lines and arrow what showing trend way.  - First line - it's entry point and drawing at: 1. On the high of signal bar or on middle of the signal bar (depending from indicator mode) for buy; 2. On the low of signal bar or on middle of t
The   Trendlines Oscillator   helps traders identify trends and momentum based on the normalized distances between the current price and the most recently detected bullish and bearish trend lines. The indicator features bullish and bearish momentum, a signal line with crossings, and multiple smoothing options. USAGE The   Trendlines Oscillator   works by systematically: Identifying pivot highs and lows. Connecting pivots to form bullish (support) and bearish (resistance) trendlines. Measuring
ADX Pointer
Dominik Mandok
ADX Pointer is an indicator which is based on "Average Directional Index" and draws three numbers in chart window depending on the value of ADX. In ADX Pointer you can set "ADX_Period" which is of course period of Average Directional Index and you can also set 3 levels. When ADX value exceed first level ("ADX_Level1") in chart window appears number "1", when ADX exceed second level ("ADX_Level2") appears "2" and when ADX exceed third level ("ADX_Level3") appears "3". Simple. ADX Pointer works on
Alpha Trend sign Alpha Trend sign 是我么长期以来非常受欢迎的交易工具,它可以验证我们的交易系统,并且明确的提示交易信号,并且信号不会漂移。 主要功能: •  根据市场显示活跃区域,根据指标可以很直观的判断当前行情是属于趋势行情,还是震荡行情。    并根据指标的指示箭头切入市场,绿色箭头提示买入,红色箭头提示卖出。 •  建议使用5分钟以上的时间周期进行交易,避免因为小周期波动出现频繁的交易信号。 •  您也可以开启信号提示,以免错过最佳的交易时机。 •  本指标不但可以很好的预测趋势行情,也可以在宽幅震荡行情中获利。 •  本指标本着大道至简的原则,适合不同阶段的交易者使用。 注意事项: •  Alpha Trend sign 有明确的进出场信号,不建议逆势操作,以免造成损失。 •  Alpha Trend sign 是特别成熟的指标,我们团队人手一个,使用它可以实现稳定盈利。     
ZhiBiCCI MT4
Qiuyang Zheng
【ZhiBiCCI】指标适合所有的周期使用,也适合所有的市场品种。 【ZhiBiCCI】绿色实线是逆转看涨背离。绿色虚线是经典的看涨背离。 【ZhiBiCCI】向红色实线是反向看跌背离。红色虚线是古典看跌背离。 【ZhiBiCCI】可以在参数里面设置(Alert、Send mail、Send notification),设置为(true)就可以发送即时信号到警报窗口、电子邮件、即时消息。 参数设置说明: 【displayAlert】:这是警报开关,设置成true,如果出现箭头就会自动警报提示;设置成false,则不会警报提示。 【sendmail_NO_OFF】:这是发送邮件的开关,设置成true,如果出现箭头就会发送邮件到你在MT4设置好的邮箱里面;设置成false,则不会发邮件。 【sendnotification_NO_OFF】:这是发送即时消息的开关,设置成true,如果出现箭头就会发送消息到你的移动设备;设置成false,则不会发消息。 更多好用的指标网址: https://www.mql5.com/en/users/zhengqiuyang/seller
ExtraMovingPivots
Stanislav Korotky
This is an intraday indicator that uses conventional formulae for daily and weekly levels of pivot, resistance and support, but updates them dynamically bar by bar. It answers the question how pivot levels would behave if every bar were considered as the last bar of a day. At every point in time, it takes N latest bars into consideration, where N is either the number of bars in a day (round the clock, i.e. in 24h) or the number of bars in a week - for daily and weekly levels correspondingly. So,
My products: https: // www.mql5.com/ru/users/astra077/seller In the product line: Candlestick Pattern Detector   — a free basic version. Candlestick Patterns Standard   — a paid single-chart version with extended patterns and filters  https://www.mql5.com/ru/market/product/174659 Japanese Candlestick Patterns Pro MT4   — a professional single-chart version with a summary table  https://www.mql5.com/ru/market/product/174681 Multi-Currency Candlestick Pattern Scanner   — the ultimate version: a mu
FREE
Nice Trade Point
Muhammed Emin Ugur
This    Nice Trade Point     indicator is designed for signal trading. This indicator generates trend signals. It uses many algorithms and indicators to generate this signal. It tries to generate a signal from the points with the highest trend potential. This indicator is a complete trading product. This indicator does not need any additional indicators. The indicator certainly does not repaint. The point at which the signal is given does not change.     Features and Suggestions Time Frame
Wave Wolf MT4
Andrei Salanevich
Wave Wold MT4外汇指标旨在搜索狼波并将其显示在交易终端的当前窗口中。 对于在交易中使用狼波的交易者来说,这是一个很好的指标。 它在交易策略中的应用将显着提高其效率和盈利能力。 有关指标的信息 与其他Wolf wave指标不同,Wave Wold MT4外汇指标具有许多显着提高其有效性的功能: 第一个是打开的Windows5point参数(真值)提供信息支持,即扩展了狼波出现在其上的图表的窗口。 例如,如果EURUSD、AUDUSD和GBPUSD图表是开放的,并且每个图表都安装了Wave WOLD MT4指标,那么如果检测到欧元模型,相应的图表将自动被带到其他图表的顶部,这在交易大量工具时变得非常方便。  第二个功能是MACD上的内置发散分析,用户可以自己选择参数(默认设置(12,26,9))。 顺便说一下,通常振荡器的值不显示在工作窗口上,只反映在形成点(5)时的价格标签的颜色上,特别是,如果标签的颜色是蓝色,则没有发散,如果颜色是红 如何使用指标 Wave WOLD MT4指标显示第4个形成点的假设Wolf模型和第5个点的形成区域(所谓的甜区,以黄色显示)。 如
ATeam Divergence
Hoang Ngoc Thach
The CCI Divergence is a reasonably useful indicator in itself, but it is even more effective when used with divergence pattern trading. The CCI Divergence indicator signal is one of the most potent signals among the indicators that exist in the market. Here is new version for Divergence Indicator using CCI method, with more improvements. Divergences indicate a potential investment point because the directional moment does not confirm the price. A bullish divergence occurs when the underlying va
The Range Directional Force Indicator is designed to help traders analyze market trends, reversals, and directional strength. It focuses on price movements within defined ranges, identifying key moments when the market is gaining momentum or preparing for a shift. By dividing the chart into dynamic price ranges, the indicator detects critical support and resistance levels. It calculates the directional force of price movements, highlighting potential entry and exit points based on market sentim
KDJ Index 4   交易实用必备工具指标 波浪自动计算指标,通道趋势交易 完美的趋势-波浪自动计算通道计算 , MT4版本 完美的趋势-波浪自动计算通道计算 , MT5版本 本地跟单复制交易 Easy And Fast Copy , MT4版本 Easy And Fast Copy , MT5版本 本地跟单复制交易 模拟试用 Easy And Fast Copy , MT4 模拟账号运行 Easy And Fast Copy , MT5 模拟账号运行 "Cooperative QQ:556024  "  "Cooperation wechat:556024"  "Cooperative email:556024@qq.com" 强烈推荐趋势指标, 波浪的标准自动计算   和   波浪的标准自动计算MT5版本     KDJ指标又叫 随机指标 ,是一种相当新颖、实用的技术分析指标,它起先用于期货市场的分析,后被广泛用于股市的中短期趋势分析,是期货和股票市场上最常用的技术分析工具。 随机指标KDJ一般是用于股票分析的统计体系,根据统计学原理,通过一个特定的周期(常为9日、9周等)
Trade with Gann on your side!! MASTER CIRCLE 360 CIRCLE CHART, originally created by Gann admitted that this is “The Mother of all charts”. It is one of the last studies that this great trader left for us. The numeric tab le is apparently quite simple like all the tables and is based on square numbers, the SQUARE OF 12 and is by evolution, one of the most important square numbers. Here we can find CYCLE, PRICE AND TIME thanks to angles and grades, to show past and future support and resistance.
Trend Oscillator mw
DMITRII GRIDASOV
趋势振荡器 - 是一种高级自定义 Crypto_Forex 指标,高效的交易工具! - 使用高级新计算方法 - 参数“计算价格”有 20 个选项。 - 有史以来最平滑的振荡器。 - 绿色表示上升趋势,红色表示下降趋势。 - 超卖值:低于 5,超买值:超过 95。 - 使用此指标,有很多机会升级标准策略。 - 具有 PC 和移动警报。 ....................................................................................................................... 点击这里查看高质量的交易机器人和指标! 这是仅在此 MQL5 网站上提供的原创产品。
The indicator detects and displays М. Gartley's Butterfly pattern. The pattern is plotted by the extreme values of the ZigZag indicator (included in the resources, no need to install). After detecting the pattern, the indicator notifies of that by the pop-up window, a mobile notification and an email. The pattern and wave parameters are displayed on the screenshots. The default parameters are used for demonstration purposes only in order to increase the amount of detected patterns. Parameters z
该产品的买家也购买
Gann Made Easy
Oleg Rodin
4.83 (162)
Gann Made Easy 是一个专业且易于使用的外汇交易系统,它基于使用先生理论的最佳交易原则。 W.D.江恩。该指标提供准确的买入和卖出信号,包括止损和获利水平。您甚至可以使用推送通知在旅途中进行交易。 购买后请联系我,即可免费获得交易指导和超棒的额外指标! 您可能已经多次听说过江恩交易方法。通常 Gann 的理论不仅对于新手交易者而且对于那些已经有一定交易经验的人来说都是非常复杂的东西。这是因为江恩的交易方法在理论上并不那么容易应用。我花了几年时间来完善这些知识,并将最好的原则应用到我的外汇指标中。 该指标非常易于应用。您所需要的只是将其附加到您的图表并遵循简单的交易建议。该指标不断进行市场分析工作并寻找交易机会。当它检测到一个好的入口点时,它会为您提供一个箭头信号。该指标还显示止损和获利水平。 换句话说,当您像先生一样进行交易时,该指标会为您提供最佳江恩建议。江恩亲自告诉你此时此刻该做什么。但最好的部分是您不需要了解任何有关江恩交易原则的知识,因为该指标会为您完成整个市场分析工作。
M1 Sniper
Oleg Rodin
5 (22)
M1 SNIPER 是一款易于使用的交易指标系统。它是一个专为 M1 时间框架设计的箭头指标。该指标可以作为独立的系统在 M1 时间框架下进行剥头皮交易,也可以作为您现有交易系统的一部分使用。虽然该交易系统专为 M1 时间框架交易而设计,但它也可以用于其他时间框架。我最初设计此方法是为了交易 XAUUSD 和 BTCUSD。但我发现这种方法在其他市场交易中也同样有用。 指标信号既可以顺势交易,也可以逆势交易。我教授一种特殊的交易技巧,帮助您利用指标信号进行双向交易。该方法基于使用特殊的动态支撑位和阻力位区域。 购买后,您可以立即下载 M1 SNIPER 箭头指标。此外,我还为所有 M1 SNIPER 工具用户免费提供下方屏幕截图所示的 Apollo Dynamic SR 指标!这两个指标的组合可以帮助您更轻松、更准确地利用 M1 时间框架进行交易。 购买后请联系我,免费获取交易提示和奖励指标! 祝您交易成功!
Scalper Inside PRO
Alexey Minkov
4.74 (69)
Scalper Inside PRO – Since 2020. An exclusive indicator that utilizes an innovative algorithm to swiftly and accurately determine the market trend. The indicator automatically calculates opening, closing, and profit levels, providing detailed trading statistics. With these features, you can choose the most appropriate trading instrument for the current market conditions. Additionally, you can easily integrate your own arrow indicators into Scalper Inside Pro to quickly evaluate their statistics
KuKl
IGOR KIRIANEN
The indicator is built on a non-standard Zig Zag, it draws accumulations after which if the price leaves this zone and a test of this zone occurs, then a sound signal is given and an arrow appears - after the test candle closes.The indicator does not redraw its signals, it is very easy to use, there are only three settings 1- this is the zig zag parameter 2- this is the minimum price exit from the zone 3- this is the maximum price exit from the zone. The lower the parameter for Zig Zag, the more
PRO Renko System
Oleg Rodin
5 (30)
PRO Renko Arrow Based System for trading renko charts.  准确的信号交易任何外汇工具. 另外,我将免费提供系统的附加模块! PRO Renko系统是RENKO图表上高度准确的交易系统。该系统是通用的。 该交易系统可应用于各种交易工具。 该系统有效地中和了所谓的市场噪音,打开了获得准确反转信号的通道。 该指标易于使用,只有一个参数负责产生信号。 您可以很容易地使算法适应您感兴趣的交易工具和renko酒吧的大小。 我很乐意通过提供任何咨询支持来帮助所有客户有效地使用该指标。 祝您交易成功!购买后,立即写信给我! 我将与您分享我的建议和我的renko发电机。 另外,我将免费提供系统的附加模块!
Auto Optimized Parabolic RSI: 高级 3D 动量引擎 大多数零售指标之所以失效,是因为它们依赖于静态输入,一旦市场波动率发生变化,这些输入就会崩溃。Auto Optimized Parabolic RSI 通过不断重新计算自身的数学优势,解决了“指标衰退”的问题,将机构级别的量化自适应能力直接引入您的 MT5 终端。 核心优势:定制的内存 3D 优化   标准的自动优化器通常会导致 MT5 平台卡顿,因为它们通过标准的指标调用使终端超载。该工具完全绕过了这些性能瓶颈。内部引擎采用定制的原生基于 RAM 的计算器构建,每次加载图表或更改时间周期时,它都会执行极速的 3D 网格搜索。它同时扫描 RSI 周期(频率)、SAR 步长(加速度)和 SAR 最大值(速度限制),在绝对的毫秒级时间内测试数以万计的参数组合,且完全不会拖慢您的平台。它不是仅仅寻找一个“不错”的设置,而是映射整个参数空间,以寻找资产当前动量结构的绝对全局最大值。 严格的财务评分与逼真的交易模拟   与基于抽象“指标点数”进行优化评分的业余工具不同,该引擎的 3.10 版本严格与资金数学挂钩。每
Quantum Breakout Indicator PRO
Bogdan Ion Puscasu
4.96 (26)
介绍     Quantum Breakout PRO   ,突破性的 MQL5 指标,正在改变您交易突破区域的方式!   Quantum Breakout PRO 由拥有超过 13 年交易经验的经验丰富的交易者团队开发,旨在通过其创新和动态的突破区域策略将您的交易之旅推向新的高度。 量子突破指标将为您提供带有 5 个利润目标区域的突破区域的信号箭头,以及基于突破框的止损建议。 它既适合新手交易者,也适合专业交易者。 量子 EA 通道:       点击这里 MT5版本:   点击这里 重要的!购买后请私信我领取安装手册。 建议: 时间范围:M15 货币对:GBPJPY、EURJPY、USDJPY、NZDUSD、XAUUSD 账户类型:ECN、Raw 或 Razor,点差极低 经纪商时间:GMT +3 经纪商:IC Markets、Pepperstone with Raw 和 Razor 的点差最低 规格: 不重漆! 最多 5 个建议利润目标区域 建议止损水平 可定制的盒子。您可以设置自己的 Box Time Start 和 Box Time End。 接触 如果您
Market Makers
Mohamed Hassan
5 (4)
After purchase, contact me privately to receive 1 month of free testing with EA Forex Proton! This advanced MT4 trading robot automatically executes signals from any MT4 indicator, including Market Makers. The latest version also includes AI integration, allowing each trade signal to be analyzed using Artificial Intelligence. Live Signal with EA Forex Proton: Click here Market Makers is a powerful price action trading system designed to identify high-probability Buy and Sell opportunities based
Atomic Analyst
Issam Kassas
5 (5)
首先值得强调的是,该交易指标是非重绘、非延迟的指标,这使其成为手动和机器人交易的理想选择。 用户手册:设置、输入和策略。 Atomic Analyst是一种PA价格行动指标,利用价格的力量和动量来寻找市场上更好的机会。配备了高级过滤器,可帮助去除噪音和假信号,并提高交易潜力。使用多层复杂的指标,Atomic Analyst扫描图表,并将复杂的数学计算转化为任何初学者都能理解并用来做出一致交易决策的简单信号和颜色。 “Atomic Analyst”是专为新手和经验丰富的交易者量身定制的综合交易解决方案。它将高级指标和一流功能融合为一体的交易策略,使其成为所有类型交易者的多功能选择。 日内交易和剥头皮策略:专为快速准确的日内交易和短期交易而设计。 日内和摆动交易策略:可用作追求价格大幅波动的日内和摆动交易者的可靠工具。 多货币和市场:凭借其可靠的精度,在不同的工具和市场上运作。 多个时间框架:可在多个时间框架上使用,性能良好。 稳定性:所有指标均不重绘、不重绘和不滞后,确保可靠的信号。 信号清晰度:提供箭头信号,用于清晰的入场和出场点。 实时警报:通过交易入场、SL和TP警报通知交易者
Apex Edge 无重绘指标 适用于 MT4 的专业无重绘交易指标 Apex Edge 无重绘指标是一款优质、简洁、可靠的交易工具,专为追求清晰信号且不想被重绘箭头困扰的专业外汇和加密货币交易者而设计。 主要功能: 100% 不重绘 – 信号一旦出现在图表上,位置便固定不变 双信号系统:RAW 信号用于捕捉早期交易机会,CONF 信号用于高概率确认入场 一键式切换按钮:RAW 开/关和 CONF 开/关 专业实时仪表盘,显示趋势、强度百分比和信号状态 即时提醒:弹出窗口、声音和电子邮件通知 每个 CONF 信号自动绘制 TP1、TP2 和止损位 清晰的颜色编码箭头,带来即时视觉体验: 亮绿色 → CONF 买入 红色 → CONF 卖出 道奇蓝 → RAW 买入 品红色 → RAW 卖出 适用于所有时间周期和所有交易品种 优势: 消除信号消失或移动的常见问题 帮助您更有信心地进行交易,并更好地进行风险管理 可靠的即时提醒,节省屏幕时间 提供清晰的止盈和止损指导自动 适用于日内交易、超短线交易和波段交易 市场: 所有外汇货币对(主要货币对
该指标旨在与艾略特波浪理论相结合,提供了两种不同的工作方式: 自动工作: 在此模式下,指标会自动检测图表上的所有五个动机波浪,并为您提供预测和潜在的逆转区域。它还可以提供警报和推送消息。这种自动功能简化了识别和分析艾略特波浪模式的过程。 手动工作: 此选项适用于喜欢手动方法的交易员,用于手动绘制九个不同等级的波浪。每个等级都可以在它们出现后通过调整图表上的绘制线条来单独定义。此功能简化了手动绘制波浪的过程,使其更加高效。需要注意的是,所有绘图数据将保存在平台的数据文件夹中,以备将来参考。 参数: Name: 指标名称。 Use_System_Visuals: 启用或禁用指标主题,以匹配交易平台的整体外观。 Explain_Comment: 允许启用或禁用波浪编号的解释性注释,有助于理解已识别的波浪。 Show_Last_Candle_Counter: 启用或禁用蜡烛计时器,提供有关当前蜡烛收盘的剩余时间的信息。 Candle_Counter_Color: 蜡烛计时器文本的颜色。 Basic_Wave_Color: 用于表示波浪的主要颜色。 Bullish_Wave_Color: 当检测
Please send me Direct message on MQL5 CHAT after purchasing the Indicator for Training and Installation Support There are some additional files that is important to use with the Indicator . So be sure to contact me after purchasing the Indicator So that I can add you for training and support . If you find any difficulty with installation then send me Direct message here So that I can connect with you via Anydesk or Teamview for the product installation. " Smart Order Block Indicator " to find m
GoldRush Trend Arrow Signal
Kirk Lee Holloway
5 (2)
GoldRush 趨勢箭頭信號 GoldRush 趨勢箭頭信號 指標為 XAU/USD 中的高速、短期短線交易者提供精確、實時的趨勢分析。 專為1分鐘時間框架設計,此工具顯示方向箭頭以明確顯示入場點,使短線交易者能在波動市場中自信操作。 該指標包含主要和次要警示箭頭。主要信號為白色和黑色方向箭頭,用於指示趨勢方向的轉變;次要信號為藍色和紅色箭頭,用於確認主要箭頭指示的方向並提示潛在交易入場點。 注意:當趨勢方向發生變化後僅出現一個主要警報箭頭時,請注意可能會出現多個次要藍/紅箭頭。次要信號將在滿足信號標準的任何蠟燭圖後出現,因此在長期趨勢移動中,螢幕上將顯示大量次要箭頭(如附帶的截圖所示)。您可在設置中開啟或關閉任一箭頭類型。 以下是我使用此指標進行交易的方式: - 對於買入入場,我會耐心等待白箭頭在蠟燭收盤時出現,並在下一根可用蠟燭收盤時出現藍箭頭時進行買入交易。 - 對於賣出入場,我會耐心等待黑箭頭在蠟燭收盤時出現,並在下一根可用蠟燭收盤時出現紅箭頭時進行賣出交易。 - 獲利了結/止損設置由使用者自行負責,但我個人使用最低R:R為1:2,並發現這在倫敦/紐約開盤等
购买此指标即可免费获得我的专业交易管理器。 首先,值得强调的是,这个交易系统是一个非重绘、非重画和非滞后的指标,这使得它非常适合手动和机器人交易。 在线课程,手册和下载预设。 “智能趋势交易系统 MT5”是专为新手和经验丰富的交易者量身定制的综合交易解决方案。它结合了超过 10 个优质指标,具有 7 多个强大的交易策略,使其成为适用于各种市场条件的多功能选择。 趋势跟随策略:提供精确的入场和止损管理,以有效地跟随趋势。 反转策略:识别潜在的趋势反转,使交易者能够利用区域市场的机会。 剃头策略:专为快速准确的日内交易和短期交易而设计。 稳定性:所有指标都不会重绘、不会重画和不会滞后,确保可靠的信号。 定制:支持自定义策略,以满足个人交易偏好。超过 7 种策略和组合可帮助您找到最佳策略。 信号清晰度:提供箭头信号,以指示清晰的入场和退出点。 实时警报:通过交易进出警报使交易者保持了解。 深入分析:提供更高时间框架的趋势分析和实时交易监控。 自适应颜色编码:利用蜡烛颜色编码来显示成交量、趋势和反转蜡烛信号。通过蜡烛颜色分析市场方向。 “智能趋势交易系统 MT5”赋予交易者必要的工具,以便在
Dynamic Scalper System
Vitalyi Belyh
5 (1)
“ Dynamic Scalper System ”指标专为在趋势波内进行剥头皮交易而设计。 已在主要货币对和黄金上进行测试,并可与其他交易工具兼容。 提供顺势短线建仓信号,并提供额外的价格变动支持。 指标原理: 大箭头决定趋势方向。 在趋势波内,我们采用一种生成小箭头形式的剥头皮交易信号的算法。 红色箭头代表看涨方向,蓝色箭头代表看跌方向。 敏感的价格变动线会沿着趋势方向绘制,并与小箭头信号协同作用。 信号运作方式如下:当线在适当时刻出现时,将形成入场信号;在出现线时,持仓;线完成后,平仓。 建议的操作时间范围为M1 - H4。 箭头在当前K线上方形成,如果下一根K线已开仓,则不会重新绘制上一根K线上方的箭头。 输入参数 Trend Wave Period - 趋势方向(大箭头)的周期,改变趋势波的时间间隔。值 1 表示趋势方向的最长持续时间,参数值越大,持续时间越短。 Scalper Arrows Period - 信号箭头(小箭头)的计算周期,改变入场信号的生成频率。值 3 表示最频繁的生成频率,参数值越大,箭头频率越低,准确度越高。 这些参数可以根据不同的时间范
PZ Trend Trading
PZ TRADING SLU
4.8 (5)
许多盈利交易者不仅知道如何识别市场趋势,而且也能把握趋势建立后的交易机会。 Pz 趋势交易 指标设计用来在趋势行情中尽可能的赚取利润。 已建立的趋势提供了一揽子交易机会,但大多数趋势交易指标完全忽视了它们,让交易者在趋势行情时完全不知道该如何做!一般趋势指标只通知有关的趋势变化,但根本不足以得到卓越的回报. Pz 趋势交易 指标比一般趋势指标显示多达 20 倍的交易 , 因为它注重所谓的市场时机。它不仅显示当前的市场趋势,也有回调,内柱线的突破和调整。它令您在趋势回调之后介入,安全的柱线内突破金字塔加仓,以及发现潜在的反转,和已知的调整。 趋势改变 一个趋势改变在市场方向变化时发生。趋势变化在图表上用带数字的彩色圆圈显示。蓝色 (1) 信号为上涨开始, 而红色 (1) 信号为下跌开始。趋势变化并非评估当前价格动作的结果, 它意味着交易设置是不定时地。如果您正确使用本指标, 在趋势变化时, 您将将已经入场 (参看下面的调整)。 回调 但凡趋势在运动中,行情上下抖动,盈利者收割利润,且其它参与者入场。趋势回调代表好的买入机会,通常是由主力获利离场导致。如果行情在回调后回归上行, 指标将
GOLD Impulse with Alert
Bernhard Schweigert
4.67 (12)
这个指标是我们2个产品 Advanced Currency IMPULSE with ALERT  +   Currency Strength Exotics 的一个超级组合。 它适用于所有时间框架,并以图形方式显示8种主要货币和一种符号的强势或弱势冲动! 该指标专门用于显示任何符号的货币强度加速,如黄金、异国货币对、商品、指数或期货。这是它的第一个指标,任何符号都可以被添加到第9行,以显示黄金、白银、石油、DAX、US30、MXN、TRY、CNH等的真实货币强度加速(冲动或速度)。 建立在新的基础算法上,它使识别和确认潜在的交易更加容易。这是因为它以图形方式显示了一种货币的强势或弱势是否正在加速,并测量了这种加速的速度--把它想象成你汽车中的速度表。当你加速时,事情显然会发生得更快,这在外汇市场上也是一样的,即如果你配对的货币正在向相反的方向加速,你就会发现一个潜在的有利可图的交易。 动态市场斐波那契28水平被用作警报触发器,将适应市场活动。如果冲动击中黄色触发线,你将收到警报。然后你就知道作为一个交易员应该做什么。货币对和方向已经给出。只需点击警报按钮,就可以切换到该货
Day Trader Master
Oleg Rodin
5 (15)
Day Trader Master 是一个完整的日间交易者交易系统。该系统由两个指标组成。一个指标是买入和卖出的箭头信号。这是你得到的箭头指示器。我将免费为您提供第二个指标。第二个指标是专门设计用于与这些箭头结合使用的趋势指标。 指标不重复也不迟到! 使用这个系统非常简单。您只需按照当前趋势方向的箭头信号,显示为双色线。蓝色是买入趋势。红色是一种销售趋势。蓝色箭头是买入信号。红色箭头是卖出信号。您需要箭头的颜色和信号的方向来匹配趋势线的颜色。 箭头指标主要是为 M5 和 M15 时间间隔的日内交易而创建的。但从技术上讲,该系统可以用于其他时间间隔。 指示器配备带有推送消息功能的弹出警报。 购买后一定要写信给我!我将为您提供与系统交易的个人建议,以及我的趋势指标。此外,还有丰厚的奖励等着您!
Advanced Supply Demand
Bernhard Schweigert
4.91 (300)
现在优惠 40%! 任何新手或专业交易者的最佳解决方案! 该指标是一款独特、高质量、且价格合理的交易工具,因为我们已经整合了许多专有功能和新公式。 依据此更新,您将能够显示双重时间帧区域。 您不仅可以显示一个较高的时间帧,还可以同时显示图表时间帧,加上更高的时间帧:显示嵌套时区。 供需双方所有交易者都会喜欢它。 :) 重要信息披露 高级供需的最大潜力,请访问 https://www.mql5.com/zh/blogs/post/720245   想象您的交易如何得以改善,是因为您能够精准定位入场或目标位吗? 构建于新的底层算法,它可以更轻松地识别出买卖双方之间的潜在失衡。 这是因为它以图形方式展示供需最强劲区域,及其过去的表现(显示旧区域)。 这些功能旨在帮助您更轻松地发现最佳入场区域和价位。 现在您可以针对您的交易品种和时间帧来优化和编辑区域强度! 高级供需指标适用于所有产品和时间帧。 它是一个新的公式,非常新的功能是两个区域强度函数可由用户输入进行调整! 这在交易中是一大优势。 当您学习如何使用专有功能,例如带有价格游离最小 X 因子的区域强度时,您能够判断该区域强劲与否。 供需
Gold Scalper Super
Aleksandr Makarov
5 (2)
Gold Scalper Super is an easy-to-use trading system. The indicator can be used as a standalone scalping system on the M1 time frame, as well as part of your existing trading system. Bonus: when purchasing an indicator, Trend Arrow Super is provided free of charge, write to us after purchase. The indicator 100% does not repaint!!! If a signal appears, it does not disappear! Unlike indicators with redrawing, which lead to the loss of a deposit, because they can show a signal and then remove it.
PZ Support Resistance
PZ TRADING SLU
3.33 (3)
厌倦了绘制支撑线和阻力线? 支撑阻力 是一个多时间指标,可以自动检测并绘制图表中的支撑线和阻力线,并具有非常有趣的变化:随着时间的推移测试价格水平及其重要性的提高,线变得越来越粗。 [ 安装指南 | 更新指南 | 故障排除 | 常见问题 | 所有产品 ] 一夜之间增强您的技术分析 无需浏览图表即可检测重要的价格水平 一目了然地识别所有价格水平的相对优势 每次交易最多可节省半小时的绘图线 指标显示所有价格水平的期限 指示器不重涂 过去和现在的价格水平因接近程度而崩溃,并根据当前的市场行为进行了调整。在动作发生的地方绘制了线条,而不一定在峰值处绘制了线条。 价格水平随着时间的推移而被拒绝,变得越来越暗 定期清除不重要的价格水平以避免噪音 可自定义的时间范围选择和崩溃因子 它实现了电子邮件/声音/推送警报的突破 输入参数 指标设置:指标将从当前时间段读取价格,但您可以选择另一个。例如,您可以在H4图表中显示D1支撑线和阻力线。您还可以使用 价格水平密度 参数选择在图表上显示多少价格水平。 颜色设置:根据重要性输入所需的支撑线和阻力线颜色。 标签设置:(可选)可以在指示器中显示用于
Trend Screener
STE S.S.COMPANY
4.79 (95)
趋势指标,趋势交易和过滤的突破性独特解决方案,所有重要趋势功能都内置在一个工具中! 它是 100% 非重绘多时间框架和多货币指标,可用于所有符号/工具:外汇、商品、加密货币、指数、股票。 限时优惠:支撑和阻力筛选指标仅售 65美元,终身有效。(原价 250 美元)(优惠延长) 趋势筛选器是有效的指标趋势跟踪指标,它在图表中提供带有点的箭头趋势信号。 趋势分析器指标中可用的功能: 1.趋势扫描仪。 2. 具有最大利润分析的趋势线。 3.趋势货币强度计。 4. 带有警报的趋势反转点。 5. 带有警报的强趋势点。 6. 趋势箭头 每日分析示例,每日信号表现...等与我们的趋势筛选指标,可以在这里找到: 点击这里 限时优惠:Trend Screener Indicator 仅售 150 美元且终身可用。原价 199$) 通过访问我们的 MQL5 博客,您可以找到我们所有的高级指标以及分析示例、每日信号表现...等。 : 点击这里 我们的趋势系统由 2 个指标组成: 1. Trend Screener Indicator:显示趋势仪表盘、图表中的趋势线、入场点...等。 2. Trend
Super Signal – Skyblade Edition 專業級無重繪 / 無延遲趨勢信號系統,擁有卓越勝率 | 適用於 MT4 / MT5 在較低的時間週期上效果最佳,例如 1 分鐘、5 分鐘與 15 分鐘圖表。 核心特色: Super Signal – Skyblade Edition 是一套專為趨勢交易設計的智能信號系統。 其採用多重濾波邏輯,僅篩選出具有明確方向性、動能強勁且波動結構健康的走勢進場點。 本系統 不預測高點或低點 ,只有在同時滿足以下三項條件時才會觸發交易信號: 趨勢方向明確 動能持續增強 波動率結構穩定 此外,系統還結合市場流動性分析,以進一步提升信號的準確性與觸發時機。 信號特性: 所有箭頭信號皆為 100% 無重繪,無延遲 信號一旦出現即固定於圖表,不會閃爍或消失 提供圖表箭頭、資訊面板、彈出通知、聲音提示及推播訊息 支援 EA 呼叫(Buffer 輸出),可整合至自動化交易或信號跟單系統 提供預設參數模板,免調整即可使用,適合新手快速上手 總結: Super Signal – Skyblade Edition 是一款邏輯清晰、穩定高效的專業趨勢型
They say history repeats itself. What if you could prove it in real-time? The Propfolio Ghost Pattern is an advanced algorithmic pattern-matching engine. It empowers you to select any current price action structure on your chart and instantly scan thousands of historical candles to find the exact moment in the past where the market did the exact same thing. Once it finds the highest probability match, it projects the historical outcome into the future as "Ghost Candles"—giving you a highly calcu
目前有26%的折扣!! 这个指标是我们两个主要指标( Advanced Currency Strength 28   &  Advanced Currency IMPULSE with ALERT )的一个超级组合。它显示了28个外汇对的TICK-UNITS货币强度值和警报信号。可以使用11种不同的Tick-Units。它们是1、2、3、4、5、6、10、12、15、20和30秒。子窗口中的Tick-Unit栏将被显示并向左移动,当在一秒钟的定时器中至少有一个Tick。 只用一个图表,你就可以剥28个外汇货币对的头皮!想象一下,你的剥头皮将如何提高。想象一下,你的剥头皮将如何改善,因为你能够准确地确定剥头皮机会的触发点? 这是市场上第一个在比1分钟更短的时间内工作的货币强度指标! 它是为那些希望快速进出并从市场中切出小点数的快速剥头皮者准备的。 用户手册:点击这里 https://www.mql5.com/en/blogs/post/727178 特点。 为28个货币对提供嘀嗒单位的卖出/买入警报,有一个按钮可以快速打开目标图表。 在3种敏感模式中选择一种(慢-中-快
购买后请联系我,获取基于此指标的奖励EA。 Self Optimizing Double MA Strategy 是一款专业级别的交易工具,旨在消除参数猜测。它由内置的自动优化引擎驱动,通过在后台模拟数千种参数组合,不断适应不断变化的市场条件,从而保持统计上的优势。 该指标不依赖于静态、过时的设置,而是动态更新其内部逻辑,为当前的时间周期和交易品种寻找最赚钱的配置。 核心功能 内置自动优化:系统会根据您选择的更新频率,定期重新计算快速 MA、慢速 MA 和 RSI 的周期,确保您的设置始终与当前的市场节奏保持一致。 MA 发散过滤器:一项核心的趋势强度指标,仅在移动平均线积极发散时才确认信号的有效性。这可以防止在均线收敛或平缓的盘整市场中产生虚假的入场信号。 时序评分引擎:内部模拟器在图表上绘制任何实时信号之前,会根据您的具体目标(例如最大化利润因子或最小化回撤)对历史信号进行评估。 动态 ATR 区域:根据实时市场波动率,自动计算并在图表上直观地投射出止盈和止损区域。 实时绩效仪表板:直接在您的图表上跟踪并显示实时的系统指标,包括历史胜率、平均回撤以及产生的总点数。 完美支持 EA
Bull versus Bear
Mohamed Hassan
4.5 (18)
Send us a message after your purchase to receive more information on how to get your  BONUS  for FREE  that works in great combination with Bull vs Bear ! Bull versus Bear is an easy-to-use Forex indicator that gives traders clear and accurate signals based on clear trend retests . Forget about lagging indicators or staring at charts for hours because  Bull vs Bear provides real-time entries with no lag and no repaint, so you can trade with confidence. Bull vs Bear  helps you enter trades during
Advanced Currency Strength28 Indicator
Bernhard Schweigert
4.91 (657)
目前40%的折扣 任何新手或专家交易者的最佳解决方案! 这个指标是一个独特的、高质量的、可负担得起的交易工具,因为我们纳入了一些专有的功能和一个新的公式。只需一个图表,你就可以读出28个外汇对的货币强度!想象一下,你的交易将如何得到改善,因为你的交易是在你的手中进行的。想象一下,你的交易将如何改善,因为你能够准确地确定新趋势或剥头皮机会的触发点? 用户手册:点击这里  https://www.mql5.com/en/blogs/post/697384 这是第一本,原版的! 不要买一个毫无价值的崇拜者的克隆品。 特别的 子窗口中的箭头显示强劲的货币势头GAP将指导你的交易! 当基础货币或报价货币处于超卖/超买区域(外盘斐波那契水平)时,在个人图表的主窗口中出现警告信号。 当货币力量从外围区间回落时,回撤/反转警报。 十字星模式的特别警报 可选择多个时间框架,以快速查看趋势! 货币强度线在所有的时间框架中都非常平稳,当使用较高的时间框架来识别总体趋势,然后使用较短的时间框架来确定精确的入口时,效果非常好。你可以根据自己的意愿选择任何时间框架。每个时间框架都由其自身进行了优化。
Cyclic Impulse
Vitalyi Belyh
构建图表并识别周期性价格变动的技术指标。 可以在任何图表上工作。 几种类型的通知。 图表本身还有额外的箭头。 无需重新绘制历史记录,只需关闭蜡烛即可。 建议使用 M5 及以上的 TF。 易于使用和配置参数。 当使用 2 个具有不同参数的指标时,您可以单独使用它们,而无需其他指标。 有 2 个输入参数 周期性和信号持续时间 这两个参数处理图表结构的处理。 Cyclicity 调节反转周期的变化频率,平滑周期。 Signal duration 为最小数字,检测价格变动中的脉冲,最大长期趋势变动。    ---------------------------------------------------------------------------------------
Special offer : ALL TOOLS , just $35 each! New tools   will be   $30   for the   first week   or the   first 3 purchases !  Trading Tools Channel on MQL5 : Join my MQL5 channel to update the latest news from me Fibonacci Confluence Toolkit Multi-Timeframe 是为专业交易员设计的高级技术分析工具,通过结合关键的市场信号和模式,帮助识别潜在的价格反转区域。通过时间框架选择器仪表板的多时间框架显示功能,该工具包提供了对市场动态的全面和深入的视图,使您能够做出准确和及时的交易决策。 查看更多MT5版本,请访问:  Fibonacci Confluence Toolkit MT5 Multi Timeframe 查看更多产品,请访问:   所有P 产品 主要特点 多时间框架分析 Fibonacci Confluence Toolkit Mult
作者的更多信息
MACD Message
Dmitriy Moshnin
MACD Message is an analogue of the MACD Alert for the MetaTrader 4 terminal with more advanced functionality: Parameters 'Averaging Method' and 'Price Type' ( MA method and Apply to ) are displayed in the settings window. It gives an advantage of monitoring convergence/divergence of all types of Moving Average (Simple Averaging, Exponential, Smoothed and Linear Weighted) and by any price (Closing Price, Opening Price, the Maximum Price for the Period, the Minimum Price for the Period, Median Pri
Symbol Profit
Dmitriy Moshnin
这款指标用于 MetaTrader 4。它在图表窗口中,小型,美观紧凑,可十分便利地显示所有必要信息: 它们的开仓手数和总盈利。字体大小, 位置和颜色可以根据您的偏好设置。省缺时,正盈利持仓显示为绿色,负盈利则为红色。祝交易好运!
Unlike the standard indicator, Stochastic Oscillator Message ( please see the description and video ) features an alert system that informs you of changes in the market situation using twenty signals: the Main line and Signal line cross in the area above/below the levels of extremum (below 20%; above 80%); the Main line and Signal line cross within the range of 20% to 80%; the Main line crosses the levels of extremum; the Main line crosses the 50-level; divergence on the last bar. Parameters of
RSI TrendLine Divergency Message is an indicator for the MetaTrader 4 trading platform. Unlike the original indicator, this three in one version has a system of alerts that inform on market situation changes. It consists of the following signals: when the Main line crosses the levels of extreme zones and 50% level; when the Main line crosses the Trend line in the indicator window; divergence on the last bar. Parameters of levels of extremum, 50-level and divergence are adjustable. Parameters La
MACD Color
Dmitriy Moshnin
彩色 MACD ( 请看描述和视频 ) 是一款用于 MetaTrader 4 交易平台的指标,类似于 MACD 消息 。不同于标准指标,在市场情况变化时,它改变柱线边缘颜色 - 趋势强度变化,或是主 EMA 相对于零轴的倾角变化 - 它会改变零轴颜色 (这个参数可以在设置中禁用)。 来看看如何在一个可盈利的多货币 交易策略 的所有时间帧中应用这个指标,它也适于在您的移动终端上交易。 祝交易好运!
The Four Moving Averages Message indicator ( please see the description and video ), a version of Four Moving Averages , concurrently displays four Moving Averages with default settings in the main chart window: Green and Red ones represent a short-term trend, Red and Blue ones - mid-term trend, while Blue and Yellow ones - long-term trend. You can change the moving average settings and colors. However, these parameters have been configured so that to allow trading on all time frames. The built-
用于 MetaTrader 4 交易平台的显示随机波动系统指标 ( 参见描述 (俄语) ) 在图表窗口里尺寸很紧凑, 它可以在单一窗口里显示所有时间帧的随机波动指标结果。每个时间帧的参数分别设置。字体大小, 边角和颜色可以根据您的偏好设置。省缺, 买信号为绿色,卖信号为红色。超买行情为深红色 (准备卖出 -> 等待红色)。超卖行情为深绿色 (准备买入 -> 等待绿色)。它最好配合 显示 ADX 系统 指标一起使用,因为当 ADX 处于趋势时, 建议忽略随机波动的信号。 祝交易好运!
用于 MetaTrader 4 交易平台的显示 ADX 系统指标 ( 参见描述 (俄语) ) 在图表窗口里尺寸很紧凑, 它可以在单一窗口里显示所有时间帧的 ADX 指标结果。每个时间帧的参数分别设置。字体大小, 位置和颜色可以根据您的偏好设置。省缺, 时间帧的颜色名称如下: 无趋势 - 白色, 牛势 - 绿色, 熊势 - 红色。如果在横盘区域最后三根柱线的 ADX 上涨: 上行趋势 - 深绿色, 下行趋势 - 深红色。它最好配合 显示随机波动系统 指标一起使用,因为当 ADX 未处于趋势时, 建议使用随机波动的信号。 祝交易好运!
The Level Moving Averages indicator ( see the description and video ) does not draw the Moving Average line in the chart window but marks the Moving Average level on all time frames in accordance with the specified parameters. The level move frequency corresponds to the TimeFrame parameter value specified. The advantage of this indicator lies in the fact that it offers the possibility of monitoring the interaction between the price and the MA of a higher time frame on a lower one (e.g., the MA l
The Level S Moving Averages indicator ( see the description and video ) does not draw the Moving Average line in the chart window but marks multiple levels (such as close, highs and lows of any bar on the time frames from M1 to D1, W1, MN - strong levels) of the Moving Average on all time frames in accordance with the specified parameters. The level move frequency corresponds to the TimeFrame parameter value specified. The advantage of this indicator lies in the fact that it offers the possibili
The Level Moving Averages Message indicator ( see the description and video ) does not draw the Moving Average line in the chart window but marks the Moving Average level on all time frames in accordance with the specified parameters. The level move frequency corresponds to the TimeFrame parameter value specified. The advantage of this indicator lies in the fact that it offers the possibility of monitoring the interaction between the price and the MA of a higher time frame on a lower one (e.g.,
Lot Calculation
Dmitriy Moshnin
手数大小计算器 ( 参见描述 ) 基于可用保证金百分比计算手数, 以及针对图表窗口中通过移动水平线设置的仓位的盈利, 亏损和盈亏比。 更多的高级模拟手数计算器是 盈利因素 指标。
显示趋势均线系统指标 ( 参看它的描述 ) 在一个窗口里显示所有时间帧的有关趋势方向 H1, H4, D1, W1, MN, 以便您在旧的柱线收盘之前跟踪均价的变化。趋势单位是旧的柱线收盘价的周期为 "1" 的均线 (H1, H4, D1,  W1, MN)。指标重新计算内部旧有柱线的值,并在图表窗口里绘制趋势坡度作为时间间隔的彩色名称: 绿色 -上升, 红色 - 下跌。字体大小, 坡度角度和颜色均可定制。例如, 附加的截图是在 H1 以内的时间帧上表现一根 H1 柱线的彩色区域和均价变化 (移动均线)。请注意指标没有绘制移动均线。 希望您交易成功!
ADX Message
Dmitriy Moshnin
Отличается от стандартного индикатора дополнительным набором настроек и встроенной системой оповещений. Индикатор может подавать сигналы в виде алерта ( Alert ), комментария в левый верхний угол главного окна графика ( Comment ), уведомления на мобильную версию терминала ( Mobile МТ4 ), электронный почтовый ящик ( Gmail ).  Параметры индикатора Period — период расчета индикатора; Method — выбор метода усреднения: простой, экспоненциальный, сглаженный, линейно-взвешенный; Apply to — выбор использ
双移动均线指标在主图表窗口同时显示两条省缺设置的均线: 绿线和红线代表短期趋势。您可以改变移动均线设置和颜色。不过,这些参数已经配置好,可在所有时间帧内交易。来看看移动均线如何用于所有时间帧的可盈利多货币 交易策略 , 它也适用于移动终端交易。 希望您交易成功!
三移动均线指标在主图表窗口同时显示三条省缺设置的均线: 绿线和红线代表短期趋势,红线和蓝线代表长期趋势。您可以改变移动均线设置和颜色。不过,这些参数已经配置好,可在所有时间帧内交易。来看看移动均线如何用于所有时间帧的可盈利多货币 交易策略 , 它也适用于移动终端交易。 希望您交易成功!
The alerting system for the MetaTrader 4 platform 'Two Moving Average Message' consists of two moving average lines with individual parameters. The indicator can generate alerts ( AlertMessage )б display a comment in the upper left corner of the main chart window ( CommentMessage ), send notifications to the mobile terminal version ( MobileMessage ), send emails ( GmailMessage ) and play two different sounds at the intersection of lines upwards or downwards. Parameters Language – choose language
Three Moving Averages Message is a notification system for the MetaTrader 4 platform. It consists of three moving averages which have their own adjustable parameters. Slow and Long lines determine long-term trend, while Fast and Slow lines - short-term. If the lines Fast and Slow are crossed during a trend, the indicator displays a recommendation for buying (selling). If the lines Slow and Long are crossed, the indicator notifies of the start of a up/down trend. Concerning other types of crossin
Profit Factor
Dmitriy Moshnin
The Profit Factor indicator calculates one of the three parameters: 1 - market entry level (in the 'Calculate the' parameter - Market Open Trade), 2 - the Stop Loss level (Calculate the - Market Price Loss), 3 - the Take Profit level (Calculate the - Market Price Profit) - with a desired profit/loss ratio (Profit Factor), as well as the lot size (trade volume) according to the value of the risk percentage of available funds specified in the settings (a simpler analog is the Lot Calculation indic
MACD Converter
Dmitriy Moshnin
MACD Converter is an analogue of the MACD Message with more advanced functionality: It has two signal lines: Signal Line 1 and Line 2, bar outlines are colored according to Line 1, it also triggers the trend notifications. MACD Converter converts the parameters of Fast MA, Slow MA and Signal Line 1 and Line 2 lines from the interval specified in the settings (Convert Time Frame) to smaller timeframes. This allows receiving a signal for making a decision within the specified (Convert Time Frame)
LTT Range System
Dmitriy Moshnin
Индикатор Форекс LTT Range System показывает на графике средние диапазоны движения рыночной цены за периоды M 15, H 1, H 4, D 1, W 1, MN 1.  Верхняя и нижняя границы диапазонов рассчитываются от цены открытия бара. Пивот – середина между ценой открытия бара и границей диапазона: если рыночная цена находится выше цены открытия бара – метка пивота располагается между ценой открытия бара и верхней меткой диапазона, если рыночная цена находится ниже цены открытия бара – метка пивота располагается ме
Parabolic Converter is and analogue of the Parabolic indicator for МТ4 which can automatically recalculate parameters of Time Frame specified in settings for lower time periods. It has a Notification System which triggers when the price movement direction is changed. For example: if we set Time Frame 1 Hour to H1 and M30, M15, M5 and M1 contained therein, we can see the indicator's readings corresponding to H1 (fig.). At that, if we add one more Parabolic on the same chart (of several charts) wi
RSI Converter
Dmitriy Moshnin
Relative Strength Index with advanced functionality recalculates (converts) the averaging period in accordance with the value of parameter Time Frame for lower chart time intervals (Multi-TimeFrame (MTF)). Unlike the standard indicator, RSI converter includes an alert system that notifies about changes in market situation, it consists of the following signals: Main line crosses levels of extreme zones (30%, 70%) and the level of 50%; The main line crosses one or two trendlines in the indicator w
Commodity Channel Index Message is an indicator for the MetaTrader 4 trading platform. Unlike the original indicator, this three in one version has a system of alerts that inform on market situation changes. It consists of the following signals: when the Main line crosses the levels of extreme zones and 50% level; when the Main line crosses the Trend line in the indicator window; Divergence on the last bar. Values of the middle and extreme levels and divergence zones are customizable. Parameter
MACD TrendMA
Dmitriy Moshnin
The MACD TrendMA indicator is a trading system developed on the basis of the MACD indicator popular among many traders, and which is based on measuring the inclination (trend) angle of the moving averages, while measuring the ratio (convergence/divergence) between them. The signal for entering/exiting the market is the frame of the bars colors and color of the MACD TrendMA histogram according to the trend, which can be customized in the properties window of the indicator - in case the inclinatio
MACD Temp
Dmitriy Moshnin
MACD Temp is a system of two oscillators, which allows to track the price changes of the Fast and Slow periods in case of their convergence/divergence. The bar border is colored in accordance with the MACD trend, while the color of the histogram changes when the values of the Momentum indicators cross the level of 100, for respective periods: Fast Moving Average (Fast Momentum), Slow Moving Average (Slow Momentum), selectively or for both values (the mode is to be chosen in the indicator propert
MACD CloseBars
Dmitriy Moshnin
The MACD CloseBars indicator is a trading system based on the MACD indicator popular among many traders, which is built on the principle of bars closing above the moving averages selected in the indicator settings. The signal for entering/exiting the market is the frame of the bars colors according to the trend: in case the bars in the main window of the chart are closed above/below the Fast Moving Average, Slow Moving Average individually or both together. Indicator Parameters Fast Moving Aver
MACD ColorBars
Dmitriy Moshnin
MACD ColorBars paints bar frames according to a trend, as well as changes the histogram color when MACD bars are rising or falling (if Color Bars is enabled in the inputs window). The growth of bars indicates a divergence between the fast and slow moving averages, while the decrease indicates their convergence. Parameters Fast Moving Average - period of the fast moving average; Slow Moving Average - period of the slow moving average; MA method - moving average smoothing method (simple, exponent
MACD Volume
Dmitriy Moshnin
The MACDVolume indicator is a trading system based on the increase in tick volumes in bars, which match the trend. Indicator Parameters Fast Moving Average - period of the fast moving average; Slow Moving Average - period of the slow moving average; MA method - averaging method of the moving averages (simple averaging, exponential, smoothed and linear-weighted); Apply to - applied price of the moving averages (Close, Open, High for the period, Low for the period, Median, Typical and Linear-Weig
MACD BBands
Dmitriy Moshnin
MACD BBands is a trading system based on MACD and Bollinger Bands placed in a single window. The indicator shows moving average slope angle (trend) change, compares their ratio (convergence/divergence) and allows sorting out signals using Bollinger Bands. The indicators are calibrated in such a way that the middle Bollinger Bands line is the zero level of the MACD indicator. Parameters Period - Bollinger Bands period; Deviations - number of standard deviations; Shift - shift relative to price;
筛选:
sunnychow
9043
sunnychow 2018.12.16 09:04 
 

用户没有留下任何评级信息

Maksym Mudrakov
30050
Maksym Mudrakov 2016.08.31 15:32 
 

用户没有留下任何评级信息

Vadim Strelkov
7710
Vadim Strelkov 2014.05.06 15:14 
 

用户没有留下任何评级信息

回复评论