MACD TrendMA
- 指标
-
Dmitriy Moshnin
 Торговать нужно так, чтобы не было мучительно больно за бесцельно вложенные деньги...
 - 版本: 1.1
- 更新: 20 十一月 2021
- 激活: 5
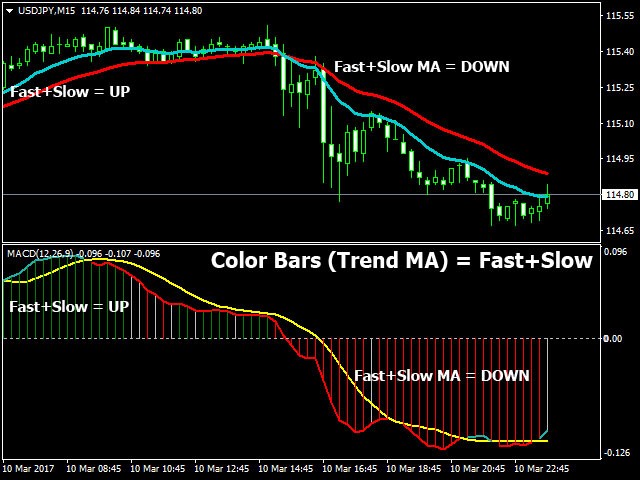
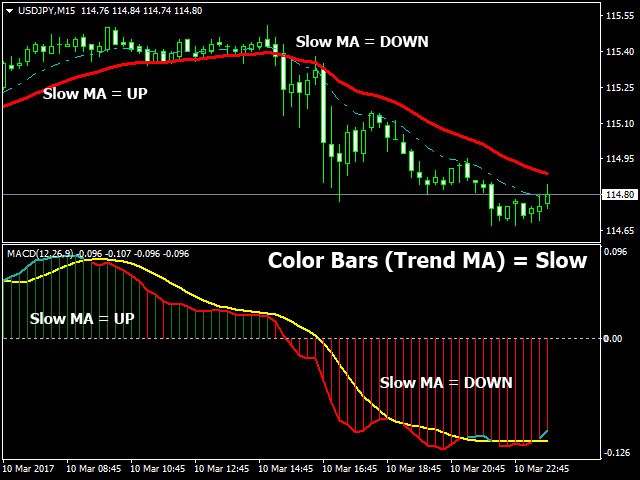
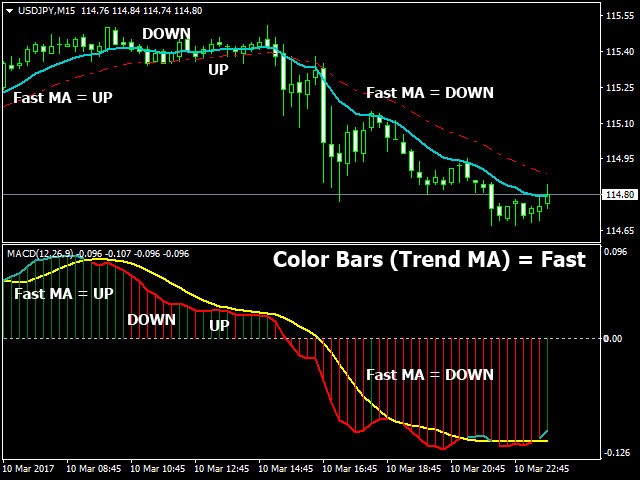
The MACD TrendMA indicator is a trading system developed on the basis of the MACD indicator popular among many traders, and which is based on measuring the inclination (trend) angle of the moving averages, while measuring the ratio (convergence/divergence) between them. The signal for entering/exiting the market is the frame of the bars colors and color of the MACD TrendMA histogram according to the trend, which can be customized in the properties window of the indicator - in case the inclination angles of the Fast Moving Average or Slow Moving Average in the main window of the current chart change individually or both together.
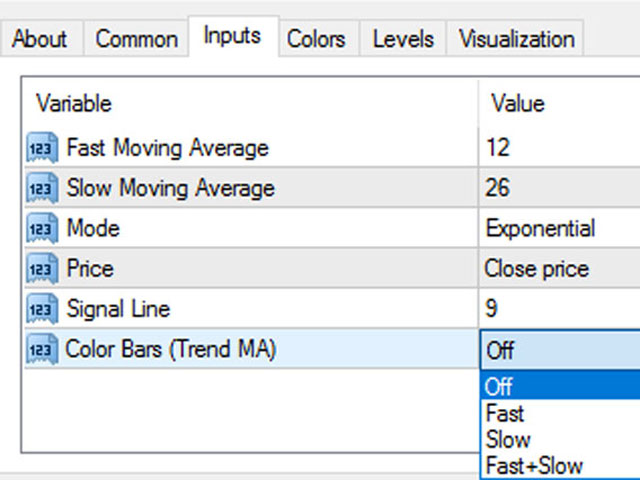
Indicator Parameters
- Fast Moving Average - period of the fast moving average;
- Slow Moving Average - period of the slow moving average;
- MA method - averaging method of the moving averages (simple averaging, exponential, smoothed and linear-weighted);
- Apply to - applied price of the moving averages (Close, Open, High for the period, Low for the period, Median, Typical and Linear-Weighted);
- Signal Line - period of the signal line;
- Color Bars (Trend MA) – change the color of the indicator bars when changing Fast and (or) Slow Moving Average slope angles.
More functional versions of the indicator: MACD Message and MACD Converter.
Happy Trading!

用户没有留下任何评级信息