Pivot Timeframe
- 指标
- 版本: 1.21
- 更新: 25 九月 2018

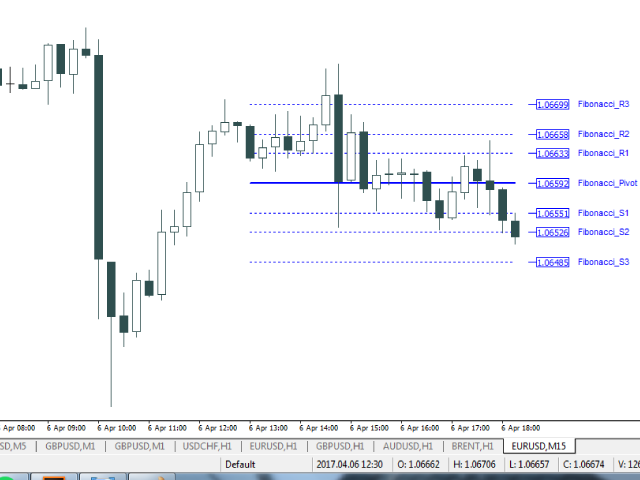
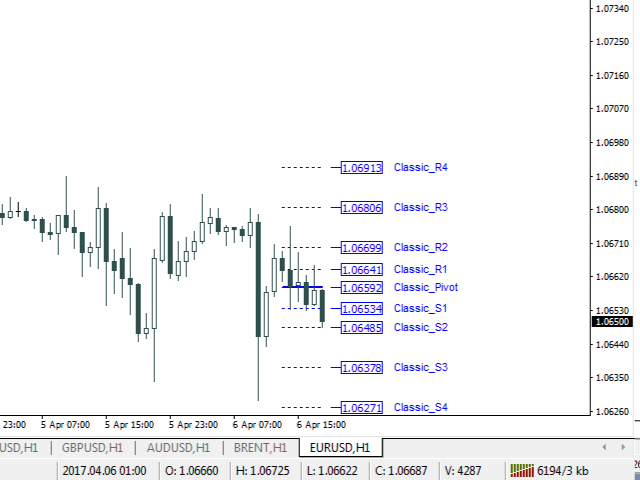
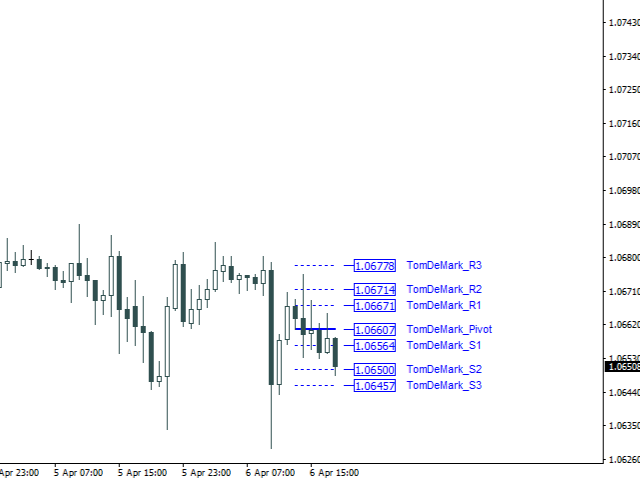
Daily pivot are relatively important in trading.
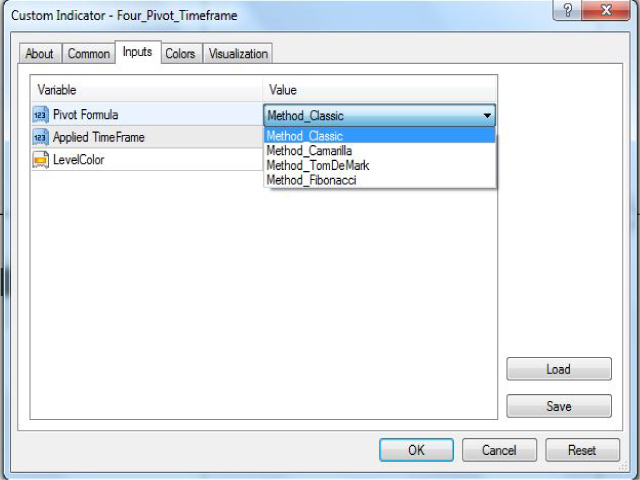
This indicator have options to select 5 commonly use pivot point calculations.
User input
- Choose Pivot Point Calculation (Method Classic, Method Camarilla, Method TomDeMark, Method Fibonacci or Method Woodies.)
- Choose Applied Timeframe for the calculation (M5, M15, H1, H4, D1, W1 etc)
- Can be attached to any timeframe
- Choose color of Pivot point
For MT5 version, please refer here: https://www.mql5.com/en/market/product/38816


useful, thanks