RaysFX EMA Crossover

RaysFX EMA Crossover

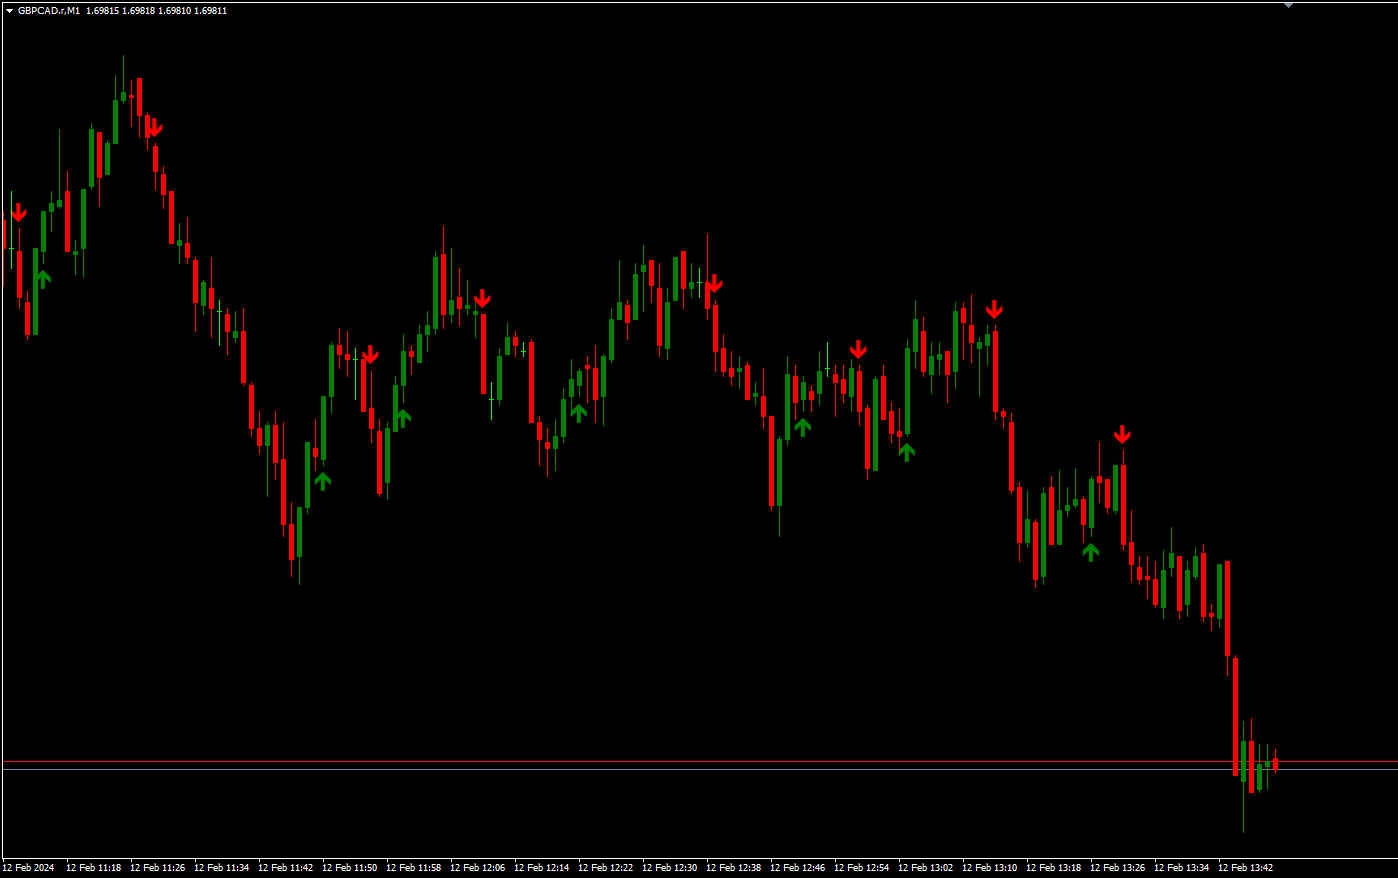
Scopri i potenziali punti di inversione del mercato con l’indicatore di Crossover EMA di RaysFX. Questo indicatore utilizza una combinazione di due medie mobili esponenziali (EMA) - una più veloce e una più lenta - per identificare i possibili punti di ingresso e uscita.

Caratteristiche principali:

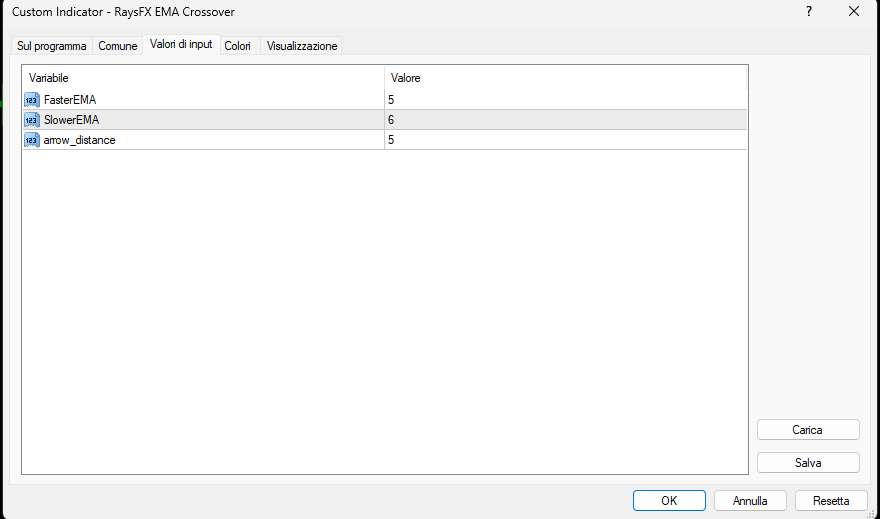
  1. Due EMA: Utilizza una EMA più veloce e una più lenta per catturare i movimenti di mercato a breve e lungo termine.
  2. Segnali di crossover: Genera un segnale quando l’EMA più veloce incrocia l’EMA più lenta, indicando un possibile cambio di tendenza.
  3. Personalizzabile: Puoi modificare i periodi delle due EMA e la distanza delle frecce dal prezzo per adattare l’indicatore al tuo stile di trading.
  4. Facile da usare: Le frecce verdi e rosse rendono facile vedere quando si verifica un crossover.


推荐产品
Trend MA Candles
Claus Dietrich
4.14 (7)
COLORED TREND MA / MACD CANDLES draw MA Candles above/below Moving Average in a single color draw MA as a leading Line like a Supertrend draw MA as a Channel => MA High and Low draw MACD Candles above and below 0 and Signal-Line Your  Advantage: a simple view of the trend direction a simple view over the higher trend direction a calmer chart for the eye clear rules can be defined Settings: Bars to process : 6000 is my default, this value is up to you Value Quick-Set : pre-Settings MACD 12 / 26
FREE
OsMA Arrow MTF
Pavel Shutovskiy
3.9 (10)
The indicator displays crossing zero level by Moving Average of Oscillator (OsMA) in the form of arrows. The this is a multi-timeframe indicator, and it displays signals from other timeframes. The indicator notifies about a signal by means of a pop-up Alert window, or sending notification to e-mail. Parameters Time-frame - select timeframe to show indicator signals. Fast EMA Period - fast EMA. This is an exponential moving average from a price with a short period. Slow EMA Period - slow EMA. Th
FREE
R 2EMA Color
Rwy Ksyby
5 (2)
MT4 的 R 2EMA 颜色指标基于 2 个 EMA 的交叉提供可靠的交易信号。 关键点 当价格交叉并收于两条绿色 EMA 上方时,它会产生买入交易信号。 当价格交叉并收于两条红色 EMA 上方时,它会产生卖出交易信号。 R 2EMA Color Forex 指标使确定何时买卖变得更加容易 当 2 条 EMA 线变为绿色时,出现买入信号。 当 2 条 EMA 线变为红色时,出现卖出信号。 如何与之交易? 一旦两条 EMA 信号线从红色变为绿色,就开始买入交易,现在趋势是积极的。 一旦两条 EMA 信号线从绿色变为红色,就开始卖出交易,现在趋势是负面的。 当图表上出现相反的交易信号时退出交易。 随意使用您自己喜欢的交易方法通过 R 2EMA 颜色指标打开和关闭交易。 规格 交易平台:Metatrader 4 (MT4) 货币对:适用于任何货币对 时间范围:适用于任何时间范围 输入参数:快、慢、模式、价格、信号条、警报消息、警报声音、警报电子邮件、警报移动、颜色设置和样式 指标类型:价格行为
FREE
The Crossing
Anton Iudakov
5 (2)
+ 2 bonus strategies! Alerts! I recommend watching my advisor -   Night Zen EA The indicator combines the most popular moving average strategies: Simple moving average crossover. Moving average crossover relative to the position of the slower moving average. 2 bonus strategies : The crossing of the fast moving average with the calculation of the opening prices of the slow moving average with the calculation of the closing prices taking into account the slower moving average. (The settings for th
FREE
Extremum by trend
Anton Iudakov
5 (2)
Looking for entry points along the local trend without repaint! Arrows indicate entry points. Based on classic indicators. The indicator is easy to use. Settings Наименование Описание Frequency factor Signal frequency. The less, the more often. This affects the quality. Recommendations Recommended for use on major currency pairs. Timeframe from m5, m15, m30 Subscribe to my telegram channel, where we discuss intraday trading, ideas, indicators, etc., a link in my profile contacts.
FREE
Trendline indicator
David Muriithi
2 (1)
Are you tired of drawing trendlines every time you're analyzing charts? Or perhaps you would like more consistency in your technical analysis. Then this is for you. This indicator will draw trend lines automatically when dropped on a chart. How it works Works similar to standard deviation channel found on mt4 and mt5. It has 2 parameters: 1. Starting Bar 2. Number of bars for calculation The   starting bar   is the bar which drawing of the trend lines will begin, while the   number of bars for c
FREE
Tipu Heikin Ashi Panel
Kaleem Haider
4.56 (18)
Tipu Heikin-Ashi Panel is the modified version of the original Heiken Ashi indicator published by MetaQuotes here . A professional version of this indicator is available here . Features An easy to use Panel that shows the Heiken Ashi trend of selected timeframe. Customizable Buy/Sell alerts, push alerts, email alerts, or visual on-screen alerts. Customizable Panel. The panel can be moved to any place on the chart or minimized to allow more space. Heikin means "the average", and Ashi means "foot
FREE
这种用于从无穷远衡量货币强弱的创新指标是长期交易的黄牛和交易者不可或缺的助手。 分析货币强弱的系统早已被世界领先的交易者所熟知并在市场上使用。 没有这种分析,任何套利交易都是不完整的。 我们的指标很容易确定基础货币相对于彼此的强弱。 它显示所有或当前货币对的折线图,允许即时分析和搜索最强的入口点。 该指标直观,允许您快速找到并切换到任何一对,具有可放置在地下室和主图表上的移动面板。 通知货币强度变化的计时器模式使交易者有机会在手机上收到通知。  使用货币功率计无穷大指示器的几种策略: 1. 使用货币强度的线性显示图表搜索交叉点作为新兴趋势的信号 2. 在趋势反转信号出现后,向强势货币方向反弹 3. 使用货币强度发散分析扭转当前趋势 4. 使用其他无限指标向强势货币方向交易 
FREE
Candle Countdown — MT4 精确K线倒计时 Candle Countdown 是一个简单且精确的工具,可在图表上显示 当前K线剩余时间 。 当交易入场依赖K线收盘时,即使几秒钟也非常关键。 该指标帮助您看到准确时间,从而在无需猜测或仓促决策的情况下进行交易。 用于精确控制K线收盘时间的工具。 指标显示内容: 当前K线剩余时间 服务器当前时间 点差(Spread) 止损最小距离(Stop Level) 该计时器独立于行情跳动(tick),通过平台内部定时器更新,即使在市场波动较低时也能保持稳定显示。 在低波动环境下依然可以获得平滑且稳定的倒计时效果。 所有信息显示在带背景的区域中,在任何图表配色下都清晰可见,并且不会影响图表分析。 随着K线接近收盘,计时器颜色会发生变化,帮助您快速判断当前状态。 提供 MT5 版本: Candle Countdown MT5 实际应用 使用该计时器可以提高入场时机和交易控制: 等待信号K线收盘 在新K线开始时同步入场 避免过早决策 指标可自然融入图表界面,不影响分析 : 不影响图表对象 切换周期时保持稳定 不会增加终端负担 计划更
FREE
特别优惠 : ALL TOOLS ,每个只需 $35 ! New tools   will be   $30   for the   first week   or the   first 3 purchases !  Trading Tools Channel on MQL5 : Join my MQL5 channel to update the latest news from me Volume Zones Internal Visualizer Multi-Timeframe ——如果您想在更高周期图表上查看更低周期的详细交易量情况,这是最理想的解决方案。它是一款功能强大且直观的交易量分析工具,支持多周期功能,能满足您的需求! 查看更多 MT5 版本:  Volume Zones Internal Visualizer MT5 Multi TF 查看更多产品:   All P roducts Why Choose Volume Zones Internal Visualizer Multi-Timeframe? 在高周期图表上显示低周期交易量 此指标提供 “alternat
OrderBlock TS Roman
Vladislav Vlastovskii
3.8 (5)
Индикатор строит блоки заказов (БЗ) по торговой системе (ТС) Романа. Поиск блоков осуществляется одновременно на двух таймфремах: текущем и старшем (определяемым в настройках). Для оптимизации и игнорирования устаревших блоков в настройках задается ограничение количества дней в пределах которых осуществляется поиск блоков. Блоки строятся по правилам ТС состоящем из трех шагов: какую свечу вынесли (что?); какой свечой вынесли (чем?); правило отрисовки (как?).
FREE
SMA Indicator
Nitu Brijesh Yadav
Arrow Indicator (Buy/Sell Alerts) – Simple Yet Powerful Tool!             Product Version: 1.01           Indicator Type: Trend Reversal Signals           Timeframes Supported: All (Recommended: H1, H4, D1)           Key Features: Buy Signal: Green upward arrow () appears below the candle  Sell Signal : Red downward arrow () appears above the candle Accurate Trend Reversal Detection – Based on tried and tested SMA strategy. ️ Clean Chart View – Minimalist, non-i
FREE
Crystal Heikin Ashi MT4
Muhammad Jawad Shabir
4 (1)
Crystal Heikin Ashi – 高级可视化 Heikin Ashi (MT4 版本) 概述 Crystal Heikin Ashi for MetaTrader 4 是一款专业级别的 Heikin Ashi 指标,为价格行为交易者、剥头皮交易者和分析师提供清晰的图表可视化。 此 MT4 版本专注于纯净的 Heikin Ashi 蜡烛与智能样式,同时保持轻量化和高速性能。 提示: 趋势着色和高级动能检测仅在 MT5 版本提供: MT5 版本 → https://www.mql5.com/en/market/product/142042 主要功能 (MT4) 原生 Heikin Ashi 蜡烛。 可自定义多头/空头颜色。 可隐藏默认蜡烛。 支持浅色/深色主题。 高速计算,适合长周期历史。 清晰显示价格走势和反转。 参数 蜡烛样式:标准。 图表主题:浅色/深色。 适合人群 价格行为交易者。 剥头皮交易者。 希望在 MT4 使用简洁 Heikin Ashi 图表的交易者。 风险提示 该指标仅为技术可视化工具,不提供投资建议,也不能保证盈利。请在模拟账户测试后再用于真实交易,并做好风
FREE
HMA Trend
Pavel Zamoshnikov
4.54 (70)
A trend indicator based on the Hull Moving Average (HMA) with two periods. The Hull Moving Average is an improved variant of the moving average, which shows the moment of trend reversal quite accurately. It is often used as a signal filter. Combination of two types of Hull Moving Averages makes a better use of these advantages: HMA with a slow period identifies the trend, while HMA with a fast period determines the short-term movements and signals in the trend direction. Features The movement d
FREE
User friendly indicator.  This indicator will help you catch the trend an fast as possible. Indicator developed based on moving averages. User can select which type of moving averages they want to use. Indicator draws an arrow when the moving average crosses. The moving average cross over arrow can be filtered with RSI, OsMA, and Parabolic Sar. There are options for selecting specific criteria for the filters.  Such as period of Rsi and Rsi levels. OsMA and Parabolic Sar criteria can also be sel
Double Price Channel   设置中指定的特定数量柱的价格通道指标。 指标线代表动态支撑或阻力位。上限为一定周期数的最高价,下限为最低价。与基于收盘价的移动平均线不同,该指标不会因小幅波动而“分心”。仅当边界发生变化时才会重新计算。如果是后者,那么值得认真思考一个新趋势的走向。有些策略是在一张图表上同时使用两个不同时期的指标。在这种情况下,周期较短的指标位于第二个指标内。 指标设置说明: Width_Bars - 指标周期 高度 - 高度,以磅为单位 Double Price Channel   设置中指定的特定数量柱的价格通道指标。 指标线代表动态支撑或阻力位。上限为一定周期数的最高价,下限为最低价。与基于收盘价的移动平均线不同,该指标不会因小幅波动而“分心”。仅当边界发生变化时才会重新计算。如果是后者,那么值得认真思考一个新趋势的走向。有些策略是在一张图表上同时使用两个不同时期的指标。在这种情况下,周期较短的指标位于第二个指标内。 指标设置说明: Width_Bars - 指标周期 高度 - 高度,以磅为单位
FREE
Color Macd Tf
Syarif Nur Arief
MACD is well known indicator that still can be use for prediction where price will go next few minutes, hours or even weekly  With colored bar of Macd, your eyes can easily catch when color is changed based what market price movement to find any early trend on market. here is the parameter of the indicator: TF_MACD , default is 1 Hour , this mean you can see clearly MACD of 1 Hour TimeFrame on Lower TimeFrame. InpPrice , default is Price Close , this is original MACD parameter from Metaquotes st
FREE
RelicusRoad MACD v2
Relicus LLC
4.6 (5)
移动平均收敛发散(MACD)交易策略是一种流行的技术分析工具,用于识别动量和趋势方向的变化。MACD的计算方法是将26期指数移动平均线(EMA)减去12期EMA。然后在MACD上方绘制一个9期EMA,称为“信号线”,以充当买入和卖出信号的触发器。 当MACD线在信号线上方时,MACD被认为处于看涨区域,在下方时处于看跌区域。交易者经常使用这些信息来确定潜在的买入和卖出机会。 MACD是一种多功能指标,可以用多种方式使用,其中一些常见的用法包括: 交叉:当MACD线穿过信号线时,出现看涨交叉;当MACD线穿过信号线下方时,出现看跌交叉。 发散:当MACD正在创造新高时,而基础证券没有创造新高时,出现看涨发散;当MACD正在创造新低时,而基础证券没有创造新低时,出现看跌发散。 趋势跟踪:当MACD在零线上方时,出现看涨趋势;当MACD在零线下方时,出现看跌趋势。 需要注意的是,MACD是一种滞后指标,应与其他技术指标和分析结合使用才能做出交易决策。
FREE
MACD Arrows indicator
Nedyalka Zhelyazkova
MACD Crossover Arrows & Alert is a MT4 (MetaTrader 4) indicator and it can be used with any forex trading systems / strategies for additional confirmation of trading entries or exits on the stocks and currencies market. This mt4 indicator provides a   BUY signal   if the MACD main line crosses above the MACD   signal  line . It also displays a   Sell signal   if the   MACD main line crosses  below the MACD   signal  line . STRATEGY Traders can use the MACD signal alerts from a higher time frame
FREE
TCCI with Alert
Wen Huang
4.75 (4)
这是基于自定义算法的类均线指标,根据波段按颜色标识上行和下行,可开启或关闭弹框提示当前应该挂买或卖单。 参数列表描述: extern int Price = 0;                     //指标初始计算均价 extern int Length = 20;                //指标计算平均周期,相当于MA的平均周期。 extern int Displace = 0; extern int Filter = 0;                    //过滤柱数 extern int Color = 1;                    //上行颜色 extern int ColorBarBack = 0;       //下行颜色 extern double Deviation = 0.0;   //偏离 extern int BarsToDraw=2000;      //计算柱子数 extern bool AlertsOn=true;         //开启或关闭弹框提示 extern int RemindFrequency=60; //
FREE
MTF Heiken Ashi MA is a multiple timeframe Heiken Ashi & Moving Average indicator. Fully customizable for advanced & unique Heiken Ashi & Moving Average calculations. Key Features Modified appearance and appeal from the traditional using only H eiken Ashi MA bodies. MTF Higher or lower timeframes available making this it great for trends and scalping. There are many settings that can be non-repaint for signals at a new bar and at bar 0. Inputs Timeframe  = PERIOD_CURRENT - timeframe of Moving
FREE
Dynamic MA Trend Zone – Dynamic Moving Average Trend Zone The Dynamic MA Trend Zone is a visually compelling indicator that dynamically tracks changes in market trends. By displaying moving averages on three different price levels (close, high, and low), it creates a color-coded trend zone that clearly indicates the trend’s direction and strength. Features and Functions: - Trend Direction Color Coding: The indicator automatically color-codes the trend zones based on whether the candle’s clos
FREE
AO Signal Candle
Jonathan Destailleur
The  Awesome Oscillator  (AO)  Signal Candle Indicator  is an indicator used to measure market momentum.  Awesome Oscillator  (AO)  Signal Candle Indicator  will change bar's color when set overbought or oversold levels reach. Colored Candles, based on Awesome Oscillator (AO) Signal. -If the indicator is above zero, the market is bullish. -If the indicator is below zero, the market is bearish. -If the market is bullish, you can take a stand with green candle signals. -If the market is bearish,
FREE
Free automatic fibonacci
Tonny Obare
4.67 (49)
Free automatic Fibonacci is an indicator that automatically plots a Fibonacci retracement based on the number of bars you select on the BarsToScan setting in the indicator. The Fibonacci is automatically updated in real time as new highest and lowest values appears amongst the selected bars. You can select which level values to be displayed in the indicator settings. You can also select the color of the levels thus enabling the trader to be able to attach the indicator several times with differe
FREE
MTF Stochastic and RSI
Georgiy Gazaryan
5 (2)
A simple but effective helper that will allow you to track both global and local market trends. The indicator combines the work of two oscillators: Stochastic and RSI. Both indicators can be set to any timeframe. Advantages of Use Multitimeframe - you can adjust both indicators to the desired timeframes. To obtain the entry points, you can use the Elder's triple screen system. Highly customizable - you can configure not only the parameters of the indicators, but also their appearance (color and
FREE
TSO Moving Average Slope
Dionisis Nikolopoulos
3.67 (3)
The Moving Average Slope (MAS) subtracts the moving average level n-periods ago from the current moving average level. This way, the trend of the moving average can be drawn on the moving average line. Features Observe uptrends and downtrends at a glance. The indicator is non-repainting. Returns buffer values for the trend of the moving average to be used as part of an EA. (see below) Inputs Moving Average Period : The period of the moving average (MA). Slope Period : Number of periods between
FREE
Powered by SVX Strategies Quant Team This indicator is part of our internal toolkit for institutional volatility analysis. We are releasing it for free to support the retail trading community. Looking for Automated Results? Manual execution is prone to human error. If you prefer consistent results managed by our team, you can copy our official algorithms directly on MQL5: Copy "Friday Pulse" (Conservative/Stable) Copy "SVX AI Systems" (High Growth) ABOUT ADAPTIVE RSI BANDS Unlike traditional R
FREE
Wise Men Indicator demo
Bohdan Kasyanenko
3 (2)
The indicator displays signals according to the strategy of Bill Williams on the chart. Demo version of the indicator has the same features as the paid, except that it can work only on a demo account . Signal "First Wise Man" is formed when there is a divergent bar with angulation.  Bullish divergent bar - with lower minimum and closing price in the upper half. Bearish divergent bar - higher maximum and the closing price at the bottom half. Angulation is formed when all three lines of Alligator
FREE
This indicator is a perfect tool able to compare which brokers have the lower latency. It shows us immediately which brokers are slower or faster. When you see the dot icon on the line, it means this broker is the faster one and the red line (Broker_A) is the slower one. See the example on the screenshot. How It Works? This indicator shares the prices information to and from the "shared" common data folder. It compares all the prices. The price is based on average by (Ask + Bid) / 2. There are
FREE
Price Force Analyzer
Joel Protusada
1 (1)
P R I C E   F O R C E   A N A L Y Z E R    This is a complex indicator that calculates the force of the price direction.           V E R Y  I M P O R T A N T     This is not a stand alone indicator. Use it together with your own strategy. This indicator only confirms your possible position. You can run it in any charts and timeframes but H1 is recommended. Make sure that the pair is volatile at the time of trading. If you don't have a solid volatility-based strategy yet, y
FREE
该产品的买家也购买
Gann Made Easy
Oleg Rodin
4.83 (160)
Gann Made Easy 是一个专业且易于使用的外汇交易系统,它基于使用先生理论的最佳交易原则。 W.D.江恩。该指标提供准确的买入和卖出信号,包括止损和获利水平。您甚至可以使用推送通知在旅途中进行交易。 购买后请联系我,即可免费获得交易指导和超棒的额外指标! 您可能已经多次听说过江恩交易方法。通常 Gann 的理论不仅对于新手交易者而且对于那些已经有一定交易经验的人来说都是非常复杂的东西。这是因为江恩的交易方法在理论上并不那么容易应用。我花了几年时间来完善这些知识,并将最好的原则应用到我的外汇指标中。 该指标非常易于应用。您所需要的只是将其附加到您的图表并遵循简单的交易建议。该指标不断进行市场分析工作并寻找交易机会。当它检测到一个好的入口点时,它会为您提供一个箭头信号。该指标还显示止损和获利水平。 换句话说,当您像先生一样进行交易时,该指标会为您提供最佳江恩建议。江恩亲自告诉你此时此刻该做什么。但最好的部分是您不需要了解任何有关江恩交易原则的知识,因为该指标会为您完成整个市场分析工作。
M1 Sniper
Oleg Rodin
5 (21)
M1 SNIPER 是一款易于使用的交易指标系统。它是一个专为 M1 时间框架设计的箭头指标。该指标可以作为独立的系统在 M1 时间框架下进行剥头皮交易,也可以作为您现有交易系统的一部分使用。虽然该交易系统专为 M1 时间框架交易而设计,但它也可以用于其他时间框架。我最初设计此方法是为了交易 XAUUSD 和 BTCUSD。但我发现这种方法在其他市场交易中也同样有用。 指标信号既可以顺势交易,也可以逆势交易。我教授一种特殊的交易技巧,帮助您利用指标信号进行双向交易。该方法基于使用特殊的动态支撑位和阻力位区域。 购买后,您可以立即下载 M1 SNIPER 箭头指标。此外,我还为所有 M1 SNIPER 工具用户免费提供下方屏幕截图所示的 Apollo Dynamic SR 指标!这两个指标的组合可以帮助您更轻松、更准确地利用 M1 时间框架进行交易。 购买后请联系我,免费获取交易提示和奖励指标! 祝您交易成功!
Scalper Inside PRO
Alexey Minkov
4.74 (69)
12% OFF EASTER SALE An exclusive indicator that utilizes an innovative algorithm to swiftly and accurately determine the market trend. The indicator automatically calculates opening, closing, and profit levels, providing detailed trading statistics. With these features, you can choose the most appropriate trading instrument for the current market conditions. Additionally, you can easily integrate your own arrow indicators into Scalper Inside Pro to quickly evaluate their statistics and profitabi
Ultimate Sniper Dashboard
Hispraise Chinedum Abraham
4.82 (22)
折扣价为299美元! 未来可能会涨价! 请阅读下面的描述! 终极狙击手仪表盘的最佳进入系统。终极动态水平。(请查看我的产品) 由于MT4多币种测试的限制,终极狙击手仪表盘只适用于实时市场。 介绍Ultimate-Sniper Dashboard! 我们最好的产品包括HA-狙击手、MA-狙击手和许多特殊模式。终极狙击手仪表盘是一个绝对的野兽! 对于任何新手或专家交易者来说,这是最好的解决方案! 永远不要再错过任何一个动作! 对于那些喜欢简单和点数的交易者,我们有一个特别的产品给你。本质上很简单,该仪表板根据多种自定义算法查看28种货币对,完成所有工作。只需一张图表,你就可以像专家一样阅读市场。试想一下,如果你能在任何外汇对开始移动时准确地确定其方向,你的交易会有多大的改善。   我们的系统是为了寻找高概率信号并实时向用户发送警报。没有滞后或错误的信号。 为了保持图表的清洁,你可以在不需要时隐藏Ultimate-Sniper。只需按下箭头按钮即可隐藏仪表板。 Ultimate-Sniper适用于从1分钟到月度的所有时间框架,因此你可以在你选择的任何时间框架上快速发现趋势。 高概率信号
Market Makers
Mohamed Hassan
5 (3)
After purchase, contact me privately to receive 1 month of free testing with EA Forex Proton! This advanced MT4 trading robot automatically executes signals from any MT4 indicator, including Market Makers. The latest version also includes AI integration, allowing each trade signal to be analyzed using Artificial Intelligence. Live Signal with EA Forex Proton: Click here Market Makers is a powerful price action trading system designed to identify high-probability Buy and Sell opportunities based
Trend Screener
STE S.S.COMPANY
4.79 (95)
趋势指标,趋势交易和过滤的突破性独特解决方案,所有重要趋势功能都内置在一个工具中! 它是 100% 非重绘多时间框架和多货币指标,可用于所有符号/工具:外汇、商品、加密货币、指数、股票。 限时优惠:支撑和阻力筛选指标仅售 50美元,终身有效。(原价 250 美元)(优惠延长) 趋势筛选器是有效的指标趋势跟踪指标,它在图表中提供带有点的箭头趋势信号。 趋势分析器指标中可用的功能: 1.趋势扫描仪。 2. 具有最大利润分析的趋势线。 3.趋势货币强度计。 4. 带有警报的趋势反转点。 5. 带有警报的强趋势点。 6. 趋势箭头 每日分析示例,每日信号表现...等与我们的趋势筛选指标,可以在这里找到: 点击这里 限时优惠:Trend Screener Indicator 仅售 50 美元且终身可用。原价 125$) 通过访问我们的 MQL5 博客,您可以找到我们所有的高级指标以及分析示例、每日信号表现...等。 : 点击这里 我们的趋势系统由 2 个指标组成: 1. Trend Screener Indicator:显示趋势仪表盘、图表中的趋势线、入场点...等。 2. Trend
Atomic Analyst
Issam Kassas
5 (5)
首先值得强调的是,该交易指标是非重绘、非延迟的指标,这使其成为手动和机器人交易的理想选择。 用户手册:设置、输入和策略。 Atomic Analyst是一种PA价格行动指标,利用价格的力量和动量来寻找市场上更好的机会。配备了高级过滤器,可帮助去除噪音和假信号,并提高交易潜力。使用多层复杂的指标,Atomic Analyst扫描图表,并将复杂的数学计算转化为任何初学者都能理解并用来做出一致交易决策的简单信号和颜色。 “Atomic Analyst”是专为新手和经验丰富的交易者量身定制的综合交易解决方案。它将高级指标和一流功能融合为一体的交易策略,使其成为所有类型交易者的多功能选择。 日内交易和剥头皮策略:专为快速准确的日内交易和短期交易而设计。 日内和摆动交易策略:可用作追求价格大幅波动的日内和摆动交易者的可靠工具。 多货币和市场:凭借其可靠的精度,在不同的工具和市场上运作。 多个时间框架:可在多个时间框架上使用,性能良好。 稳定性:所有指标均不重绘、不重绘和不滞后,确保可靠的信号。 信号清晰度:提供箭头信号,用于清晰的入场和出场点。 实时警报:通过交易入场、SL和TP警报通知交易者
Super Signal – Skyblade Edition 專業級無重繪 / 無延遲趨勢信號系統,擁有卓越勝率 | 適用於 MT4 / MT5 在較低的時間週期上效果最佳,例如 1 分鐘、5 分鐘與 15 分鐘圖表。 核心特色: Super Signal – Skyblade Edition 是一套專為趨勢交易設計的智能信號系統。 其採用多重濾波邏輯,僅篩選出具有明確方向性、動能強勁且波動結構健康的走勢進場點。 本系統 不預測高點或低點 ,只有在同時滿足以下三項條件時才會觸發交易信號: 趨勢方向明確 動能持續增強 波動率結構穩定 此外,系統還結合市場流動性分析,以進一步提升信號的準確性與觸發時機。 信號特性: 所有箭頭信號皆為 100% 無重繪,無延遲 信號一旦出現即固定於圖表,不會閃爍或消失 提供圖表箭頭、資訊面板、彈出通知、聲音提示及推播訊息 支援 EA 呼叫(Buffer 輸出),可整合至自動化交易或信號跟單系統 提供預設參數模板,免調整即可使用,適合新手快速上手 總結: Super Signal – Skyblade Edition 是一款邏輯清晰、穩定高效的專業趨勢型
Trend indicator AI
Ramil Minniakhmetov
4.53 (83)
趋势人工智能指标是一个伟大的工具,将加强交易者的市场分析结合趋势识别与可操作的进入点和逆转警报。 该指标使用户能够自信和精确地驾驭外汇市场的复杂性 除了主要信号,趋势Ai指标识别在回调或回调期间出现的次要入口点,使交易者能够利用既定趋势内的价格修正。 重要优势: *MT4及MT5工程 *明确买入或卖出信号 ·不重绘 *适用于所有资产 小心我不卖EA或设置电报它骗局. 所有设置免费在这里的博客。  重要! 购买后立即与我联系,以获得指示和奖金! 真实的操作监控以及我的其他产品可以在这里找到: https://www.mql5.com/en/users/mechanic/seller&nbsp ; 设置和输入: 建议为所有资源设置默认设置。 第...
介绍 ON Trade Waves Patterns Harmonic Elliot Wolfe,这是一款高级指标,旨在使用手动和自动方法检测各种市场模式。以下是它的工作原理: 谐波模式: 该指标可以识别出现在您图表上的谐波模式。这些模式对于练习谐波交易理论的交易者非常重要,正如Scott Carney的书《谐波交易第1卷和第2卷》所描述的那样。无论您是手动绘制它们还是依赖自动检测,ON Trade Waves Patterns都可以胜任。 控制面板: 我们配备了一个用户友好的控制面板,它会保存您的图表和时间帧设置,使您可以轻松切换不同配置。您甚至可以最小化它以最大化图表空间。如果您更喜欢使用其他分析工具,只需单击关闭按钮即可隐藏所有指标数据。 模板保存: 当您自定义设置或添加其他指标,如移动平均线或布林带时,该指标会自动保存您的模板。这意味着您可以随时轻松加载您喜欢的设置。 优化显示: 对于Windows 10用户,我们建议调整您的DPI设置以获得高清设备上的最佳屏幕体验。右键单击MetaTrader图标,选择“兼容性”,然后选择“更改高DPI设置”,将其设置为“系统(增强)”。
Dynamic Scalper System
Vitalyi Belyh
5 (1)
“ Dynamic Scalper System ”指标专为在趋势波内进行剥头皮交易而设计。 已在主要货币对和黄金上进行测试,并可与其他交易工具兼容。 提供顺势短线建仓信号,并提供额外的价格变动支持。 指标原理: 大箭头决定趋势方向。 在趋势波内,我们采用一种生成小箭头形式的剥头皮交易信号的算法。 红色箭头代表看涨方向,蓝色箭头代表看跌方向。 敏感的价格变动线会沿着趋势方向绘制,并与小箭头信号协同作用。 信号运作方式如下:当线在适当时刻出现时,将形成入场信号;在出现线时,持仓;线完成后,平仓。 建议的操作时间范围为M1 - H4。 箭头在当前K线上方形成,如果下一根K线已开仓,则不会重新绘制上一根K线上方的箭头。 输入参数 Trend Wave Period - 趋势方向(大箭头)的周期,改变趋势波的时间间隔。值 1 表示趋势方向的最长持续时间,参数值越大,持续时间越短。 Scalper Arrows Period - 信号箭头(小箭头)的计算周期,改变入场信号的生成频率。值 3 表示最频繁的生成频率,参数值越大,箭头频率越低,准确度越高。 这些参数可以根据不同的时间范
PRO Renko System
Oleg Rodin
5 (30)
PRO Renko Arrow Based System for trading renko charts.  准确的信号交易任何外汇工具. 另外,我将免费提供系统的附加模块! PRO Renko系统是RENKO图表上高度准确的交易系统。该系统是通用的。 该交易系统可应用于各种交易工具。 该系统有效地中和了所谓的市场噪音,打开了获得准确反转信号的通道。 该指标易于使用,只有一个参数负责产生信号。 您可以很容易地使算法适应您感兴趣的交易工具和renko酒吧的大小。 我很乐意通过提供任何咨询支持来帮助所有客户有效地使用该指标。 祝您交易成功!购买后,立即写信给我! 我将与您分享我的建议和我的renko发电机。 另外,我将免费提供系统的附加模块!
TPSpro RFI Levels
Roman Podpora
4.86 (28)
俄语说明 /  英文 说明   -  MT5 版本 主要功能: 显示卖家和买家的活跃区域! 该指标显示所有正确的买入和卖出的初始脉冲水平/区域。当这些水平/区域被激活时,即开始寻找入场点的位置,水平线会改变颜色,并填充特定颜色。此外,还会显示箭头,以便更直观地了解情况。 LOGIC AI - 激活模板时显示用于搜索入口点的区域(圆圈) 为了提高视觉清晰度,添加了使用人工智能搜索入口点的显示区域的功能。 显示更高时间范围内的级别/区域(MTF 模式) 新增使用更高时间间隔显示级别/区域的功能。此外,该指标还具有自动趋势检测功能 (   TPSproTREND PRO   )。 独立的专业分步交易算法 该算法专为顺势和逆势的日内交易而设计。每个活动模板均提供详细的说明。 适用于不同的时间范围 TPSpro RFI 水平指标可用于图表上的任何时间间隔,从分钟(M1)到每月(MN)。 图形和声音警报 该指标提供图形和声音提示,让您不会错过交易信号。 此外,还支持手机通知。 简单有效的活性模板扫描器 这是一个非常紧凑的主动模式扫描仪,当在一个方向上的所有时间间隔内激活模式时,它会自动发出警报并
BTMM State Engine Pro MT4
Garry James Goodchild
BTMM State Engine Pro is a MetaTrader 4 indicator for traders who use the Beat The Market Maker approach: Asian session context, kill zone timing, level progression, peak formation detection, and a multi-pair scanner from a single chart. It combines cycle state logic with a built-in scanner dashboard so you do not need the same tool on many charts at once. What it does Draws the Asian session range; session times can follow broker server offset or be set in inputs. Tracks level progression (L
Linear Trend Predictor — 结合切入点和方向支撑线的趋势指标。按照突破高/低价通道的原理运作。该指标算法过滤市场噪音,考虑波动性和市场动态。 指示器功能  使用平滑方法,显示市场趋势和开立买入或卖出订单的切入点。  适合通过分析任何时间范围内的图表来确定短期和长期的市场走势。  输入参数可适应任何市场和时间范围,允许交易者独立定制指标。  设定的指示信号不会消失,也不会重新绘制——它是在蜡烛收盘时确定的。  几种类型的通知以箭头组合。  该指标既可以作为独立的交易系统使用,也可以作为其他交易系统的补充。  可供任何经验水平的交易者使用。 主要参数 Volatility Smoothing Level - 指标的主要参数,允许您配置指标以实现舒适的操作。 它的数字范围是 1 到 100,从而增加了您可以获得更长趋势运动的平滑度。 通过少量的数字,您可以获得短期走势并快速退出交易。 使用指标进行交易的时刻:  红线和箭头表示下降趋势和卖出开盘信号。止损应根据前一个上分形来设置。  黄线和箭头表示上升趋势和买入开盘信号。止损应根据前一个下分形来设置。
Advanced Currency Strength28 Indicator
Bernhard Schweigert
4.91 (657)
目前40%的折扣 任何新手或专家交易者的最佳解决方案! 这个指标是一个独特的、高质量的、可负担得起的交易工具,因为我们纳入了一些专有的功能和一个新的公式。只需一个图表,你就可以读出28个外汇对的货币强度!想象一下,你的交易将如何得到改善,因为你的交易是在你的手中进行的。想象一下,你的交易将如何改善,因为你能够准确地确定新趋势或剥头皮机会的触发点? 用户手册:点击这里  https://www.mql5.com/en/blogs/post/697384 这是第一本,原版的! 不要买一个毫无价值的崇拜者的克隆品。 特别的 子窗口中的箭头显示强劲的货币势头GAP将指导你的交易! 当基础货币或报价货币处于超卖/超买区域(外盘斐波那契水平)时,在个人图表的主窗口中出现警告信号。 当货币力量从外围区间回落时,回撤/反转警报。 十字星模式的特别警报 可选择多个时间框架,以快速查看趋势! 货币强度线在所有的时间框架中都非常平稳,当使用较高的时间框架来识别总体趋势,然后使用较短的时间框架来确定精确的入口时,效果非常好。你可以根据自己的意愿选择任何时间框架。每个时间框架都由其自身进行了优化。
Easy Breakout
Mohamed Hassan
4.71 (14)
After your purchase, feel free to contact me for more details on how to receive a bonus indicator called VFI, which pairs perfectly with Easy Breakout for enhanced confluence!    Easy Breakout is a powerful price action trading system built on one of the most popular and widely trusted strategies among traders: the Breakout strategy ! This indicator delivers crystal-clear Buy and Sell signals based on breakouts from key support and resistance zones. Unlike typical breakout indicators, it levera
Volatility Trend System - a trading system that gives signals for entries. The volatility system gives linear and point signals in the direction of the trend, as well as signals to exit it, without redrawing and delays. The trend indicator monitors the direction of the medium-term trend, shows the direction and its change. The signal indicator is based on changes in volatility and shows market entries. The indicator is equipped with several types of alerts. Can be applied to various trading ins
Trend Lines PRO
Roman Podpora
5 (1)
TREND LINES PRO 帮助您了解市场真正的方向转变点。该指标显示真实的趋势反转点以及主要参与者重新入场的时机。 您可以看到 BOS线、 趋势变化和更高时间框架的关键水平——无需复杂的设置或不必要的干扰。信号不会重绘,并在K线收盘后仍然保留在图表上。 VERSION MT 5    -   与……搭配使用时,可发挥其最大潜力   RFI LEVELS PRO 指示器 该指标显示的内容: 实际变化 趋势(BOS 线) 一旦信号出现,它就始终有效!这与会重绘的指标有着重要的区别,后者可能会发出信号后又改变信号,从而导致资金损失。现在,您可以更精准、更准确地进入市场。此外,还有一个功能,会在箭头出现后为K线着色,直到达到目标价位(止盈)或出现反转信号为止。 重复条目   以及主要玩家的充值 为了提高寻找入场点时的视觉清晰度,我们创建了一个模块,该模块首先显示买入/卖出区域,并在该区域内寻找最佳入场点。此外,我们还加入了智能逻辑来管理止损位,该逻辑会随着时间的推移逐步降低止损位的大小,从而降低入场交易时的初始风险(移动止损位)。 信号强度水平(BOS) 该指标采用三个显著性等级来衡量
GOLD Impulse with Alert
Bernhard Schweigert
4.67 (12)
这个指标是我们2个产品 Advanced Currency IMPULSE with ALERT  +   Currency Strength Exotics 的一个超级组合。 它适用于所有时间框架,并以图形方式显示8种主要货币和一种符号的强势或弱势冲动! 该指标专门用于显示任何符号的货币强度加速,如黄金、异国货币对、商品、指数或期货。这是它的第一个指标,任何符号都可以被添加到第9行,以显示黄金、白银、石油、DAX、US30、MXN、TRY、CNH等的真实货币强度加速(冲动或速度)。 建立在新的基础算法上,它使识别和确认潜在的交易更加容易。这是因为它以图形方式显示了一种货币的强势或弱势是否正在加速,并测量了这种加速的速度--把它想象成你汽车中的速度表。当你加速时,事情显然会发生得更快,这在外汇市场上也是一样的,即如果你配对的货币正在向相反的方向加速,你就会发现一个潜在的有利可图的交易。 动态市场斐波那契28水平被用作警报触发器,将适应市场活动。如果冲动击中黄色触发线,你将收到警报。然后你就知道作为一个交易员应该做什么。货币对和方向已经给出。只需点击警报按钮,就可以切换到该货
Order Block Hunter
Noha Mohamed Fathy Younes Badr
5 (10)
Order block hunter indicator is the best indicator for  hunt the order blocks that area where there has been a large concentration of limit orders waiting to be executed Order blocks are identified on a chart by observing previous price action and looking for areas where the price experienced significant movement or sudden changes in direction .This indicator does that for you by using very complicated codes and helps you to take the best areas To buy and sell because it make marks at the best a
- Real price is 80$ - 40% Discount (It is 49$ now) Contact me for instruction, add group and any questions! - Non-repaint - I just sell my products in Elif Kaya profile, any other websites are stolen old versions, So no any new updates or support. - Lifetime update free Related product:   Bitcoin Expert Introduction The breakout and retest strategy is traded support and resistance levels. it involves price breaking through a previous level.  The break and retest strategy is designed to help tr
KT Gaussian Trend Filter MT4
KEENBASE SOFTWARE SOLUTIONS
KT Gaussian Trend Filter 结合高斯滤波与线性回归平滑处理,为交易者提供清晰且准确的趋势分析。它生成直观的买入和卖出信号,同时有效地突出市场的长期方向。 功能特点 可自定义的高斯滤波器: 可调节周期和极点设置,优化平滑效果并提升趋势可读性。 线性回归增强: 进一步细化高斯平滑效果,减少市场波动带来的假信号。 多周期扫描仪: 自动检测多个周期的高斯趋势方向,并在面板中清晰显示。 回撤带功能: 便于在趋势回调阶段识别有效的进场机会。 可自定义颜色设置: 可根据图表风格和个人偏好轻松调整指标配色。 内置提醒功能: 支持弹窗、邮件、推送和声音提醒,实时通知信号变化。 使用方法 该指标提供直观的信号,帮助交易者判断何时进场与出场。一个实用的方法是在回调结束后寻找趋势延续信号。过滤器能有效判断回调是否结束,以及主趋势是否重新启动。 多周期分析: 在不同周期上应用此指标,可更全面地评估趋势一致性并优化入场时机。 控制平滑强度: 过度平滑可能掩盖重要价格变化。建议适度调整设置,以平衡趋势清晰度与灵敏度。 参数设置 Gaussian Period – 定义高斯滤波器的周期长度
Special offer : ALL TOOLS , just $35 each! New tools   will be   $30   for the   first week   or the   first 3 purchases !  Trading Tools Channel on MQL5 : Join my MQL5 channel to update the latest news from me 多时间框架的体积订单块 指标是一个为寻求通过识别重要市场参与者积累订单的关键价格区域来深入洞察市场行为的交易者设计的强大工具。这些区域称为体积订单块,可以作为潜在的支撑和阻力区,为明智的交易决策提供重要的优势。 查看MT5版本:  Volumetric Order Blocks MT5 Multi Timeframe See more products at:   https://www.mql5.com/en/users/ndhsfy/seller 核心功能 1. 自动检测体积订单块 该指标标注了积累买入或卖出订单的重要价格水平,提供两种不同类型: 看涨体积订单块
Advanced Supply Demand
Bernhard Schweigert
4.91 (299)
现在优惠 40%! 任何新手或专业交易者的最佳解决方案! 该指标是一款独特、高质量、且价格合理的交易工具,因为我们已经整合了许多专有功能和新公式。 依据此更新,您将能够显示双重时间帧区域。 您不仅可以显示一个较高的时间帧,还可以同时显示图表时间帧,加上更高的时间帧:显示嵌套时区。 供需双方所有交易者都会喜欢它。 :) 重要信息披露 高级供需的最大潜力,请访问 https://www.mql5.com/zh/blogs/post/720245   想象您的交易如何得以改善,是因为您能够精准定位入场或目标位吗? 构建于新的底层算法,它可以更轻松地识别出买卖双方之间的潜在失衡。 这是因为它以图形方式展示供需最强劲区域,及其过去的表现(显示旧区域)。 这些功能旨在帮助您更轻松地发现最佳入场区域和价位。 现在您可以针对您的交易品种和时间帧来优化和编辑区域强度! 高级供需指标适用于所有产品和时间帧。 它是一个新的公式,非常新的功能是两个区域强度函数可由用户输入进行调整! 这在交易中是一大优势。 当您学习如何使用专有功能,例如带有价格游离最小 X 因子的区域强度时,您能够判断该区域强劲与否。 供需
Route Lines Prices -  是一款用于寻找价格方向的指标。其简洁的界面包含多种价格行为和未来方向计算算法。这些算法包括基于所用时间周期的波动率计算和价格平滑。 该指标只有一个参数,用于更改“ Calculating price values ”。默认值 1 提供均衡的自动计算, 无需手动配置即可使用。 通过手动更改 2 到 500 之间的值,您可以根据自己的交易系统自定义指标。 建议在 M1 到 H4 的时间周期内使用此指标。适用于任何交易品种。 信号箭头在蜡烛图收盘时生成;不会重绘历史数据。 主图表上提供重复箭头。 提供多种类型的警报。内置的线轨迹计数器基于收盘价工作。这意味着,当出现相反信号时,会确定价格轨迹的数值,并在信号结束后的下一根蜡烛图上显示这些数值。 总计数器将获得的值相加,以便在相应的图表上方便地调整参数。
Stratos Pali
Michela Russo
4.43 (7)
Stratos Pali Indicator   is a revolutionary tool designed to enhance your trading strategy by accurately identifying market trends. This sophisticated indicator uses a unique algorithm to generate a complete histogram, which records when the trend is Long or Short. When a trend reversal occurs, an arrow appears, indicating the new direction of the trend. Important Information Revealed Leave a review and contact me via mql5 message to receive My Top 5 set files for Stratos Pali at no cost! Dow
目前八折优惠! 对任何新手或专家交易者来说都是最好的解决方案! 这个仪表板软件适用于28种货币对。它基于我们的两个主要指标(高级货币强度28和高级货币冲动)。它对整个外汇市场提供了一个伟大的概述。它显示高级货币强度值,货币运动速度和28个外汇对在所有(9)时间段的信号。想象一下,当你可以使用图表上的单一指标观察整个市场,以确定趋势和或剥头皮的机会时,你的交易将得到改善 我们已经在这个指标中建立了一些功能,使你更容易识别强势和弱势货币,同时识别和确认潜在的交易。该指标以图形方式显示货币的强势或弱势是增加还是减少,以及它在所有时间段的表现。 增加的新功能是动态市场斐波那契水平,它适应当前的市场条件变化,这是一个已经在我们的高级货币强度28和高级货币冲动指标中使用的成熟的加分项。 在交易时,总是将弱势货币和强势货币配对,这个新指标将帮助你做到这一点。 用户手册:点击这里  https://www.mql5.com/en/blogs/post/708783 特点  显示每个时间段的ACS28和GAP-speed(冲动)的货币强度值。 列:颜色代码以7种颜色显示货币强度:强势
这是一个预测蜡烛收盘价的指标。 该指标主要用于 D1 图表。 该指标适用于传统外汇交易和二元期权交易。 该指标可以用作独立的交易系统,也可以作为您现有交易系统的补充。 该指标分析当前蜡烛,计算蜡烛本身内部的某些强度因素,以及前一根蜡烛的参数。 因此,该指标预测市场走势的进一步方向和当前蜡烛的收盘价。 由于这种方法,该指标既适用于短期盘中交易,也适用于中长期交易。 该指标允许您设置指标在分析市场情况期间将产生的潜在信号的数量。 在指标设置中有一个特殊的参数。 此外,该指标可以通过图表上的消息、电子邮件以及推送通知的形式通知新信号。感谢您的关注!交易愉快! 购买后一定要写信给我! 我会给你我的交易指标的建议! 还可以获得奖金!
Volumatic Fair Value Gaps
Suvashish Halder
5 (2)
Volumatic Fair Value Gaps   is a precision-engineered indicator for identifying, analyzing, and visualizing   Fair Value Gaps (FVGs)   backed by volume intelligence. This tool goes beyond standard FVG plotting by dissecting volume dynamics inside each gap using   lower-timeframe sampling , offering clear insight into whether bulls or bears dominate the imbalance. Designed for technical traders, this indicator overlays high-probability gaps only, visualizes   bullish vs. bearish volume compositio
作者的更多信息
RaysFX (Average Directional Movement Index) to → ARROW Technical indicator (ADX) helps to determine the market trend. It was developed and described in detail by Welles Wilder. The simplest trading method based on the system of directional movement implies comparison of two direction indicators: the 14-period +DI one and the 14-period -DI. To do this, one either puts the charts of indicators one on top of the other, or +DI is subtracted from -DI. W. Wilder recommends buying whenever the +DI cro
RaysFX Stochastic
Davide Rappa
5 (1)
RaysFX Stochastic  L'indicatore RaysFX Stochastic è un indicatore personalizzato per la piattaforma MetaTrader 4. Caratteristiche principali: -Indicatori separati: L'indicatore viene visualizzato in una finestra separata sotto il grafico principale. -Livelli dell'indicatore: L'indicatore ha due livelli predefiniti, 20 e 80, che possono essere utilizzati come livelli di ipervenduto e ipercomprato. -Buffer dell'indicatore: L'indicatore utilizza quattro buffer per calcolare e memorizzare i suoi
FREE
RaysFX Supertrend Line
Davide Rappa
5 (2)
RaysFX Supertrend + Alert RaysFX Supertrend è un indicatore di tendenza superiore progettato per i trader che desiderano avere un vantaggio nel mercato. Questo indicatore utilizza una combinazione di CCI (Commodity Channel Index) e ATR (Average True Range) per identificare le tendenze del mercato e fornire segnali di trading accurati. Caratteristiche principali Indicatori CCI e ATR: Utilizza due degli indicatori più popolari e affidabili per identificare le tendenze del mercato e generare segnal
FREE
RaysFX StochRSI Presentiamo un indicatore MQL4 sviluppato da RaysFX, un rinomato sviluppatore nel campo del trading algoritmico. Questo indicatore è una combinazione semplice ma potente di due indicatori popolari: RSI e Stocastico. Caratteristiche principali: RSI : Un indicatore di momentum che misura la velocità e il cambiamento dei movimenti dei prezzi. Stocastico : Un indicatore di momentum che confronta il prezzo di chiusura di un titolo con la gamma dei suoi prezzi durante un certo periodo
FREE
RaysFX CCI e RSI
Davide Rappa
3 (2)
Il nostro Indicatore Combinato RaysFX CCI-RSI è uno strumento unico che combina due dei più popolari indicatori di analisi tecnica: l’Indice di Forza Relativa (RSI) e l’Indice del Canale delle Materie Prime (CCI). Caratteristiche : Combinazione di CCI e RSI : L’indicatore calcola la differenza tra i valori di CCI e RSI per ogni barra del grafico. Media Mobile Semplice (SMA) : L’indicatore calcola una SMA su queste differenze e traccia due linee sul grafico. Segnali di trading : Ogni volta che qu
FREE
RaysFX StepMA+Stoch  Caratteristiche Principali Adattabilità: Il nostro indicatore RaysFX StepMA+Stoch è progettato per adattarsi alle mutevoli condizioni di mercato. Utilizza l’Average True Range (ATR) per misurare la volatilità del mercato e regolare di conseguenza le sue strategie di trading. Precisione: L’indicatore genera segnali di trading quando la linea minima incrocia la linea media. Questi segnali sono rappresentati come frecce sul grafico, fornendo punti di ingresso e di uscita chiari
FREE
RaysFX Strategy è un sofisticato strumento di trading che genera segnali di ACQUISTO e VENDITA basati su una combinazione di quattro indicatori tecnici: 3 SMA (Simple Moving Average), 1 StochasticRSI , 1 Choppy, e 1 DeMarker. Only M1 TimeFrame! **Segnale di VENDITA** Quando la candela precedente è sotto i 3 SMA, sopra il livello 80 dello Stochastic, sotto il livello 38 del Choppy e sopra il livello 0.3 del DeMarker, l'indicatore genera un segnale di VENDITA, rappresentato da una freccia rossa.
Questa utility di base non agisce in automatico, ma supporterà il trader, ti aiuterà nella gestione dei lotti tramite: possibilità di impostare la size possibilità di   impostare TP e SL (in pip) Consiglio: Questo EA ti aiuterà nella gestione dei tuoi ordini ed è  ottimo abbinarlo a delgi indicatori (trovate nel nostro store molti indicatori utili, fra cui il RaysFX Strategy )
Questo indicatore fractal ti invierà un messaggio telefonico (tramite app mt4) non è necessaria la configurazione dell'indicatore, basta impostare l'ID del tuo smartphone e potrai ricevere il messaggio BUY o SELL in tempo reale (affidabilità 80%) per qualsiasi domanda o dubbio non esitate a contattarmi su mql5.com o telegram (link al gruppo disponibile in bio)
What Is MT4 Candlestick Pattern Indicator Candlestick patterns are groups of candlestick that have a meaning for the trader. These groups are usually composed of two, three, four, or five candles and indicate some form of price action happening. In many cases traders use these patterns to decide what to do next. Candlestick Pattern Indicator for MT4 is a plugin that allows you to see the most common candlestick patterns on your chart. The indicator scans the chart and detects popular patterns, m
Tra le tecniche alternative di trading più utilizzate dagli investitori, uno spazio interessante va dato alla   strategia Ichimoku cloud   che si basasulle nuvole (kumo). Queste ultime sono il vero fulcro del sistema di trading Hichimoku Kinko Hyo. Molti erroneamente pensano che l’Ichimoku Kinko Hyo sia un semplice indicatore trend following, mentre invece è un vero e proprio   sistema di trading completo . Infatti   grazie a UN SOLO grafico (sia pure molto complesso) ci dà una visione completa
Questo indicatore è studiato per analizzare: Lo Stochastic Oscillators , la Moving Averages , il MACD , il crossover MA , e per finire i Parabolic SAR. Il tutto viene racchiuso in un grafico che indicherà con frecce e spettri il momento ideale per aprire un trade. "La precisione dei segnali dipende sempre dai valori impostati, con i valori stock si ha un ottima affidabilità "
Trade Assistant MetaTrader indicator  — a multi-timeframe indicator that is based on three standard indicators:   Stochastic oscillator ,   RSI   (Relative Strength Index), and   CCI   (Commodity Channel Index). It displays current trend directions for M1, M5, M15, M30, H1, H4, D1, W1, and MN1 timeframes. When you follow such an indicator you have a clear picture of the trends across all important timeframes. It doesn't matter which timeframe you attach this indicator to. The indicator can be d
Delfino V6
Davide Rappa
Nuova versione disponibile direttamente sul sito:  https://delfino-7-2-4j3krvd.gamma.site/ NON COMPRATE QUESTA VERSIONE, MA SOLO QUELLA SUL SITO QUI SOPRA ↑↑↑↑ Delfino 7.2 – Il Nuovo Standard del Trading Automatico su MT4! Dopo mesi di sviluppo, ottimizzazione e test intensivi, Delfino 7.2 è finalmente qui. Un bot di trading evoluto, studiato per garantire efficienza, stabilità e performance superiori. Ecco perché sempre più trader lo scelgono Backtest (1 anno su XBRUSD – M15)
RaysFX  Donchian Channel Questo indicatore può essere utile per identificare i livelli di supporto e resistenza, nonché per visualizzare visivamente la gamma di prezzo di un determinato periodo. Variabili Valore Periodo 20 TimeFrame Current Mode High/Low(true) o Close (false) Modalità true Telegram:  https://t.me/SmartSaverOfficial Store:  https://www.mql5.com/it/users/rays96/seller Questo indicatore è stato Progettato da RaysFX
RaysFX TMAT3
Davide Rappa
RaysFX TMAT3 è uno strumento potente che combina due tipi di medie mobili per aiutarti a identificare e seguire le tendenze del mercato. L’indicatore utilizza una media mobile triangolare centrata (TMA) e un T3 Moving Average. Queste due medie mobili lavorano insieme per fornire segnali di trading chiari e tempestivi. Quando il T3 Moving Average è inferiore alla TMA, l’indicatore considera che la tendenza del mercato sia al rialzo e genera un segnale di acquisto. Al contrario, quando il T3 Movin
RaysFX Forcaster è un indicatore avanzato per MetaTrader 4, progettato per fornire previsioni accurate del mercato. Questo indicatore utilizza un algoritmo sofisticato per calcolare i valori futuri basandosi su una serie di parametri configurabili dall'utente. Caratteristiche principali: - TimeFrame : Permette all'utente di impostare il timeframe desiderato. Supporta diversi timeframes come M1, M5, M15, M30, H1, H4, D1, W1 e MN. - HalfLength : Questo parametro determina la lunghezza della metà
RaysFX Engulfing RaysFX   Engulfing  è uno strumento potente per identificare i pattern di engulfing nel mercato Forex. Questi pattern sono segnali di inversione di tendenza che possono fornire opportunità di trading preziose. Caratteristiche principali : Rilevamento di pattern engulfing : L’indicatore identifica i pattern engulfing rialzisti e ribassisti, che sono segnali di possibili inversioni di tendenza. Segnali visivi : I pattern rilevati vengono evidenziati sul grafico con frecce blu e ro
RaysFX DMI
Davide Rappa
RaysFX DMI Presentiamo l’Oscillatore RaysFX DMI, un indicatore personalizzato per la piattaforma di trading MetaTrader 4. Questo indicatore unico è progettato per fornire segnali di trading chiari e precisi basati sull’Indice di Movimento Direzionale (DMI). Caratteristiche principali: Oscillatore DMI:   Calcola un oscillatore DMI basato su un periodo DMI specificato e un metodo di media mobile. Smoothing:   L’oscillatore DMI viene ulteriormente lisciato in base a un periodo di lisciatura e a un
RaysFX Dynamic Cycle Explorer (DCE) RaysFX Dynamic Cycle Explorer (DCE) è un potente indicatore di trading sviluppato per la piattaforma MetaTrader 4. Progettato con l’obiettivo di fornire ai trader un vantaggio competitivo, DCE utilizza algoritmi avanzati per identificare e segnalare le opportunità di trading più promettenti. Caratteristiche principali Multi-periodo: DCE utilizza sei periodi diversi per calcolare i suoi segnali, offrendo una visione completa del mercato. Super Trend Price: DCE
RaysFX Candlestick Signals RaysFX Candlestick Signals è un potente strumento progettato per migliorare la tua esperienza di trading su MT4. Questo indicatore personalizzato è stato sviluppato con l’obiettivo di fornire segnali di trading precisi e tempestivi basati su specifiche configurazioni di candele e l’indicatore RSI. Caratteristiche principali : Segnali di acquisto e vendita : L’indicatore genera segnali di acquisto e vendita basati su specifiche configurazioni di candele e valori dell’i
RaysFX Master Inside Bars Master Inside Bars : L’indicatore identifica una serie di “Inside Bars” consecutive, formando un “Master Inside Bar”. Puoi personalizzare il numero minimo di “Inside Bars” consecutive necessarie per formare un “Master Inside Bar”, così come il colore e la larghezza dell’istogramma del “Master Inside Bar”. Inside Bars : L’indicatore identifica le “Inside Bars”, candele che si trovano completamente all’interno dell’intervallo della candela precedente. Puoi personalizzare
RaysFX Auto Fibo RaysFX Auto Fibo v2.1 è un indicatore di trading essenziale per tutti i trader che utilizzano la piattaforma MetaTrader 4. Questo strumento automaticamente disegna i ritracciamenti di Fibonacci sul tuo grafico, risparmiando tempo e fatica. Caratteristiche principali: Disegno automatico : Non dovrai più tracciare manualmente i livelli di Fibonacci. L’indicatore lo fa per te, risparmiandoti tempo e garantendo precisione. Personalizzabile : Puoi personalizzare il colore, lo stile
RaysFX Auto TrendLine Linee di tendenza automatiche : L’indicatore disegna automaticamente le linee di tendenza sul tuo grafico, risparmiandoti tempo e fatica. Personalizzabile : Periodo (nPeriod) : Questo parametro determina il numero di barre che l’indicatore considera per il calcolo delle linee di tendenza. Ad esempio, se imposti     nPeriod     a 10, l’indicatore considererà le ultime 10 barre per disegnare le linee di tendenza. Un periodo più lungo renderà l’indicatore meno sensibile
RaysFX Reversal Bar RaysFX Reversal Bar è un potente strumento di trading progettato per la piattaforma MetaTrader 4. Questo indicatore è stato sviluppato per individuare le inversioni di mercato basate su un modello di candela specifico. Caratteristiche principali: Rilevamento di inversioni : L’indicatore cerca specifici modelli di inversione di 2 barre nel mercato. Questi modelli includono una barra rialzista seguita da due barre ribassiste per un segnale di acquisto, e una barra ribassista
RaysFX 3 Stoch! Sei un trader alla ricerca di un vantaggio competitivo? L’indicatore RaysFX 3 Stoch è l’aggiunta perfetta al tuo arsenale di trading.  Caratteristiche principali: Stocastico a 3 livelli : L’indicatore RaysFX 3 Stoch utilizza tre livelli di stocastico per fornire segnali di trading accurati e tempestivi. Personalizzabile : Puoi personalizzare i periodi di K, D e Slowing, così come i periodi dei tre stocastici, per adattarsi al tuo stile di trading. Allerta integrata : L’ind
RaysFX Supertrend Bar RaysFX Supertrend Bar è un indicatore personalizzato per MetaTrader 4. Utilizza l'indice di canale delle materie prime (CCI) per generare segnali di trading. L'indicatore mostra dei puntini in una finestra separata sotto il grafico principale per indicare i segnali di trading. Caratteristiche principali: Calcola il CCI per diversi periodi temporali. Visualizza puntini per indicare i segnali di trading. Permette all'utente di modificare i periodi temporali e la distanza tra
RaysFX Candlestick Exit  Il RaysFX Candlestick Exit è un indicatore di trading avanzato progettato per i trader che desiderano avere un controllo preciso sulle loro uscite di trading. Questo indicatore utilizza una combinazione di tecniche di trading per fornire segnali di uscita accurati e tempestivi. Caratteristiche principali: Range : Questo parametro consente di impostare il range di candele considerate per il calcolo dell’indicatore. Shift : Questo parametro consente di spostare l’indicator
RaysFX Intraday Fibo RaysFX Intraday Fibo è un indicatore di trading Forex di alta qualità, progettato con precisione e attenzione ai dettagli. Questo indicatore è il risultato di anni di esperienza nel trading Forex e nella programmazione MQL4, ed è stato creato con l’obiettivo di fornire ai trader un vantaggio competitivo nel mercato. Caratteristiche principali: Precisione : L’indicatore RaysFX Intraday Fibo utilizza un algoritmo avanzato per identificare i punti di ingresso e di uscita ottima
RaysFX MACD Divergence Presentiamo RaysFX MACD Divergence, un indicatore di trading avanzato progettato per i trader moderni. Questo indicatore utilizza la divergenza MACD, uno dei metodi più affidabili nel mondo del trading, per fornirti segnali di trading precisi e tempestivi. Caratteristiche principali: Divergenza MACD: L’indicatore identifica e traccia le divergenze MACD, fornendo segnali di trading potenzialmente redditizi. Personalizzabile: Puoi personalizzare i parametri dell’EMA veloce,
筛选:
无评论
回复评论