Argent Aegis

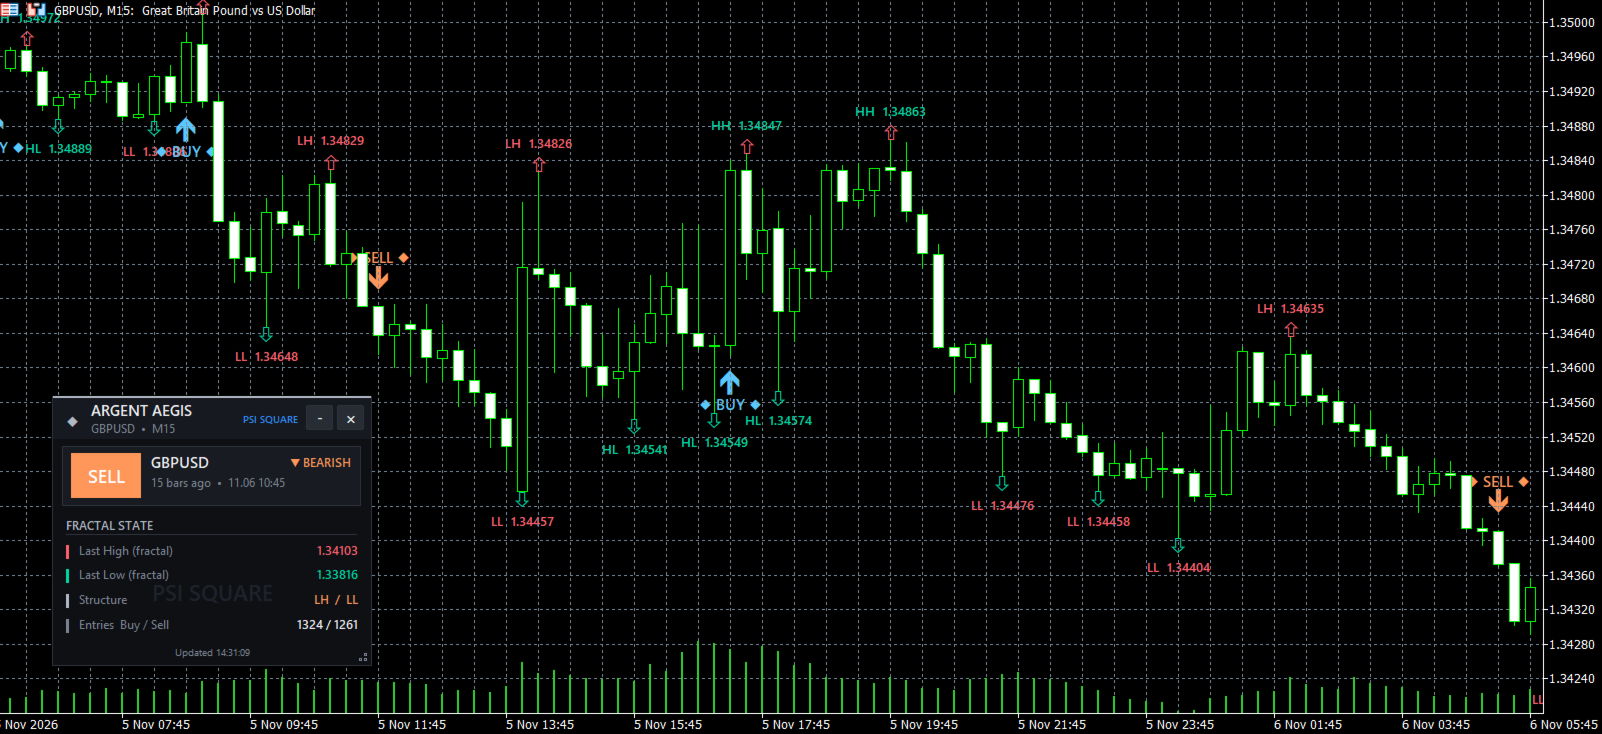
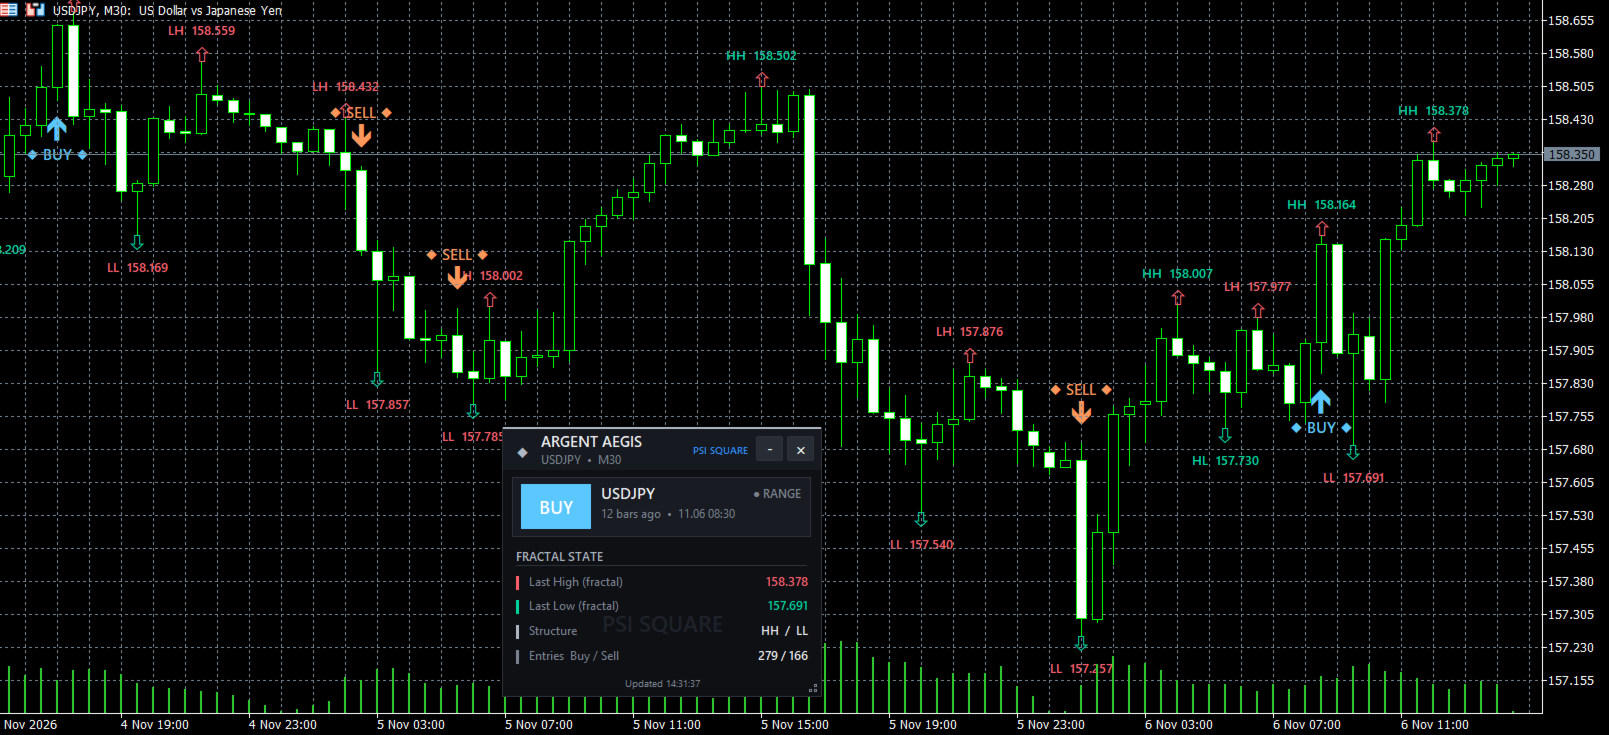
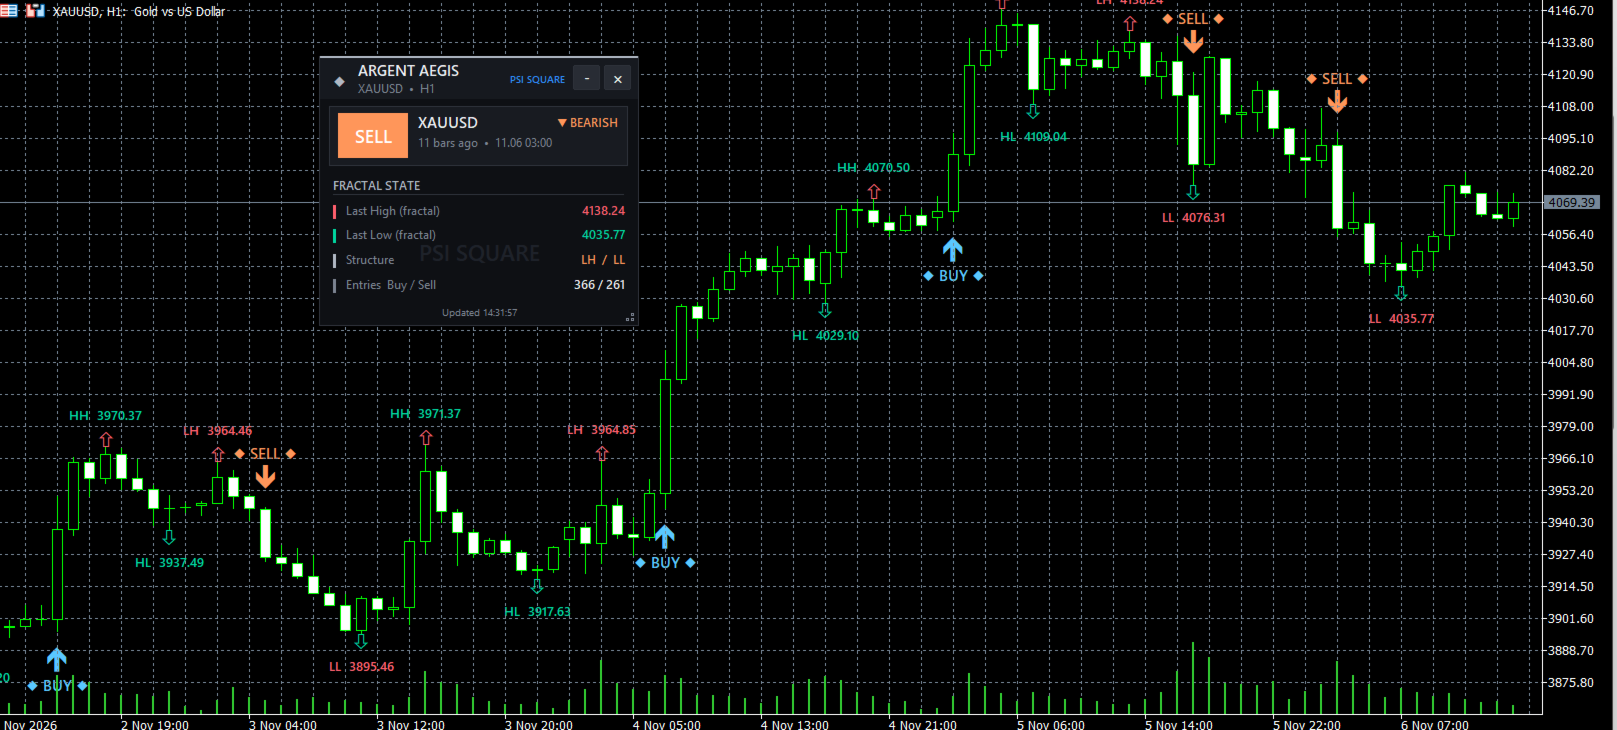
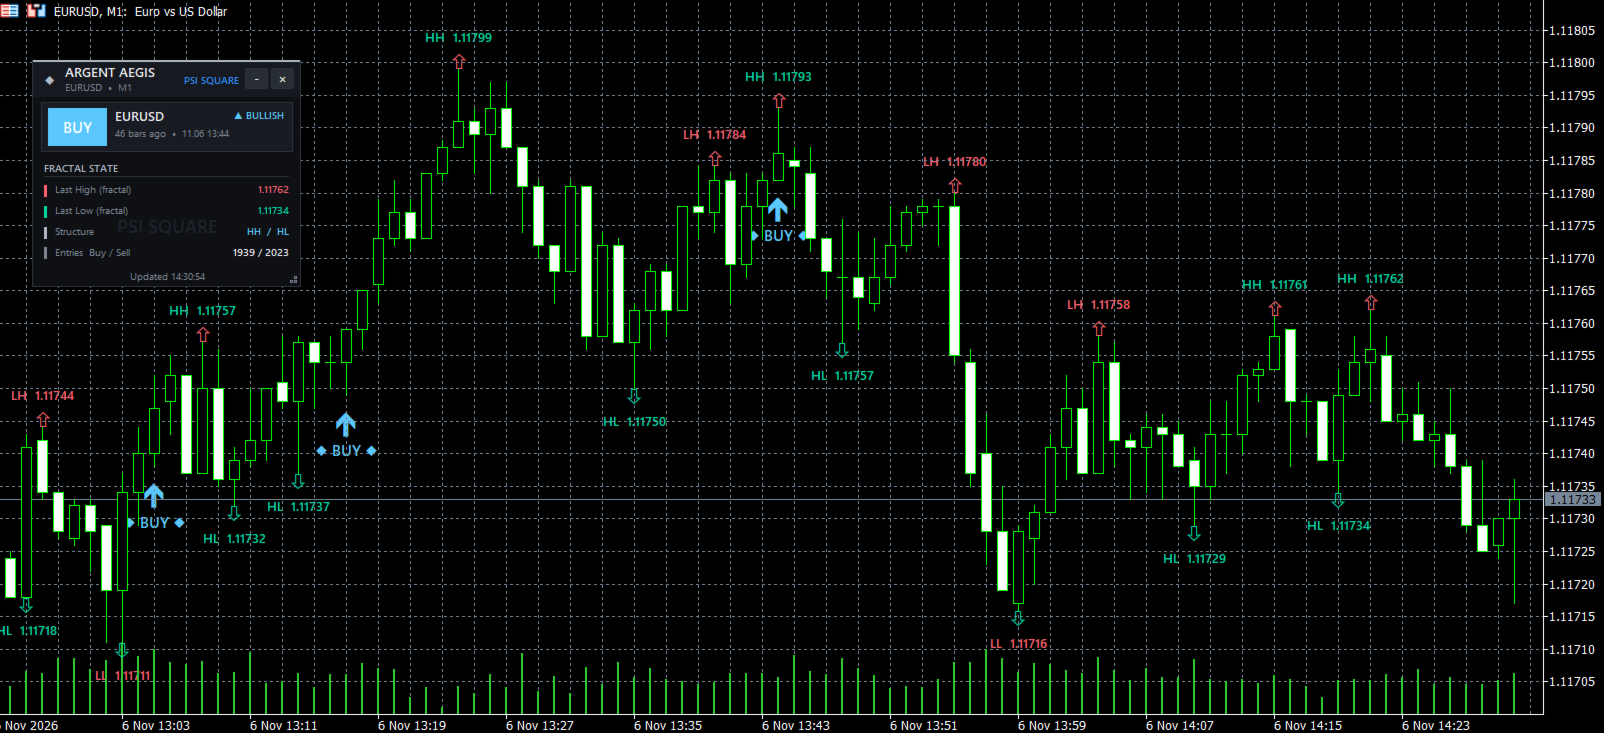
Introducing Argent Aegis, a market-structure and fractal breakout indicator that combines confirmed fractal levels with HH, HL, LH and LL analysis to identify potential BUY/SELL opportunities.

Argent Aegis identifies confirmed swing highs and lows, analyzes market structure and generates BUY signals when price closes above the latest upper fractal with higher-low confirmation, and SELL signals when price closes below the latest lower fractal with lower-high confirmation. It combines breakout confirmation, visual signals and market-structure analysis in one tool.

Key Features:

  • Confirmed Fractal Detection: Identifies swing highs and lows using configurable left-side and right-side periods.
  • Market Structure Analysis: Classifies price swings into Higher Highs (HH), Higher Lows (HL), Lower Highs (LH) and Lower Lows (LL).
  • Fractal Breakout Signals: Generates BUY/SELL signals on confirmed fractal breakouts with directional structure confirmation.
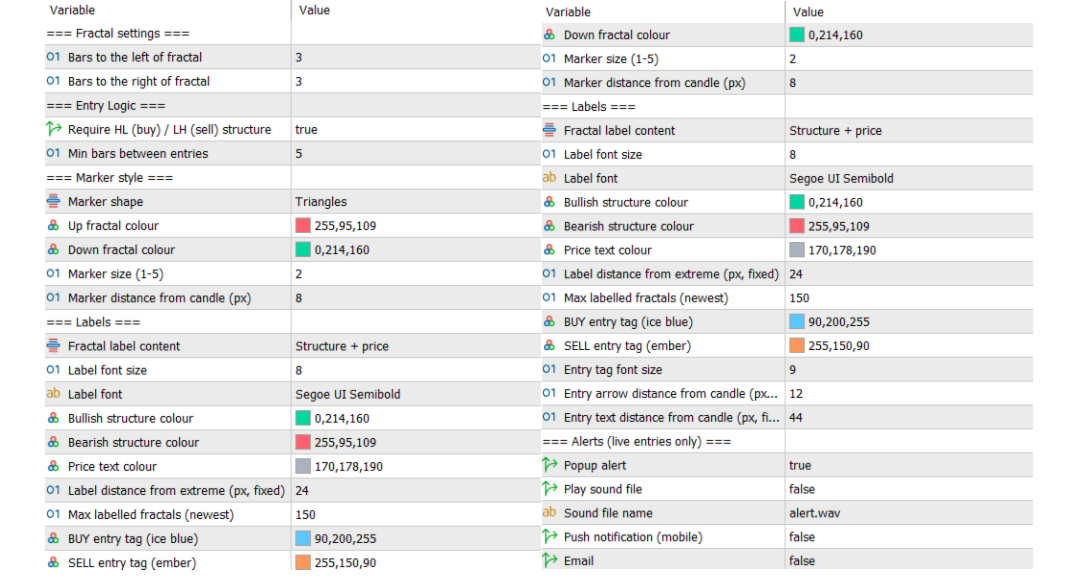
  • Structure Filter: Optionally requires higher-low confirmation for BUY entries and lower-high confirmation for SELL entries.
  • Entry Cooldown: Controls signal frequency through a configurable minimum bar interval.
  • Customizable Markers and Labels: Offers five fractal marker styles, adjustable colors, sizes, distances and structure/price labels.
  • Live Dashboard: Displays market direction, latest entries, confirmed fractal levels, market structure and BUY/SELL counts. Draggable, resizable and minimizable.
  • Customizable Alerts: Supports popup, sound, email and mobile push notifications.
  • EA Integration: Provides entry-direction, buy-price and sell-price buffers for Expert Advisor access through iCustom and CopyBuffer.

Specifications:

  • Confirmed fractal detection with configurable periods. HH, HL, LH and LL market-structure classification. Breakout-based BUY/SELL signals with optional structure filtering and entry cooldown. Customizable markers, labels, dashboard and alerts. Closed-candle signal calculations to avoid signals on the forming candle. EA-compatible signal and price buffers.
  • Argent Aegis combines fractal analysis and market-structure confirmation into one tool for identifying potential price-action trading opportunities.

Trading involves risk. Always test on a demo account first.

Contact

For questions or assistance, contact me via Private Message.


推荐产品
Ultimate Double Top & Bottom (Pro Volume Matrix) Stop trading retail breakouts. Start trading Institutional Traps. The   Ultimate Double Top & Bottom   is not a standard, lagging pattern scanner. It is a highly advanced, non-repainting structural engine equipped with a proprietary   3-Leg Volume Matrix . Designed exclusively for Smart Money Concepts (SMC) and order flow traders, this indicator mathematically dissects the tick volume inside M and W patterns to reveal true institutional intent:  
Fibonacci Pips MT5 Instant Fibonacci Levels, Prices and Pip Distances Fibonacci Pips MT5 is a practical Fibonacci measurement tool for MetaTrader 5. It displays each Fibonacci level together with its exact price and pip distance, helping traders plan pullbacks, profit targets and stop-loss levels without manual calculations. Instead of seeing only percentages such as 38.2%, 50.0% or 61.8%, traders can immediately understand: The Fibonacci level The exact market price The pip distance from the re
The Impulse Heatmap Indicator is an advanced volume and price distribution tool designed to help traders visualize market momentum and locate critical areas of liquidity. By analyzing volume distribution across various price levels over a specified lookback period, this indicator paints a dynamic heatmap directly on your chart, bringing hidden market mechanics into plain sight. This tool is built for traders who want to move beyond standard price action and understand where the bulk of trading
IBI Footprint
Brahim Eljaziri
IBI Footprint draws a professional footprint chart from the real trades of the exchange : for every candle and every price level you see how many contracts were sold and how many were bought . What you see Top of each column: candle volume (V) and delta (Δ = buys − sells). Each price row: sells | buys. Warmer cells = more volume. Diagonal imbalances highlighted (buyer in blue, seller in red). POC (price with the most volume) framed in gold. Click the panel to shrink it to a thin bar and see your
FREE
Emotions are a weakness. QHO mathematics is the future of your trading! You know what really truly frustrating?  Information garbage and noise. All those legacy, lagging indicators on the charts look like an attempt to steer a rocket ship with a steam engine. They are useless. They look at the past while the market is already flying forward on next-gen tech. We created QHO. This is not just another indicator. This is pure mathematics crushing market chaos right on your chart. Imagine completely
Volume flow Profile
Israr Hussain Shah
大师版是一款专业级的分析工具,旨在通过成交量和资金流向的视角来可视化市场结构。与标准的成交量指标不同,该工具直接在图表上显示每日成交量分布,让您准确看到价格发现发生的位置以及“聪明钱”的定位。 此大师版专为清晰度和速度而设计,具有独特的自动主题同步系统,加载后即刻美化您的图表布局。 主要特点: 真实资金流向计算: 超越标准的跳动量。启用“Use Money Flow”时,成交量按价格加权,揭示了特定价格水平的实际资金投入。 价值区域 (VA) 可视化: 自动计算价值区域(默认为成交量的70%)。 VA填充: 为价值区域背景着色,以便即时识别控制区域。 关键水平: 清晰标记控制点 (POC)、价值区域高点 (VAH) 和价值区域低点 (VAL)。 专业标记系统: 扫描概况结构以识别关键交易区域: HVN (高成交量节点): 接受和盘整区域(支撑/阻力)。 LVN (低成交量节点): 拒绝区域或“快速通过”区域。 所有标记均向右绘制延长线,便于监控。 Delta 背离(左侧直方图): 左侧直方图可视化每个级别的买卖压力对比。这有助于识别隐藏的背离——即价格可能上涨,但卖家在这些水平上激进打
SimpleprobMT5
Augusto Martins Lopes
概率指标 描述 概率指标是一款专为交易者设计的工具,旨在通过分析过去的蜡烛图来识别买卖机会。它根据所分析的蜡烛数量计算上涨 ( CALL ) 和下跌 ( PUT ) 的概率,并在图表上显示箭头,以指示可能的入场点。 特点 蜡烛图分析 :分析可配置数量的蜡烛图,以计算上涨和下跌的概率。 视觉信号 :在图表上显示彩色箭头,以指示买入(绿色)和卖出(红色)信号。 声音警报 :为买卖信号提供可配置的声音警报。 通知功能 :向移动设备或电子邮件发送通知,以提供交易信号信息。 概率框 :在图表上显示实时的上涨和下跌概率。 输入参数 num_candles :用于分析的蜡烛总数。 call_threshold : CALL 信号(绿色)的最低百分比。 put_threshold : PUT 信号(红色)的最低百分比。 sound_alert :启用声音警报 ( true/false )。 notifications :启用通知 ( true/false )。 ProbabilityBoxColor :概率框的颜色。 call_sound1 : CALL 信号的声音 1。 call_sound2 :
PowerMagic
Pranav Himmataughade
The Pranavtrxx ( Author ) Levels Indicator is a precision-based trading tool designed to identify key price levels in the market, helping traders make informed entry and exit decisions. This indicator automatically plots dynamic support and resistance zones derived from historical price action, psychological price levels, and recent market structure. Whether you're a day trader or swing trader, this tool offers real-time market level tracking that adjusts with price movement, helping you pinpoin
Trending Investor
Ali Waqas Ahmad
Best helping tool for Professional and Experienced traders. A best Tool To find the trend.  Instruction Manual: First Select your desired Symbol. Then attach this tool and wait till it identify the trend for you. Then it will be more feasible to trade. Once again best tool to trade. Demo version is available you can fully test its functionality. More importantly there are always trend breaks Once Trend break is observed un-attach this tool and then re-attach to get the fresh trend. Precautions:
Trend Sniper Matrix is an institutional-grade trend-riding quantitative trading terminal engineered strictly for Tier-1 multi-asset market environments. Meticulously optimized for advanced Prop Firm Evaluation Compliance and low-latency execution, this Expert Advisor integrates a high-performance bare-metal framework customized for XAUUSD (GOLD), EURUSD, GBPUSD, and USDJPY on low-latency hedging accounts. The core analytical framework leverages a dual-layered Multi-Timeframe Heiken Ashi Smooth
Add an image or logo on a chart. Parameters: "File name for On mode" - location of image file depending MQL5 folder. "Background object" - set the logo as a background object. “x”, “y” – coordinates on the chart, from which the logo shows.   If you want to delete the logo, just remove ea from the chart. The suggested resolution for the image is 200x200 pixels.   You can use this ea while recording a video.
Challenge Keeper 监控您的整个自营交易公司(prop firm)账户,并在违反公司规则之前采取行动。它不会开仓。它可以与手动交易以及同一账户上的其他 EA 一起使用。 工作原理 从列表中选择您的公司和阶段,并输入起始资金。每个预设已经包含该公司计算限额的方式:按余额还是按净值,从当天开始还是从挑战开始计算,以及新交易日开始的时间和时区。 程序在每个报价时检查账户。当净值接近限额时,它会平掉持仓、删除挂单,并在公司下一个交易日之前阻止新交易。您可以设置在限额之前多远采取行动,默认值为起始资金的 0.5%。 两种模式 保护模式(Protect)会替您平仓和减仓。 仅提醒模式(Warn-only)从不开仓、修改或平仓。它会在图表和提醒中告诉您该怎么做,例如“将持仓 123 减至 0.20 手”或“立即平掉所有交易”。适用于不允许使用会修改交易的工具的公司。 检查内容 每日亏损限额,按您所在公司的方式计算 最大亏损:静态,或按净值、已平仓余额或日终余额追踪 盈利目标和每日盈利上限 来自 MetaTrader 经济日历的重要新闻 周末和每日休市(可选在您设定的时间平仓) 每个交易
RiskManagementIndicator
Juan Camilo Meza Novoa
Risk Management Indicator(风险管理指标) 会在价格图表上直接绘制两条水平线,让您实时了解市场距离您的止损限额还有多远。 强制平仓线(Stop Out Line): 显示如果市场继续朝不利方向运行,账户净值降至 0.00 时对应的确切价格。 自定义回撤线(Drawdown Line): 您可以设定愿意承受的美元亏损额(例如 500 美元),指标会绘制出达到该亏损时对应的价格水平。 两条线每隔几毫秒自动刷新一次,无需等待新的K线形成。 可通过输入参数完全自定义线条颜色、宽度和样式。 轻量级设计:不占用单独窗口,直接绘制在主价格图表上。 ️ 注意:所显示的数值是基于当前品种持仓的 估算值 ,并不能替代您的经纪商官方计算结果。
Multi-Confluence Reversal Alert | RSI + Heikin Ashi + Divergence + Key Levels | SL/TP Lines | No Repaint Confluence Reversal Alert is a professional-grade reversal detection indicator for MetaTrader 4. It combines five powerful trading concepts into a single, clean alert system — giving you high-probability reversal signals with automatically drawn Entry, Stop Loss, and Take Profit levels directly on your chart. Designed for traders who use VSA (Volume Spread Analysis), price action, and multi-
ULTRA Indicator V1
Francis Muchai Waweru
ULTRA Indicator V1 MT5 | Smart Money Concepts (SMC) + Order Block Supply & Demand Trading System Overview ULTRA Indicator V1 is a professional MetaTrader 5 (MT5) Smart Money Concepts (SMC) trading system designed to identify institutional-level market structure, liquidity zones, and high-probability reversal areas using Order Blocks and Supply & Demand analysis . This indicator integrates two powerful MQL5 Market tools: SMC Structure Markup Supply and Demand Order Blocks MT5 (OB) By combining s
Squeeze Breakout AF
Alexandre Favero
Price Compression Indicator Based on Financial Volume Levels This indicator was developed to identify price compression regions associated with relevant financial volume levels , using horizontal lines on the chart to highlight areas that may present greater market interest. The system monitors price behavior within these regions, considering different possibilities such as continuation, breakouts, rejections, and potential false breakouts . Therefore, the horizontal lines represent areas for st
FREE
PatternGuard VWAP Trader — A uthor's  Smart Trading Advisor for VWAP Breakout and Pattern-Based Entries PatternGuard VWAP Trader is a professional Expert Advisor for MetaTrader 5 designed to identify trading opportunities after price exits a dynamic NO TRADE zone based on VWAP and volatility bands. The main idea of the system is simple and effective: avoid trading inside uncertain, low-quality market zones and look for entries only when price breaks out of consolidation, confirms direction with
RatioFang Harmonic Order Panel 是适用于 MetaTrader 5 的手动限价单面板。你在图表上设置入场线和止损线,输入风险百分比,按下 BUY 或 SELL 时面板会计算手数并发送限价单。它不会自动交易。 内置 RatioFang 谐波形态指标。只需一个按钮,面板即可把订单线放在最新检测到形态的入场与止损参考线上。 可以做什么 用 LO 按钮绘制 BUY / SELL 限价线(入场和止损),并拖到想要的位置 手数根据止损距离和面板中输入的风险百分比计算(支持 0.5 等小数) 止盈:使用风险回报比,或 RatioFang 的止盈参考线 1-3 RF 按钮:根据 RatioFang 的入场 / 止损参考线绘制订单线(只画线,不发送订单) X 按钮:删除订单线,并仅平仓 / 撤销本面板的订单和持仓(按魔术号和备注匹配) 止损方向错误或限价位于当前价格错误一侧时,会发出警告且不下单 下单流程 按 LO(或 RF)显示入场线和止损线 把线拖到想要的价位 按 BUY 或 SELL:按计算出的手数发送限价单 内置 RatioFang 指标 识别 Gartley、Ba
Visual Book for MT5
Joao Luiz Savioli Filho
This MetaTrader 5 (MT5) indicator script is designed to create a visual book representation of the market order book, displaying buy and sell orders directly on the chart. The indicator uses the following features: Customizable Width and Colors : The width of the visual book can be adjusted, and different colors can be set for buy and sell orders. Market Book Data Handling : It retrieves the current market order book data for the symbol and visualizes this data as rectangles overlaid on the char
Audible order flow, we can set a different tone for up to 12 buy order sizes and 12 other sizes for sell orders. Up to 84 musical notes are available, ie 7 octaves. The default settings have been tested in the Forex (EURUSD, GBPUSD, XAUUSD, USDJPY, USDCHF and USDMXN) and Brazilian futures (WDOFUT, DOLFUT, WINFUT and INDFUT). This tool was inspired by an interview with a visually impaired trader, as there are no tools for this type of trader and I decided to make it available for free, so the
Boleta do Bruxo
Marcio De Medeiros Vieira
GUIA RÁPIDO: BOLETA BRUXO MAPRIS ️ Configuração Inicial Obrigatória Ao arrastar a boleta para o gráfico, antes de clicar em OK, atente-se a dois detalhes: Permitir o Robô Operar: Na aba Comum , marque a caixa "Permitir Trading Algorítmico" . Certifique-se também de que o botão Trading Algorítmico no topo do seu MetaTrader 5 esteja verde . Múltiplos Gráficos (Magic Number): Na aba Parâmetros de Entrada , altere o valor de InpMagicNumber se for abrir mais de um gráfico. Exemplo: Gráfico 1 (Í
NewsOnChart
Abdelhakim El Marchoud
NewsOnChart is the ultimate MetaTrader 5 indicator that integrates a sleek, lightweight, and fully interactive economic calendar right onto your trading screen. Key Features 1-Click Interactive Dashboard: Instantly switch between major currencies (USD, EUR, GBP, JPY, AUD, CAD, CHF, NZD) with a simple click on the on-screen buttons—no need to open the indicator settings. Smart Auto-Detection: The moment you drop the indicator onto a chart, it automatically recognizes the base currency (e.g., EUR
FREE
RBM Trader Painel
Renato Brendim Medici
RBM Trade Panel - Automatic Lot Calculator and Order Management Fast execution panel for MetaTrader 5 featuring automatic dollar-based risk calculation, chart-based partial exits, one-click breakeven, and complete order management. Full Description Doing manual math or switching to external position calculators while price moves rapidly usually leads to missed entries or oversized positions. The RBM Trade Panel fixes this directly on your MetaTrader 5 chart by handling all risk calculations a
FREE
ArroX
Zahed Khodarahmi
ArroX Indicator Description ArroX is a technical analysis indicator designed for MetaTrader 5 platform. This indicator analyzes price movements and market trends to provide trading signals. Key Features: - Displays buy and sell arrows on the chart - Includes trend filtering capabilities - Provides multiple take profit levels - Shows market analysis information panel - Supports different signal sensitivity modes - Uses Bollinger Bands and moving averages for analysis - Includes stop loss calc
================================================================================ POC BREAKOUT - V20.72. Full Professional Grade Toolkit ================================================================================ POC Breakout is a full MetaTrader 5 trading dashboard for discretionary traders who want breakout signals, Point of Control (POC) context, volume profiles, order flow, market structure, news, alerts, and advanced trade planning in one professional workspace. Attached directly to you
Breakout Index
Waleed Saleem
Monster Breakout Index V2 is a clean, visual momentum indicator engineered to spot potential breakout opportunities by evaluating extreme price extensions against median historical range channels. Overview The indicator continuously monitors the median price across a configurable lookback window and compares it against current high and low extremes. When price expansion breaks out of the established median bounds, MBI V2 immediately plots distinct histogram bars in a separate window, allowing tr
ATR MultiTF PRO is a professional volatility and Volume Profile tool for MT5. It projects Daily, Weekly, and Monthly ATR expansion bands alongside institutional Volume Profile metrics (POC, VAH, VAL) on your chart to identify exhaustion, mean-reversion, and high-probability setups. MAIN FEATURES: - Multi-Timeframe ATR Bands: Plots 1D, 1W, and 1M Fibonacci-based ATR expansion zones simultaneously. - Integrated Volume Profile Filter: Tracks POC, VAH, and VAL using customizable lookback periods (
ApexForge Price Ray Marker ApexForge Price Ray Marker 是一款專為價格結構分析設計的高效率 MT5 標記工具。 只需按住 Shift 或 Ctrl 並點擊 K 棒,即可快速建立高點或低點的水平射線與價格標籤,大幅提升分析效率,免去手動畫線的繁瑣流程。 本指標專為價格行為(Price Action)、支撐壓力分析、流動性區域與結構交易而設計,適合日內交易、波段交易及多時間框架分析。 功能特色 Shift + 左鍵:快速標記 K 棒高點 Ctrl + 左鍵:快速標記 K 棒低點 再次點擊同一根 K 棒即可移除標記 自動建立水平射線 顯示右側價格標籤 Delete 一鍵清除所有標記 可自由設定: 線條顏色 線條粗細 線條樣式 價格標籤顏色 價格標籤大小 適合對象 Price Action 交易者 ICT / Smart Money Concepts 支撐壓力交易 Breakout / Fake Breakout 分析 Liquidity Trading 多時間框架分析 ApexForge
FREE
Barak Mega EA
Jorge Jovanny Hernandez Maldonado
BARAK MEGA EA  is a fully automated trading Expert Advisor designed for traders who demand total control, strategic flexibility, and advanced risk management within a single system. This EA functions as a true strategy builder , allowing you to combine multiple technical indicators and custom rules to adapt to any market, asset, or timeframe. Unlike traditional robots with fixed logic, BARAK MEGA EA features a modular architecture where every component can be independently enabled, disabled, and
FREE
Elevate Your Trading Experience with the famous UT Bot Alert Indicator! Summary: The UT Bot Alert Indicator by Quant Nomad has a proven track record and is your gateway to a more profitable trading journey. It's a meticulously crafted tool designed to provide precision, real-time insights, and a user-friendly experience.  Key Features: 1. Precision Analysis: Powered by advanced algorithms for accurate trend identification, pinpointing critical support and resistance levels. 2. Real-time Alert
该产品的买家也购买
Trend Sniper X
Sarvarbek Abduvoxobov
4.86 (44)
Trend Sniper X 是一款适用于 MetaTrader 5 的多周期趋势跟踪指标,可帮助交易者清晰精准地识别趋势方向和潜在的反转点。 适用于 MT4: https://www.mql5.com/en/market/product/193245 价格信息: 当前价格为促销价,随着后续更新和新功能的推出,价格可能会有所变动。 赠品优惠: 购买后联系作者,即可免费获取该指标的 Auto-Trade Assistant EA(自动交易助手 EA)。 Code2Profit 频道 通过多时间框架分析掌控市场! 如何使用 Trend Sniper X 最大化您的胜率:核心规则与交易时段技巧 技术规格 平台 MetaTrader 5 指标类型 多时间周期趋势指标 运行时间周期 任何图表时间周期,可独立选择更高的时间周期 (M1–MN1) 主要交易品种 外汇、黄金 (XAUUSD) 及其他差价合约 (CFD) 推荐账户 任何账户类型 可视化 彩色趋势蜡烛 (买入/卖出/微弱/变化) + 买入/卖出箭头 附加模块 交易时段方框 (悉尼、东京、伦敦、纽约) 主要功能 多时间周期趋势分析: 直接在
Gann Made Easy MT5
Oleg Rodin
5 (13)
Gann Made Easy   是一个专业且易于使用的外汇交易系统,它基于使用先生理论的最佳交易原则。 W.D.江恩。该指标提供准确的买入和卖出信号,包括止损和获利水平。您甚至可以使用推送通知在旅途中进行交易。 购买后请联系我,即可免费获得交易指导和超棒的额外指标! 您可能已经多次听说过江恩交易方法。通常 Gann 的理论不仅对于新手交易者而且对于那些已经有一定交易经验的人来说都是非常复杂的东西。这是因为江恩的交易方法在理论上并不那么容易应用。我花了几年时间来完善这些知识,并将最好的原则应用到我的外汇指标中。 该指标非常易于应用。您所需要的只是将其附加到您的图表并遵循简单的交易建议。该指标不断进行市场分析工作并寻找交易机会。当它检测到一个好的入口点时,它会为您提供一个箭头信号。该指标还显示止损和获利水平。 换句话说,当您像先生一样进行交易时,该指标会为您提供最佳江恩建议。江恩亲自告诉你此时此刻该做什么。但最好的部分是您不需要了解任何有关江恩交易原则的知识,因为该指标会为您完成整个市场分析工作。
Entry Points Pro for MT5
Yury Orlov
4.52 (152)
Entry Points Pro 会在您下单之前,告诉您在哪里入场、止损放在哪里、用多大的手数交易。 价格 现在 149 USD,这是按此价格出售的最后一份。之后价格将涨到 199 USD,最终价格为 349 USD。 我靠交易市场赚钱,并公开展示,所以我不需要把这个指标卖给所有人。它是为独立思考的交易者准备的工具,而不是一个神奇按钮。 箭头在 K 线收盘时出现,并且不会重绘。只有两项设置:您的本金和每笔交易的风险。 付款前先验证:免费演示版可在 MT5 策略测试器中运行,只需两分钟。购买后,我会亲自帮您完成设置。 2019 年,我向全世界展示了这款指标的能力。我按它的信号手动交易,用的是真实账户,全程公开——账户在 Myfxbook 上接受监控,我还在 Facebook 上详细记录了这次实验。结果:10,000 美元在四个月内变成了 941,411 美元。风险是我有意设得极高的——回撤一度达到 54%,因为在我们这一行,利润和风险总是相伴而行。Myfxbook 的截图就是图库中的第一张图片。 看来,要恭喜您了:您的寻觅到此结束。Entry Points Pro 让您的入场不再靠
Ultra Indicator
Ihor Otkydach
5 (1)
ULTRA 是一項採用「一站式」運作模式的技術指標——它能獨立分析市場、產生交易訊號、顯示設定停損單的價位,並建議何時平倉以鎖定獲利或將損失降至最低。 換句話說,無論您是否懂得分析市場、判定價位(該將停損設在哪裡),或是對資金管理感到棘手,都無妨。ULTRA 會為您處理所有這些事情! 買家專屬好禮 : 購買 ULTRA 指標後,請透過私訊聯繫我,即可免費獲贈「ULTRA BOT」。這是一款特別設計的工具,能協助您根據該指標發出的訊號來管理已開倉的交易(它會為每筆交易設定停損點,並依照策略規則自動平倉,以爭取最佳交易結果)。 我還會為買家提供各種資產的預設參數,讓該指標能發揮最大效能。請透過私訊聯繫我,免費獲得這些超級好處! ULTRA 策略的運作方式 ULTRA 指標會分析歷史價格數據(涵蓋約過去 4 年),並自動學習辨識波段反轉,以便在實際交易中為您創造最大利潤。 該指標的訊號絕不會重新繪製!!一切都盡可能做到真實且直觀! ULTRA 指標運用特殊的虛擬化演算法,根據歷史數據計算所有訊號的結果,並將其交易成果顯示於儀表板上。這意味著您甚至在開始交易之前,就能預先了解 ULTRA 指標
M1 Sniper MT5
Oleg Rodin
5 (7)
M1 SNIPER   是一款易于使用的交易指标系统。它是一个专为 M1 时间框架设计的箭头指标。该指标可以作为独立的系统在 M1 时间框架下进行剥头皮交易,也可以作为您现有交易系统的一部分使用。虽然该交易系统专为 M1 时间框架交易而设计,但它也可以用于其他时间框架。我最初设计此方法是为了交易 XAUUSD 和 BTCUSD。但我发现这种方法在其他市场交易中也同样有用。 指标信号既可以顺势交易,也可以逆势交易。我教授一种特殊的交易技巧,帮助您利用指标信号进行双向交易。该方法基于使用特殊的动态支撑位和阻力位区域。 购买后,您可以立即下载 M1 SNIPER 箭头指标。此外,我还为所有 M1 SNIPER 工具用户免费提供下方屏幕截图所示的 Apollo Dynamic SR 指标!这两个指标的组合可以帮助您更轻松、更准确地利用 M1 时间框架进行交易。 购买后请联系我,免费获取交易提示和奖励指标! 祝您交易成功!
Adaptive Price Action Engine 买指标,免费送EA 自适应多时间框架趋势与K线形态智能分析系统 市场环境始终在变化,不同的市场阶段中,并非所有 Price Action 形态都具有相同的参考价值。 Adaptive Price Action Engine 旨在适应不断变化的市场条件,将 趋势结构、多时间框架分析、K线形态与统计优化 整合到一个统一的分析框架中。 两种自适应模式 Dual Alpha Trend Mode(双 Alpha Trend 模式) 自动搜索适合的 Alpha Trend 参数,并结合低周期与高周期市场结构,使指标能够根据近期市场行为动态调整趋势识别。 Candlestick + Alpha Mode(K线 + Alpha 模式) 将 Alpha Trend 市场状态与 22种多空K线形态 相结合。系统不会简单地对所有形态一视同仁,而是对不同的形态组合进行统计评估,并识别在特定市场环境下表现出更强历史统计特征的配置。 主要功能 趋势参数自动优化 多时间框架市场状态分析 22种多头与空头 Price Action K线形态 对数千种可能
FiboSniper Pro
Van Minh Nguyen
5 (4)
FiboSniper Pro – Multi-Filter Fibonacci System with Auto SL/TP and Control Panel FiboSniper Pro 是一款技术指标,将动态 Fibonacci Envelopes 与多个确认过滤器相结合,以生成经过筛选的 Buy 和 Sell 信号。Fibonacci 水平基于 Moving Average 和 ATR 计算,然后通过 ADX、EMA、RSI、ATR、Volume、Time 和 Candle 结构进行过滤。该指标直接在图表上显示基于 ATR 自动计算的 Stop Loss 和 Take Profit 水平,并提供交互式控制面板,以便快速调整参数。 购买后,请通过 MQL5 给我发送消息,即可免费获取 Auto Trader X,以及有关如何将该指标的交易信号自动化的说明。 用户指南和设置文件: [Click here] 完整文档请参阅产品博客: [Click here] 加入官方频道获取最新更新: [Click here] 专为偏好结构化入场和清晰风险管理的交易者设计,适用于 Gold (XAU
Auto Optimized SpeedAngle 是一款机构级的动量向量化系统,通过持续的前瞻优化(Walk-Forward Optimization, WFO)彻底消除了曲线拟合(curve-fitting)。该指标没有采用在市场 状态转换时容易失效的静态输入参数,而是利用出样外验证(Out-of-Sample, OOS) dynamically 动态重新校准设置,从而确保显示的 信号代表真正的统计优势,而非历史巧合。 核心机构级架构 前瞻优化引擎(Walk-Forward Optimization Engine): 核心算法持续扫描数千种回溯周期(lookback)与阈值组合,严格将数据划分为样本内(in-sample)和样本外(out-of-sample)。只有当参数配置在未知数据环境中证明具备数学优越性时,系统才会对其进行 adoption。 量化目标函数(Quantitative Objective Functions): 优化引擎不一味追求绝对毛利,而是聚焦于机构级的稳定性指标。用户可针对系统质量数(SQN)、期望值(每笔交易的平均 R 倍数)或净 R 值进行优化,从而优
Boba Analysis Suite
Trade Ready Solutions LLC
5 (2)
Boba Analysis Suite Boba Analysis Suite 是一款适用于 MetaTrader 5 的分析指标。它将市场结构、关键价格区域和整体市场背景整合到同一图表视图中。 该指标源于交易及交易教学的实践经验,旨在帮助用户建立有条理的分析流程:评估市场方向、识别重要价位,并结合多个时间周期进行分析。 结合市场背景进行分析 单个信号的意义取决于市场背景。Boba Analysis Suite 帮助用户将当前图表状况与更大范围的市场结构相结合,并根据预先制定的规则评估交易思路。 分析功能包括: **趋势与市场结构:**评估市场方向及相关结构背景。 **关键价格区域与价位:**在图表上直观标示值得进一步分析的重要区域。 **多时间周期:**整合不同时间周期的信息,评估整体市场背景。 **可视化分析流程:**直接在图表上查看分析信息。 自主做出交易决策 Boba Analysis Suite 适合希望系统分析图表并结合多个时间周期信息的交易者。 该指标用于辅助分析,不会开仓或平仓,也不能替代交易策略或风险管理。每一笔交易的决策均由用户自行做出。 使用与许可 平台:Meta
Scalper Vault MT5
Oleg Rodin
5 (1)
Scalper Vault 是一套功能强大且配置完善的交易系统,专为追求日内交易稳定性的交易者而设计。 作为一套完整且独立的交易系统,该高精度指标能够为外汇和二元期权交易者提供机构级的市场分析。 购买后请联系我,获取我的独家交易技巧以及一份超值赠品! Scalper Vault 能够消除凭感觉交易和复杂的各种手动分析,让您只需专注于执行交易,并运用简单易行的交易技巧进行操作。 精准的顺势交易信号:其核心算法通过分析市场结构,仅在市场主导趋势的方向上提供高胜率信号,从而大幅减少错误的入场操作。 精确的顶部与底部探测:系统能够识别市场动能耗尽的状态,从而锁定潜在的反转区域。 基于江恩(Gann)理论的买卖区域:系统会自动绘制江恩数学市场点位,让您能清晰洞察大型机构交易者在何处寻求买入或卖出。 100% 不会重绘(Non-Repainting):一旦K线收盘,生成的信号便会永久固定在图表上。绝无动态偏移,绝无虚假信号——您在历史数据中所见,即为该指标的真实表现。 广泛的市场适用性:适用于各类货币对、黄金、指数以及加密货币交易。
Apex Patterns PRO 购买指标 — 免费获取基于该指标的 Expert Advisor。 自我优化的图表形态与突破分析智能 传统的形态扫描器依赖固定输入,在市场波动和结构发生变化时通常表现不佳。 Apex Patterns PRO 旨在适应不断变化的市场条件,将结构性图表形态识别、动量过滤和统计自我优化结合到一个分析框架中。 适应性扫描引擎 自我优化形态模式 在近期历史数据中自动搜索合适的形态参数,使指标能够根据当前市场行为调整其结构检测,而不是使用静态配置。 智能突破过滤 将经典形态识别与动量、成交量和价格行为指标相结合。引擎不会同等对待每次突破,而是评估潜在的市场结构,以识别符合当前统计环境的交易设置。 主要功能 固定的、不重绘的实时信号 自我优化的形态检测参数 丰富的图表结构库(顶部/底部、头肩顶/底、三角形、楔形) 基于动量和成交量的突破过滤 基于市场结构的动态止损和止盈水平 图表信号和实时性能指标 标准的推送、电子邮件和平台提醒 专为适应不断变化的市场条件而设计,而非依赖永久固定的参数 核心理念 目标不是将静态的几何形状强加于动态的市场。 目标是让历史市场数据
Volatility Master for MetaTrader is a real-time dashboard tool that scans up to  50 symbols  to identify high-volatility , trending markets instantly. With bullish/bearish signals, customizable alerts, and a user-friendly interface, it helps you avoid range-bound conditions and focus on high-probability trades. Clarity leads to confidence. Trade confidently and protect your capital effectively with this powerful dashboard. We don't offer free or bonus indicators in exchange of reviews from you.
SIO Oscillator
Davit Beridze
SIO Oscillator:自优化半方差失衡振荡器 购买指标,即可免费获得基于该指标的智能交易系统(EA)。 大多数振荡器对所有价格波动一视同仁。SIO 将上行压力与下行压力分开,并衡量两者之间的失衡程度,清楚显示究竟是买方还是卖方在真正掌控市场。当失衡达到极值时,SIO 会给出明确的信号,并附带入场价、止损(Stop Loss)和止盈(Take Profit)水平。 SIO 的独特之处在于它不依赖固定参数。内置的自优化器会持续寻找适合当前品种和周期的参数,并在使用之前对其进行验证。 两种信号模式 均值回归(Mean Reversion):在失衡极值处交易,预期价格回归平衡。 趋势跟随(Trend Following):顺着持续、占主导地位的失衡方向交易。 自动模式:由优化器根据近期数据选择表现更好的模式。 具备真实验证的自优化器 滚动前推优化(Walk-forward):参数只用历史数据选出,然后应用于之后的K线。 真正的样本外保留期(Hold-out):结果会在优化器从未训练过的数据上得到确认。 平台图(Plateau map):所有测试参数的可视化热力图。SIO 优先选择结果稳
Dynamic Forex28 Navigator MT5
Bernhard Schweigert
5 (1)
多货币强度与动能指标 MT5 Dynamic Forex28 Navigator 是我们长期流行的指标的进化版,将三大功能合而为一: Advanced Currency Strength28 Indicator (700 条评论) Advanced Currency IMPULSE with ALERT (530 条评论) CS28 Combo Signals(近期赠品) 这两个前身指标在 MQL5 Market 上合计获得超过 1,200 条评论,自 2016 年以来一直是 MT4 社区的常用工具。Dynamic Forex28 Navigator MT5 延续了同样经过验证的逻辑。 现已为 MetaTrader 5 全面重构 – 旨在充分利用 MT5 原生的多品种架构。 用户手册: https://www.mql5.com/en/blogs/post/758844 在寻找 MT4 版本?请点击此处: https://www.mql5.com/zh/market/product/122172 这个货币强度指标提供什么? 您喜爱原版指标的一切,现在都通过新功能得到增强。 主要功能 专有
Neuro Poseidon MT5
Daria Rezueva
4.68 (53)
Neuro Poseidon is a new indicator by Daria Rezueva. It combines precise trading signals with adaptive TP/SL levels - creating best possible trades as a result! Message me and get  Neuro Poseidon Assistant  as a gift to automize your trading process! What makes it stand out? 1. Proven profitability on all assets and timeframes 2. Only confirmed BUY and SELL signals present on the chart 3. Adaptive TP & SL levels generated by the software for each trade 4. Easy to understand - suitable for al
AriFocus
Temirlan Kdyrkhan
AriFocus - Non-Repainting Buy/Sell Signals AriFocus - one clear signal. AriFocus marks buy and sell signals directly on the chart and suggests a stop-loss level for each one. Every signal is confirmed on bar close and never repaints. - Buy/sell arrows, confirmed on bar close - Suggested stop-loss level for every signal - Trend band and candle coloring to show direction at a glance - 10 ready-made presets, or your own settings (14 calculation methods) - Pop-up, push and email alerts with entr
货币强度向导是一个非常强大的指标,为您提供成功交易的一体化解决方案。该指标使用多个时间范围内所有货币的数据来计算这个或那个外汇对的力量。此数据以易于使用的货币指数和货币电力线的形式表示,您可以使用它们来查看这种或那种货币的力量。 您所需要的只是将指标附加到您要交易的图表上,该指标将向您显示您交易的货币的真实强度。该指标还向您显示买卖量压力的极值,您可以在顺势交易时利用这些压力。该指标还显示了基于斐波那契的可能目标。该指标可用于各种交易时间范围。该指标支持各种货币对的交易。   该指标为您提供所有类型的警报,包括推送通知。 购买后请联系我。我将与您分享我的交易技巧,并免费为您提供丰厚的红利指标! 祝您交易愉快,获利丰厚!
Advance AI Scanner
Mohamed Samsudeen
5 (1)
Advance AI Scanner is a multi-symbol analysis indicator for MetaTrader 5. It scans Forex pairs, metals, energy, stock indices and cryptocurrencies at the same time and rates each instrument with its own self-training model. It explains in plain English what moved each market and why, and it estimates how far upcoming economic news usually moves each symbol, measured on your broker's own price history. $199 instead of $499. 10 copies left at this price. One time purchase  Installation and User
Azimuth Pro
Ottaviano De Cicco
5 (7)
Azimuth Pro V2:MT5合成分形结构分析与确认入场 概述 Azimuth Pro 是 Merkava Labs 推出的多层级波段结构指标。四层嵌套波段层级、锚定波段的VWAP、ABC形态识别、三时间框架结构过滤以及收盘确认入场——一个图表,一个从微观波段到宏观周期的完整工作流程。 这不是盲目的信号产品。它是一个以结构为先的工作流程,专为重视位置、背景和时机的交易者打造。 万圣节促销 — 立减35% 市场愈发诡谲,你的优势依然锐利。立享35%优惠,别让这份好礼消散在迷雾之中。 Azimuth Pro 现价 259 美元(原价 399 美元)。 1. V2的变化 合成多时间框架引擎 高时间框架分析从零开始重建,采用与Meridian Pro相同的专有合成架构。更清晰的HTF背景、稳定的实时行为、无经典MTF同步问题。合成引擎还解锁了 固定比率时间框架级联 (x2、x3、x4、x6)——不再在经纪商的固定时间框架之间任意跳转,您可以按图表时间框架的固定倍数分析结构,在每个尺度上保持相同的分形关系。 确认入场箭头 作为稳定且可恢复的执行层而设计的收盘确认箭头。当ABC设
SkyHammer Signal Pro
Shengzu Zhong
5 (4)
SkyHammer Signal Pro Professional No-Repaint Trend Signal Indicator with Locked Entry, SL and TP Levels SkyHammer Signal Pro is a structured trend and momentum signal indicator designed for traders who want clear, fixed, and verifiable trading signals. It works best on lower timeframes such as M1 and M5 . The indicator does not try to predict tops or bottoms. Instead, it waits for confirmed market structure, trend direction, momentum strength, volatility quality, and target space before generati
Bill Williams Advanced
Siarhei Vashchylka
5 (11)
Bill Williams Advanced is designed for automatic chart analysis using Bill Williams' "Profitunity" system. The indicator analyzes four timeframes at once. Manual (Be sure to read before purchasing) Advantages 1. Analyzes the chart using Bill Williams' "Profitunity" system. Signals are displayed in a table in the corner of the screen and on the price chart. 2. Finds all known AO and AC signals, as well as zone signals. Equipped with a trend filter based on the Alligator. 3. Finds "Divergence Bar
Power Candles MT5
Daniel Stein
4.58 (12)
Power Candles V3 - 自我优化的强度指标 Power Candles V3 把货币与品种的强度直接转化为图表上可执行的交易方案。指标不再仅根据强度给K线着色,而是在后台持续运行实时自动优化,为您正面对的品种给出最佳 Stop Loss、Take Profit 与信号阈值。一键采用,Entry、Stop Loss、Take Profit 线就以精确价格绘制在图表上,提醒消息中直接包含方向。 本工具是 Stein Investments 生态系统的一部分 - 18+ 款工具,加上 Max,您的一对一 AI 交易导师。  随时在线,深入了解每一款指标,在您需要梳理思路的那一刻就在那里。  立即认识他: https://stein.investments 每根收盘K线运行 3,000+ 次交易模拟。9 种强度状态。2 种策略并行测试。一键采用最优配置。 为什么需要这个 大多数强度指标只给您一个数值,然后留下三个问题:相信哪个阈值、用哪个 Stop Loss、走哪个交易方向。Power Candles V3 在每根收盘K线上自动回答这些问题。结果就是一个完整的交易方案 -
Apollo SR Master 是一款支撑/阻力指标,其特殊功能使利用支撑/阻力区域进行交易更加便捷可靠。该指标通过检测局部价格顶部和底部,实时计算支撑/阻力区域,没有任何时间延迟。为了确认新形成的支撑/阻力区域,该指标会显示特殊信号,表明该支撑/阻力区域可以作为实际的卖出或买入信号。在这种情况下,支撑/阻力区域的强度会增强,因此从该区域进行交易的成功率也会更高。这正是该指标的核心理念。 SR区域也使止损和止盈的操作更加便捷。根据信号方向,可以将SR区域上方或下方的空间用作止损位。此外,相对的SR区域也可以用作潜在的止盈区域。 我还免费向所有 Apollo SR Master 指标的用户提供我的“Apollo 价格行为系统”指标。这两个指标结合使用将帮助您找到更好的入场点。 购买后请联系我,即可免费获得交易指导和超棒的额外指标!
Murrey Math Classic
Sarvarbek Abduvoxobov
5 (2)
Murrey Math Classic Murrey Math Classic 是一款专业且动态的交易指标,旨在以极高的数学精准度预测金融市场的价格走势。该系统将传奇的价格-时间几何学进行了现代化改造,将其转化为适用于现代金融市场的高度结构化数学模型。 莫里数学(Murrey Math)的核心逻辑在于,金融市场并非随机移动,而是按照特定的节奏运行。就像音乐被划分为八度音阶的 8 个音符一样,任何给定的价格区间都被划分为 8 个相等的数学级别(从 0/8 到 8/8)。这些线条充当了隐藏且高度可靠的支撑位与阻力位区域,在价格到达之前就能揭示潜在的转折点。 Code2Profit 频道 指标如何工作 | 完整策略概述 终极多重确认入场策略详解 为什么 Murrey Math Classic 优于传统指标 Murrey Math Classic:从理论到图表精准度 指标历史与概念 该系统由 T. Henning Murrey 于 1995 年创建,并发表在其开创性著作《莫里数学 trading 系统》("The Murrey Math Trading System")中 莫里
Divergence Bomber
Ihor Otkydach
4.89 (94)
购买该指标的每位用户将额外免费获得以下内容: 原创工具“Bomber Utility”,该工具会自动跟踪每一笔交易,设置止损和止盈点,并根据策略规则自动平仓; 适用于不同交易品种的指标设置文件(Set 文件); 三种不同风险模式下的 Bomber Utility 设置文件:“最低风险”、“平衡风险” 和 “观望策略”; 一套详细的 视频操作手册,帮助您快速完成安装、配置并开始使用本交易系统。 注意: 要获取以上所有赠品,请通过 MQL5 的私人消息系统联系卖家。 我为您介绍原创的自定义指标 “Divergence Bomber”(背离轰炸机),它是一套基于 MACD 背离交易策略 的“全功能”交易系统。 该技术指标的主要任务是识别 价格与 MACD 指标之间的背离,并发出交易信号(包括推送通知),指示未来价格可能的运动方向。平均而言,这些信号的准确率超过 98%。有关该指标如何工作的详细说明,请观看本页面上的视频演示。 该系统使用 止损订单 和 动态回撤平仓机制 来管理交易。 Divergence Bomber 指标的主要特点: 支持交易的品种: AUDCAD、AUDCHF、AUDS
Superhero
Ihor Otkydach
5 (3)
SUPERHERO 指標是一款基於「全方位」原則設計的多貨幣交易系統。該指標能獨立分析市場,並提供開倉與平倉的交易訊號。它採用止損與獲利了結訂單,風險報酬比(R:R)為 1:1。 此系統可向您的智慧型手機發送推播通知,讓您無需綁定電腦,即可「隨時隨地」進行交易。這對於自營交易公司而言再適合不過了。 每位顧客皆可享額外好禮: 每位購買此指標的買家,都將收到我贈送的一項特別實用工具,該工具: 自動下達止損與獲利了結訂單 當價格達到目標水準時,系統會自動平倉 支援待執行訂單交易 支援均值交易模式 如果您希望將這款優秀且極為便利的工具作為禮物獲贈,請在購買 SUPERHERO 指標後,立即透過 MQL5 平台的私訊與我聯繫。此外,您還將獲得培訓課程「如何安裝與設定 SUPERHERO 並開始穩定獲利」的存取權限。 關於「超級英雄」策略 SUPERHERO 策略是利用價格回調時,順應趨勢方向進行盤中交易。 「超級英雄」程式碼內含數個強大的技術指標,用以分析價格通道的趨勢方向與波動範圍,並能識別在修正性回調後形成的盤中波段反轉形態。 SUPERHERO 指標採用獨特的自我優化演算法,一旦添加至價格
Trend Lines PRO MT5
Roman Podpora
5 (1)
TREND LINES PRO 帮助您了解市场真正的方向转变点。该指标显示真实的趋势反转点以及主要参与者重新入场的时机。 您可以看到 BOS线、 趋势变化和更高时间框架的关键水平——无需复杂的设置或不必要的干扰。信号不会重绘,并在K线收盘后仍然保留在图表上。 VERSION MT4    -   与……搭配使用时,可发挥其最大潜力   RFI LEVELS PRO 指示器 该指标显示的内容: 实际变化 趋势(BOS 线) 一旦信号出现,它就始终有效!这与会重绘的指标有着重要的区别,后者可能会发出信号后又改变信号,从而导致资金损失。现在,您可以更精准、更准确地进入市场。此外,还有一个功能,会在箭头出现后为K线着色,直到达到目标价位(止盈)或出现反转信号为止。 重复条目   以及主要玩家的充值 为了提高寻找入场点时的视觉清晰度,我们创建了一个模块,该模块首先显示买入/卖出区域,并在该区域内寻找最佳入场点。此外,我们还加入了智能逻辑来管理止损位,该逻辑会随着时间的推移逐步降低止损位的大小,从而降低入场交易时的初始风险(移动止损位)。 信号强度水平(BOS) 该指标采用三个显著性等级来衡量趋
FootPrint Chart MT5
Gayathiri Gopalakrishnan
5 (1)
Turn every candle into a bid x ask footprint built from real tick data. See who is actually trading at each price, with delta, volume profile, imbalance zones and a scored setup engine that prints entry, stop and target Order Flow Footprint Chart Pro Most indicators tell you what price did. This one tells you who did it. Order Flow Footprint Chart Pro rebuilds every candle on your chart from raw tick data and shows you the volume that traded at each individual price inside it, split into the am
Astral Structure
Ottaviano De Cicco
Astral Structure 评估交易形态,查看初始计划。 首发特惠 - $99. 首发结束后价格为 $149。 基于市场结构的交易形态会带来多个问题:更广的周期背景是否一致,止损参考位在哪里,目标如何确定?Astral Structure 为依据市场结构自主判断的交易者,将这些问题汇集在同一工作区。 聚焦当前相关形态。 一起查看最新符合要求的形态、方向及其条件满足情况。 观察周期间的一致性。 比较选定周期的读数,同时保持对当前形态的关注。 让初始计划与形态保持关联。 查看锚定于该形态的止损与目标参考位,无需分别拼接各项信息。 使用 Structure,以一致的流程评估最新通过筛选的形态,并同时查看其背景与初始价格计划。 结合背景解读交易形态 查看最新的 BUY 或 SELL 形态、对应的 Structure Level,以及所选的 SL 和 TP1-TP3 参考位。三栏周期矩阵显示当前图表与所选的更高周期视图,无需切换图表即可观察一致与分歧。矩阵是否显示与确认条件分别控制。 选择风险模型 止损: Confirmed Swing、ATR 或 Structure Projection
Apollo BuySell Predictor 是一个包含多个模块的专业交易系统。该指标为交易者提供价格突破区、基于斐波那契的支撑和阻力位、趋势反转线、交易量信号、回调和任何交易者每天都需要的其他有用功能。该系统将适用于任何一对。推荐的时间框架是 M30、H1、H4。尽管该指标可以与其他时间范围一起使用,但 H4 以上的时间范围除外。 该系统是通用的,因为它提供了任何交易者成功交易所需的一切。该系统可以多种方式使用。该指标可用于日内交易、波段交易甚至剥头皮交易。无论您喜欢哪种交易方式,系统都会帮助您以真实的形式看待市场。所有系统信号都不会被重绘! 您可以根据您的交易偏好和任务启用/禁用各种系统模块。系统提供所有类型的通知,包括PUSH通知。您可以打开/关闭您需要的通知。 购买后请给我发电子邮件。我将与您分享交易说明和重要的红利指标,它们将使您的交易更加有利可图!
作者的更多信息
Meridian Signal
Muhammad Okasha Razaq
Introducing Meridian Signal, a trend-following signal indicator that turns every trend reversal into a clear, ready-to-use trade plan. Meridian tracks the market's direction with an adaptive trend line built from price channels, short moving averages, and ATR volatility. When the trend reverses, it marks the signal on your chart and instantly calculates your Entry, Stop Loss, and Take Profit. Everything you need to plan a trade is in one place, helping you spend less time analyzing and more tim
Obsidian Trend
Muhammad Okasha Razaq
Obsidian Trend: Trend Reversal Signals with a Live Dashboard Obsidian Trend is a trend-following indicator that displays the market's direction as a single step-style trend line. When the trend reverses, it marks the change with an arrow and a BUY/SELL tag displaying the signal price. A live dashboard panel on the chart shows the current trend, the latest signal, and how price has moved since the signal appeared. The trend line follows the market using recent highs and lows over an adjustable A
Helix Ribbon
Muhammad Okasha Razaq
Introducing Helix Ribbon, a trend-following ribbon indicator that turns every trend crossover into a clear, ready-to-read signal. Helix tracks the market's direction with two moving averages: a fast Triple Exponential Moving Average (TEMA) and a slow Hull Moving Average. The space between them is drawn as a flowing, color-shifting ribbon with thin strands inside it. When the fast line crosses the slow line, the ribbon twists and Helix marks the new trend on your chart with an arrow and a BUY/SEL
Vantage Bands
Muhammad Okasha Razaq
Introducing Vantage Bands, a multi-layer trend indicator that combines a Natural Moving Average, an anchored VWAP, a Bollinger cloud and a Kalman-smoothed Hull crossover into one clean chart overlay. Vantage reads the market in layers. The Natural Moving Average (NMA) shows the main trend and changes color with its slope. The anchored VWAP shows where the session's volume-weighted price sits. The Bollinger cloud shows how stretched price is. Two Kalman-filtered Hull lines, a Hull Trend line and
Zygos TDI
Muhammad Okasha Razaq
Introducing Zygos TDI, a Traders Dynamic Index indicator that turns RSI momentum, volatility and trend into one clear, ready-to-read window. Zygos builds on the classic TDI idea. It smooths the RSI into a fast price line and a slower signal line, then wraps them in volatility bands and a colour-changing baseline. When the price line crosses the signal line, Zygos marks the exact bar with an arrow. The bands show how stretched the market is, the baseline shows which way momentum is leaning, and t
Themis SMC
Muhammad Okasha Razaq
Introducing Themis SMC, a Smart Money Concepts indicator that puts market structure, order blocks, liquidity, fair value gaps, premium and discount zones and rule-based entry signals on one clean chart overlay. Themis reads the market in layers. Internal and swing structure show every Break of Structure (BOS) and Change of Character (CHoCH). Order blocks mark the zones where price is likely to react. Equal highs and lows show resting liquidity. Fair value gaps show imbalance. The premium and di
Nova Exhaustion
Muhammad Okasha Razaq
Introducing Nova Exhaustion , a trend exhaustion indicator that finds the bar where a move runs out of steam. It combines a 9-count setup, a filled SuperTrend and automatic support and resistance levels, all on one clean chart overlay. Nova Exhaustion counts consecutive closes against the close four bars earlier. Nine closes in a row below it mark selling exhaustion and a BUY. Nine closes in a row above it mark buying exhaustion and a SELL. The counts at 7 and 8 warn you early that a 9 is close.
Vortex Anchor
Muhammad Okasha Razaq
Introducing Vortex Anchor , a multi-level market structure and Anchored VWAP indicator that brings swing analysis, trend bias, key price levels and entry signals together in one chart. Vortex Anchor tracks market structure through four independent ZigZag swing levels, each designed to highlight a different degree of price movement. From small local swings to major structural turning points, every level has its own marker, making it easier to distinguish short-term movements from broader market d
Axiom RSI
Muhammad Okasha Razaq
Introducing Axiom RSI , a momentum and trend analysis indicator that combines advanced RSI calculations, moving-average trend detection, a color-coded histogram and rule-based BUY/SELL signals in one integrated indicator. Axiom RSI combines RSI momentum with fast and slow moving-average channels to identify bullish, bearish and neutral market conditions. It offers multiple RSI calculation methods and customizable trend filters to adapt the analysis to different trading approaches. When the sele
Trinity Nexus
Muhammad Okasha Razaq
Introducing Trinity Nexus , a multi-indicator trend analysis tool that combines Flux, Core Trend, Pulse, and Anchor to identify market direction and generate aligned BUY/SELL signals. Trinity Nexus evaluates the selected indicators together, generating signals when all enabled components agree on market direction. It also offers configurable signal modes, trend-strength analysis, and an interactive dashboard for monitoring market conditions. Key Features: Four Indicator Components: Combines Flu
Lumen Trend
Muhammad Okasha Razaq
Introducing Lumen Trend , a multi-component trend analysis indicator that combines MACD momentum, RSI conditions, Wave Trend confirmation, and moving-average trend detection to identify potential BUY and SELL opportunities. Lumen Trend uses three configurable trend meters alongside two additional moving-average trend bars to assess market direction. When all three primary meters align, the indicator generates a potential BUY or SELL signal, with optional Wave Trend crossover confirmation to refi
Helios Flux
Muhammad Okasha Razaq
Introducing Helios Flux , a SuperTrend-based trend analysis and trading signal indicator that combines ATR bands, EMA bias, RSI momentum and candle confirmation to identify potential trend reversals and pullback opportunities. Helios Flux detects trend changes using an ATR-based SuperTrend engine and applies optional EMA, RSI and candle filters to validate entries. It also supports pullback re-entry signals, BUY/SELL markers, trade plan previews, customizable alerts and an interactive dashboard.
Kestrel Trail
Muhammad Okasha Razaq
Introducing Kestrel Trail , a SuperTrend-based trend-following indicator that combines ATR trailing levels with optional RSI, ADX and EMA filters to identify potential BUY/SELL opportunities. Kestrel Trail uses ATR-based calculations to establish dynamic trailing levels and detects trend reversals when price crosses the trail. Optional confirmation filters help validate entries through momentum, trend strength and EMA direction, providing a structured approach to trend analysis. Key Features: Dy
Halcyon Channel
Muhammad Okasha Razaq
Introducing Halcyon Channel , a Keltner Channel-based trend and trading signal indicator that combines EMA, ATR bands and optional RSI confirmation to identify potential BUY/SELL opportunities. Halcyon Channel builds dynamic price channels using an EMA basis and ATR-based upper and lower bands. It offers three entry modes: Breakout, Basis Cross and Band Re-entry, with optional RSI confirmation to validate signals. A trend-coloured basis, chart markers, live dashboard and customizable alerts prov
Eclipse Valkyrie
Muhammad Okasha Razaq
Introducing Eclipse Valkyrie , a relative volume and momentum-based trading indicator that combines RVOL analysis, EMA trend confirmation and price breakouts to identify potential BUY/SELL opportunities. Eclipse Valkyrie compares current volume against historical averages to classify market activity as Surge, Normal or Dormant. It combines EMA alignment, candle strength, breakout confirmation and minimum relative volume requirements to identify potential entries, supported by clear chart signal
Ambrosia Pulse
Muhammad Okasha Razaq
Introducing Ambrosia Pulse , a momentum-based trading indicator that combines momentum strength and PPO confirmation to identify potential BUY/SELL opportunities. Ambrosia Pulse analyzes market momentum using a configurable momentum oscillator and PPO histogram, generating signals when both align and momentum strengthens. With clear chart labels, a live dashboard and customizable alerts, it provides a structured approach to identifying potential market entries. Key Features: Momentum Analysis:  
Moira Threads
Muhammad Okasha Razaq
Introducing Moira Threads, a multi-factor trend analysis indicator that combines multiple market indicators to identify market direction, measure trend strength and detect potential trading opportunities. Moira evaluates market conditions using RSI, multi-timeframe EMA alignment, Bollinger Bands and relative strength against a configurable benchmark. These components contribute to a weighted score ranging from -100 to +100, which is used to determine the current trend state and generate trading
DynaRatchet
Muhammad Okasha Razaq
DynaRatchet is an automated trading tool that locks in your profits while giving your trades room to breathe. Much like a mechanical ratchet that only turns one way, this tool moves your safety floor forward as the market goes in your favor, but completely locks in place during temporary pullbacks. This removes the guesswork and emotion from deciding exactly when to exit a trade. Instead of using a rigid, fixed distance, it automatically studies the market's current speed. It widens during wild
筛选:
无评论
回复评论