Argent Aegis

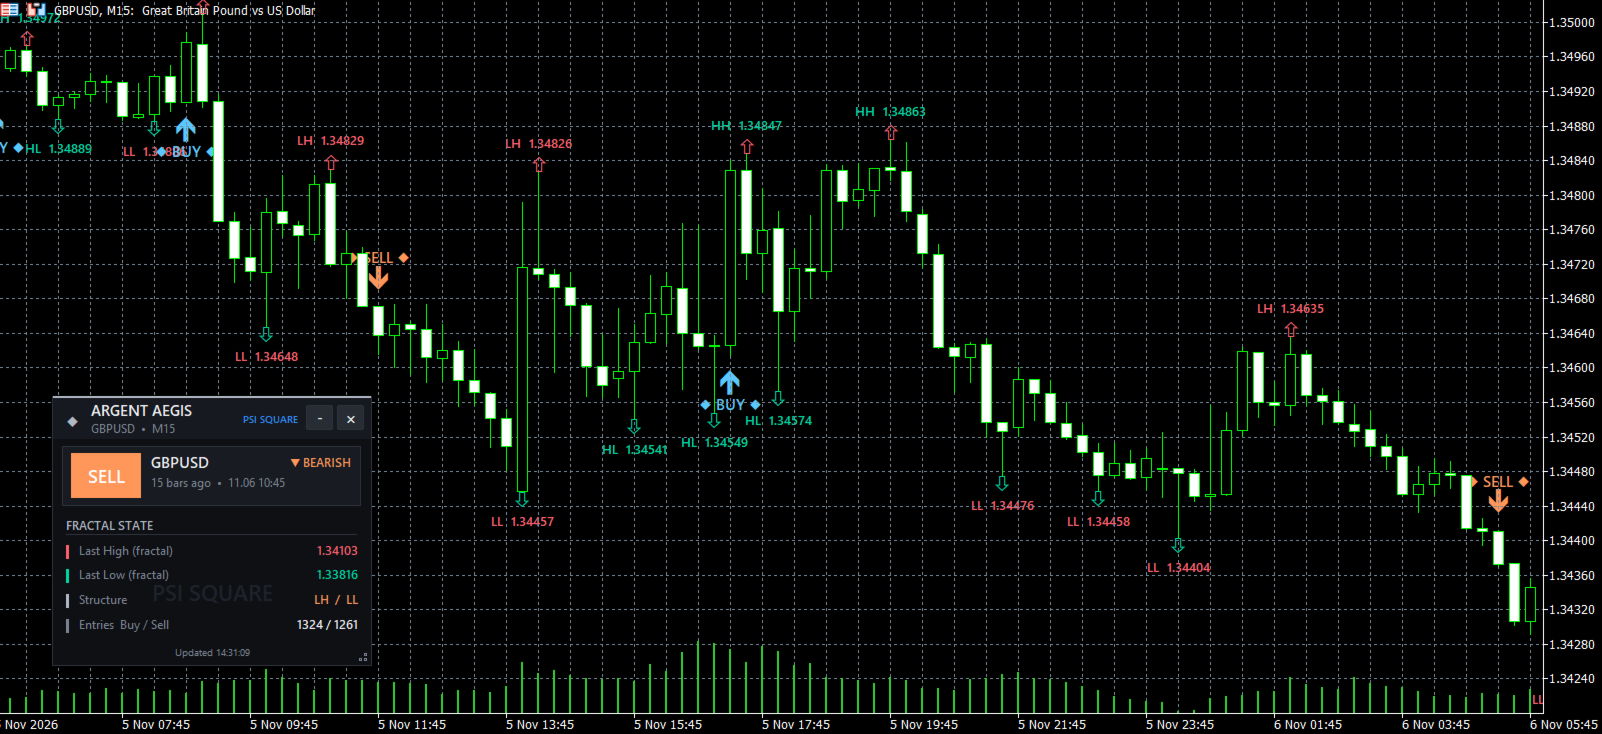
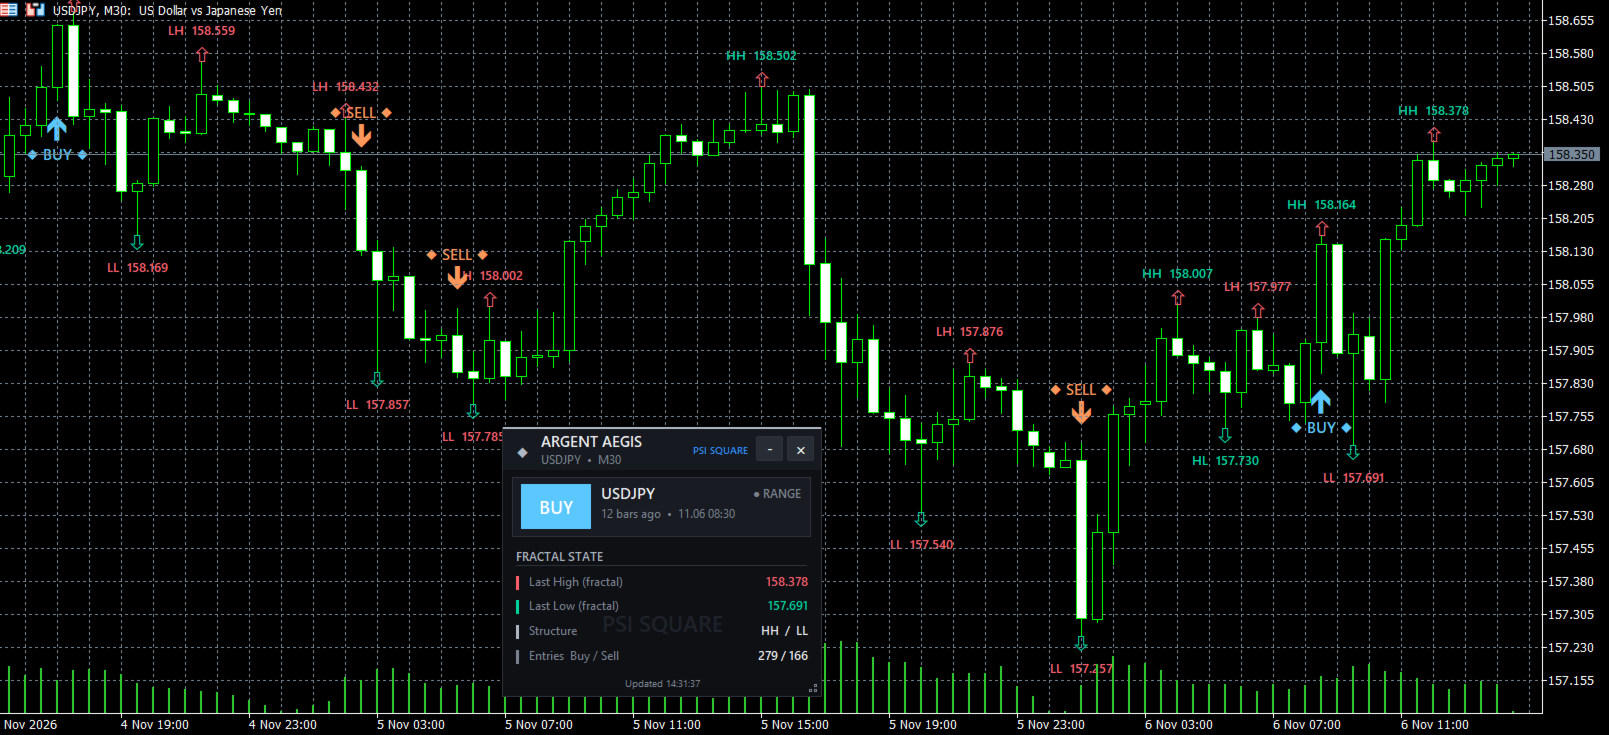
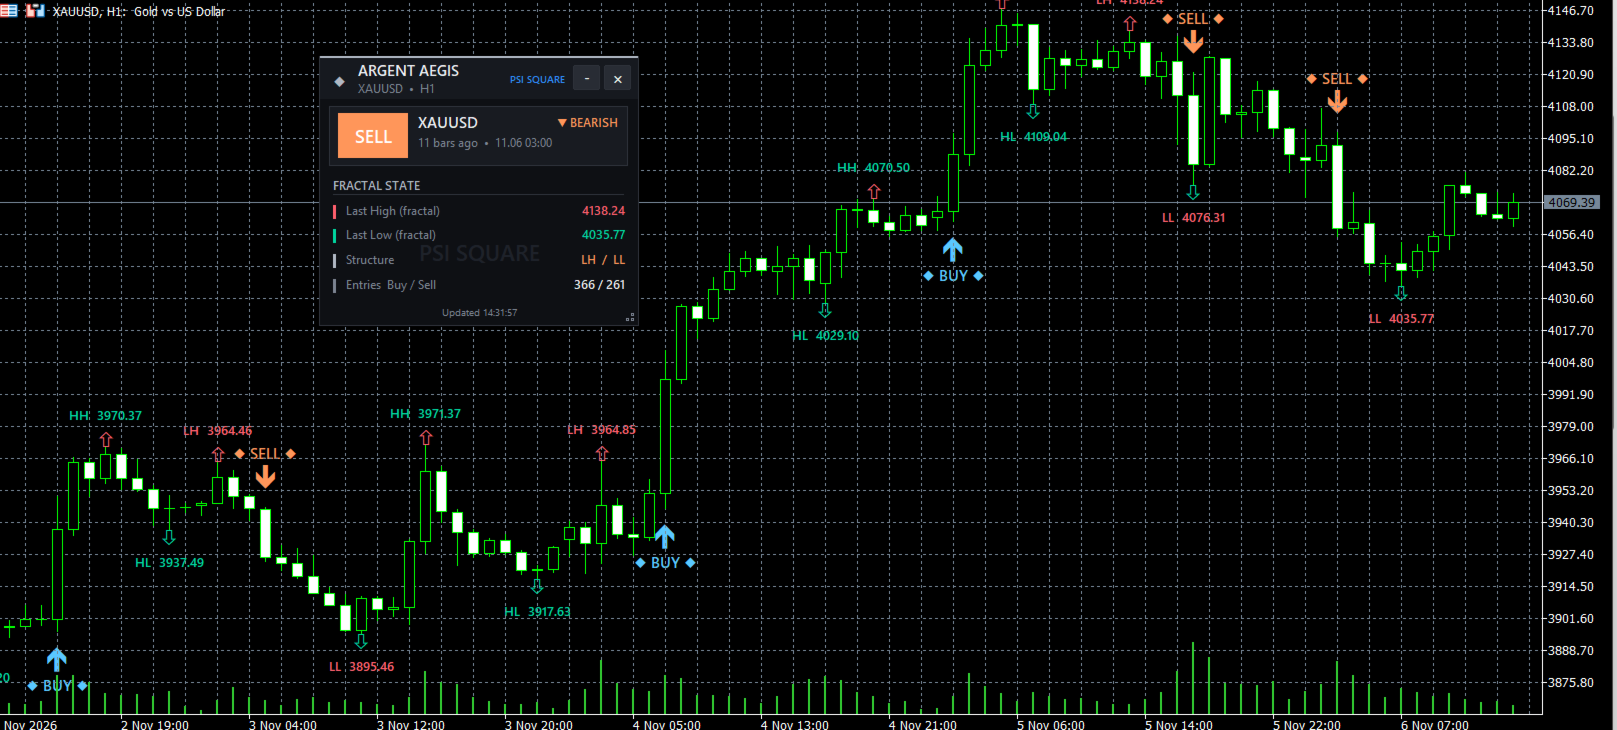
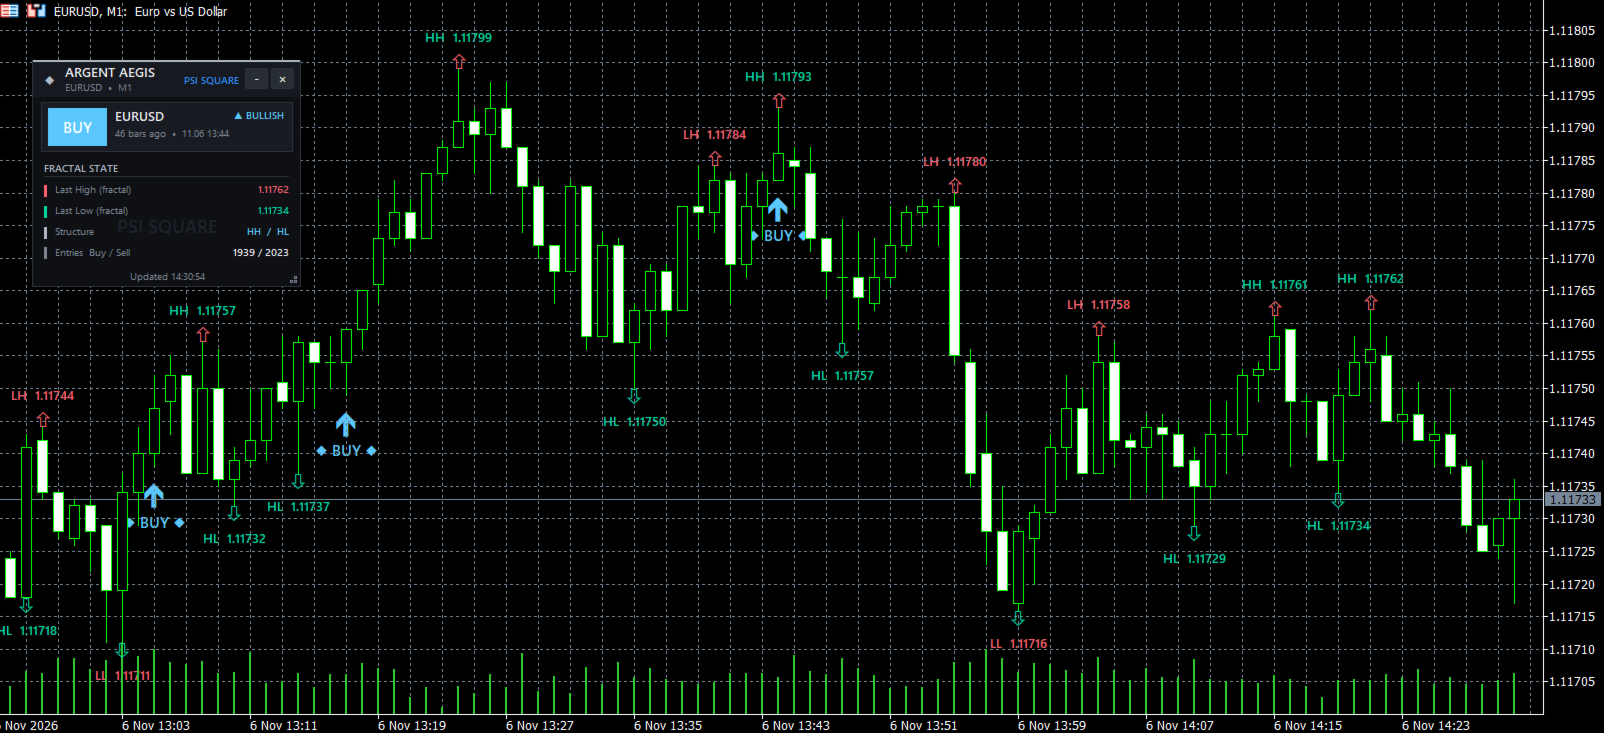
Introducing Argent Aegis, a market-structure and fractal breakout indicator that combines confirmed fractal levels with HH, HL, LH and LL analysis to identify potential BUY/SELL opportunities.

Argent Aegis identifies confirmed swing highs and lows, analyzes market structure and generates BUY signals when price closes above the latest upper fractal with higher-low confirmation, and SELL signals when price closes below the latest lower fractal with lower-high confirmation. It combines breakout confirmation, visual signals and market-structure analysis in one tool.

Key Features:

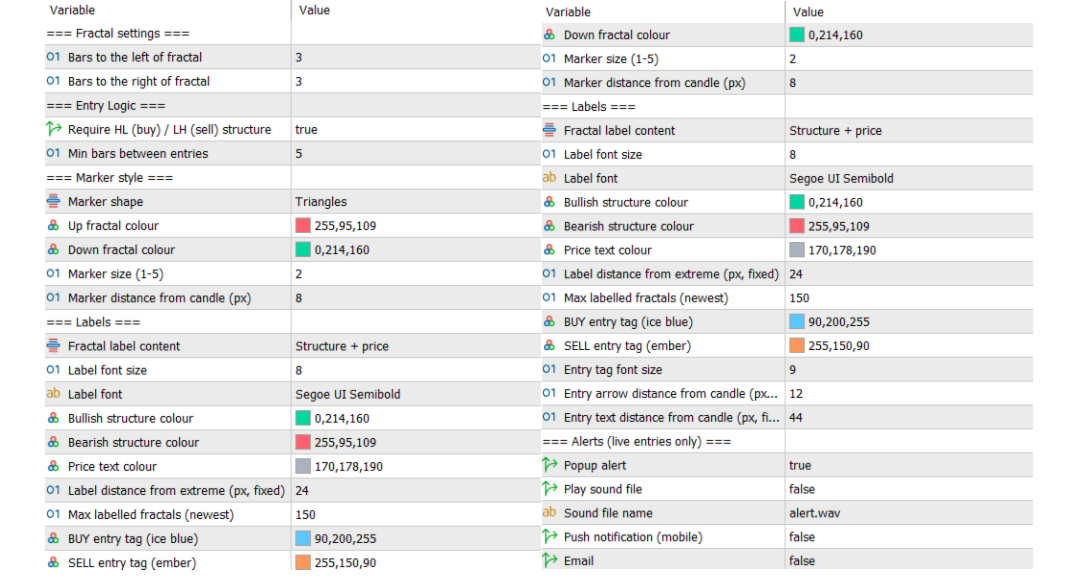
  • Confirmed Fractal Detection: Identifies swing highs and lows using configurable left-side and right-side periods.
  • Market Structure Analysis: Classifies price swings into Higher Highs (HH), Higher Lows (HL), Lower Highs (LH) and Lower Lows (LL).
  • Fractal Breakout Signals: Generates BUY/SELL signals on confirmed fractal breakouts with directional structure confirmation.
  • Structure Filter: Optionally requires higher-low confirmation for BUY entries and lower-high confirmation for SELL entries.
  • Entry Cooldown: Controls signal frequency through a configurable minimum bar interval.
  • Customizable Markers and Labels: Offers five fractal marker styles, adjustable colors, sizes, distances and structure/price labels.
  • Live Dashboard: Displays market direction, latest entries, confirmed fractal levels, market structure and BUY/SELL counts. Draggable, resizable and minimizable.
  • Customizable Alerts: Supports popup, sound, email and mobile push notifications.
  • EA Integration: Provides entry-direction, buy-price and sell-price buffers for Expert Advisor access through iCustom and CopyBuffer.

Specifications:

  • Confirmed fractal detection with configurable periods. HH, HL, LH and LL market-structure classification. Breakout-based BUY/SELL signals with optional structure filtering and entry cooldown. Customizable markers, labels, dashboard and alerts. Closed-candle signal calculations to avoid signals on the forming candle. EA-compatible signal and price buffers.
  • Argent Aegis combines fractal analysis and market-structure confirmation into one tool for identifying potential price-action trading opportunities.

Trading involves risk. Always test on a demo account first.

Contact

For questions or assistance, contact me via Private Message.


Produits recommandés
Ultimate Double Top & Bottom (Pro Volume Matrix) Stop trading retail breakouts. Start trading Institutional Traps. The   Ultimate Double Top & Bottom   is not a standard, lagging pattern scanner. It is a highly advanced, non-repainting structural engine equipped with a proprietary   3-Leg Volume Matrix . Designed exclusively for Smart Money Concepts (SMC) and order flow traders, this indicator mathematically dissects the tick volume inside M and W patterns to reveal true institutional intent:  
Fibonacci Pips MT5 Instant Fibonacci Levels, Prices and Pip Distances Fibonacci Pips MT5 is a practical Fibonacci measurement tool for MetaTrader 5. It displays each Fibonacci level together with its exact price and pip distance, helping traders plan pullbacks, profit targets and stop-loss levels without manual calculations. Instead of seeing only percentages such as 38.2%, 50.0% or 61.8%, traders can immediately understand: The Fibonacci level The exact market price The pip distance from the re
The Impulse Heatmap Indicator is an advanced volume and price distribution tool designed to help traders visualize market momentum and locate critical areas of liquidity. By analyzing volume distribution across various price levels over a specified lookback period, this indicator paints a dynamic heatmap directly on your chart, bringing hidden market mechanics into plain sight. This tool is built for traders who want to move beyond standard price action and understand where the bulk of trading
IBI Footprint affiche un footprint professionnel calculé sur les vraies transactions de la bourse : pour chaque bougie et chaque niveau de prix, combien de contrats ont été vendus et combien ont été achetés . Ce que vous voyez En haut de chaque colonne : volume (V) et delta (Δ = achats − ventes) de la bougie. À chaque prix : ventes | achats. Case plus chaude = plus de volume. Déséquilibres en diagonale mis en évidence (acheteur en bleu, vendeur en rouge). POC (prix avec le plus de volume) encadr
FREE
Emotions are a weakness. QHO mathematics is the future of your trading! You know what really truly frustrating?  Information garbage and noise. All those legacy, lagging indicators on the charts look like an attempt to steer a rocket ship with a steam engine. They are useless. They look at the past while the market is already flying forward on next-gen tech. We created QHO. This is not just another indicator. This is pure mathematics crushing market chaos right on your chart. Imagine completely
La Master Edition est un outil d'analyse de qualité professionnelle conçu pour visualiser la structure du marché à travers le prisme du volume et du flux monétaire. Contrairement aux indicateurs de volume standard, cet outil affiche un Profil de Volume Quotidien directement sur votre graphique, vous permettant de voir exactement où la découverte des prix a eu lieu et où est positionné "l'argent intelligent". Cette Master Edition est conçue pour la clarté et la rapidité, dotée d'un système unique
SimpleprobMT5
Augusto Martins Lopes
Indicateur de Probabilité Description L'Indicateur de Probabilité est un outil conçu pour les traders souhaitant identifier des opportunités d'achat et de vente en analysant les bougies précédentes. Il calcule la probabilité de hausse ( CALL ) et de baisse ( PUT ) en fonction du nombre de bougies analysées et affiche des flèches sur le graphique pour signaler les points d'entrée potentiels. Caractéristiques Analyse des bougies : Analyse un nombre configurable de bougies pour calculer les probabi
PowerMagic
Pranav Himmataughade
The Pranavtrxx ( Author ) Levels Indicator is a precision-based trading tool designed to identify key price levels in the market, helping traders make informed entry and exit decisions. This indicator automatically plots dynamic support and resistance zones derived from historical price action, psychological price levels, and recent market structure. Whether you're a day trader or swing trader, this tool offers real-time market level tracking that adjusts with price movement, helping you pinpoin
Best helping tool for Professional and Experienced traders. A best Tool To find the trend.  Instruction Manual: First Select your desired Symbol. Then attach this tool and wait till it identify the trend for you. Then it will be more feasible to trade. Once again best tool to trade. Demo version is available you can fully test its functionality. More importantly there are always trend breaks Once Trend break is observed un-attach this tool and then re-attach to get the fresh trend. Precautions:
Trend Sniper Matrix is an institutional-grade trend-riding quantitative trading terminal engineered strictly for Tier-1 multi-asset market environments. Meticulously optimized for advanced Prop Firm Evaluation Compliance and low-latency execution, this Expert Advisor integrates a high-performance bare-metal framework customized for XAUUSD (GOLD), EURUSD, GBPUSD, and USDJPY on low-latency hedging accounts. The core analytical framework leverages a dual-layered Multi-Timeframe Heiken Ashi Smooth
Add an image or logo on a chart. Parameters: "File name for On mode" - location of image file depending MQL5 folder. "Background object" - set the logo as a background object. “x”, “y” – coordinates on the chart, from which the logo shows.   If you want to delete the logo, just remove ea from the chart. The suggested resolution for the image is 200x200 pixels.   You can use this ea while recording a video.
Challenge Keeper watches your whole prop firm account and acts before a firm rule is broken. It does not open trades. It works with manual trading and with other Expert Advisors on the same account. How it works Choose your firm and your phase from a list, and enter your starting balance. Each preset already contains how that firm measures its limits: from balance or equity, from the start of the day or from the start of the challenge, and the time and time zone at which its trading day resets.
RiskManagementIndicator
Juan Camilo Meza Novoa
Risk Management Indicator trace deux lignes horizontales directement sur le graphique des prix, pour visualiser en temps réel la distance qui vous sépare de votre limite de perte. Ligne de Stop Out : indique le prix exact auquel l'equity de votre compte atteindrait 0,00 si le marché continue d'évoluer contre vous. Ligne de Drawdown personnalisée : définissez le montant en dollars que vous êtes prêt à perdre (par exemple 500 $), et l'indicateur trace le niveau de prix où cette perte serait attein
Multi-Confluence Reversal Alert | RSI + Heikin Ashi + Divergence + Key Levels | SL/TP Lines | No Repaint Confluence Reversal Alert is a professional-grade reversal detection indicator for MetaTrader 4. It combines five powerful trading concepts into a single, clean alert system — giving you high-probability reversal signals with automatically drawn Entry, Stop Loss, and Take Profit levels directly on your chart. Designed for traders who use VSA (Volume Spread Analysis), price action, and multi-
ULTRA Indicator V1
Francis Muchai Waweru
ULTRA Indicator V1 MT5 | Smart Money Concepts (SMC) + Order Block Supply & Demand Trading System Overview ULTRA Indicator V1 is a professional MetaTrader 5 (MT5) Smart Money Concepts (SMC) trading system designed to identify institutional-level market structure, liquidity zones, and high-probability reversal areas using Order Blocks and Supply & Demand analysis . This indicator integrates two powerful MQL5 Market tools: SMC Structure Markup Supply and Demand Order Blocks MT5 (OB) By combining s
Price Compression Indicator Based on Financial Volume Levels This indicator was developed to identify price compression regions associated with relevant financial volume levels , using horizontal lines on the chart to highlight areas that may present greater market interest. The system monitors price behavior within these regions, considering different possibilities such as continuation, breakouts, rejections, and potential false breakouts . Therefore, the horizontal lines represent areas for st
FREE
PatternGuard VWAP Trader — A uthor's  Smart Trading Advisor for VWAP Breakout and Pattern-Based Entries PatternGuard VWAP Trader is a professional Expert Advisor for MetaTrader 5 designed to identify trading opportunities after price exits a dynamic NO TRADE zone based on VWAP and volatility bands. The main idea of the system is simple and effective: avoid trading inside uncertain, low-quality market zones and look for entries only when price breaks out of consolidation, confirms direction with
RatioFang Harmonic Order Panel is a manual limit-order panel for MetaTrader 5. You set the entry and stop-loss lines on the chart, enter your risk in percent, and the panel calculates the lot size and sends a limit order when you press BUY or SELL. It does not trade automatically. The built-in RatioFang harmonic pattern indicator is included. With one button the panel can place the order lines at the entry and stop-loss guides of the newest detected pattern. What you can do Draw BUY / SELL limit
Visual Book for MT5
Joao Luiz Savioli Filho
This MetaTrader 5 (MT5) indicator script is designed to create a visual book representation of the market order book, displaying buy and sell orders directly on the chart. The indicator uses the following features: Customizable Width and Colors : The width of the visual book can be adjusted, and different colors can be set for buy and sell orders. Market Book Data Handling : It retrieves the current market order book data for the symbol and visualizes this data as rectangles overlaid on the char
Audible order flow, we can set a different tone for up to 12 buy order sizes and 12 other sizes for sell orders. Up to 84 musical notes are available, ie 7 octaves. The default settings have been tested in the Forex (EURUSD, GBPUSD, XAUUSD, USDJPY, USDCHF and USDMXN) and Brazilian futures (WDOFUT, DOLFUT, WINFUT and INDFUT). This tool was inspired by an interview with a visually impaired trader, as there are no tools for this type of trader and I decided to make it available for free, so the
Boleta do Bruxo
Marcio De Medeiros Vieira
GUIA RÁPIDO: BOLETA BRUXO MAPRIS ️ Configuração Inicial Obrigatória Ao arrastar a boleta para o gráfico, antes de clicar em OK, atente-se a dois detalhes: Permitir o Robô Operar: Na aba Comum , marque a caixa "Permitir Trading Algorítmico" . Certifique-se também de que o botão Trading Algorítmico no topo do seu MetaTrader 5 esteja verde . Múltiplos Gráficos (Magic Number): Na aba Parâmetros de Entrada , altere o valor de InpMagicNumber se for abrir mais de um gráfico. Exemplo: Gráfico 1 (Í
NewsOnChart
Abdelhakim El Marchoud
NewsOnChart is the ultimate MetaTrader 5 indicator that integrates a sleek, lightweight, and fully interactive economic calendar right onto your trading screen. Key Features 1-Click Interactive Dashboard: Instantly switch between major currencies (USD, EUR, GBP, JPY, AUD, CAD, CHF, NZD) with a simple click on the on-screen buttons—no need to open the indicator settings. Smart Auto-Detection: The moment you drop the indicator onto a chart, it automatically recognizes the base currency (e.g., EUR
FREE
RBM Trader Painel
Renato Brendim Medici
RBM Trade Panel - Automatic Lot Calculator and Order Management Fast execution panel for MetaTrader 5 featuring automatic dollar-based risk calculation, chart-based partial exits, one-click breakeven, and complete order management. Full Description Doing manual math or switching to external position calculators while price moves rapidly usually leads to missed entries or oversized positions. The RBM Trade Panel fixes this directly on your MetaTrader 5 chart by handling all risk calculations a
FREE
ArroX
Zahed Khodarahmi
ArroX Indicator Description ArroX is a technical analysis indicator designed for MetaTrader 5 platform. This indicator analyzes price movements and market trends to provide trading signals. Key Features: - Displays buy and sell arrows on the chart - Includes trend filtering capabilities - Provides multiple take profit levels - Shows market analysis information panel - Supports different signal sensitivity modes - Uses Bollinger Bands and moving averages for analysis - Includes stop loss calc
================================================================================ POC BREAKOUT - V20.72. Full Professional Grade Toolkit ================================================================================ POC Breakout is a full MetaTrader 5 trading dashboard for discretionary traders who want breakout signals, Point of Control (POC) context, volume profiles, order flow, market structure, news, alerts, and advanced trade planning in one professional workspace. Attached directly to you
Monster Breakout Index V2 is a clean, visual momentum indicator engineered to spot potential breakout opportunities by evaluating extreme price extensions against median historical range channels. Overview The indicator continuously monitors the median price across a configurable lookback window and compares it against current high and low extremes. When price expansion breaks out of the established median bounds, MBI V2 immediately plots distinct histogram bars in a separate window, allowing tr
ATR MultiTF PRO is a professional volatility and Volume Profile tool for MT5. It projects Daily, Weekly, and Monthly ATR expansion bands alongside institutional Volume Profile metrics (POC, VAH, VAL) on your chart to identify exhaustion, mean-reversion, and high-probability setups. MAIN FEATURES: - Multi-Timeframe ATR Bands: Plots 1D, 1W, and 1M Fibonacci-based ATR expansion zones simultaneously. - Integrated Volume Profile Filter: Tracks POC, VAH, and VAL using customizable lookback periods (
ApexForge Price Ray Marker ApexForge Price Ray Marker is a lightweight MT5 utility designed for fast and efficient price structure analysis. With a simple keyboard shortcut, you can instantly place horizontal price rays and price labels on candle highs or lows without manually drawing objects. It is ideal for Price Action traders, Smart Money Concepts (SMC), ICT methodologies, support and resistance analysis, liquidity mapping, and multi-timeframe trading. Features Shift + Left Click → Ma
FREE
Barak Mega EA
Jorge Jovanny Hernandez Maldonado
BARAK MEGA EA  is a fully automated trading Expert Advisor designed for traders who demand total control, strategic flexibility, and advanced risk management within a single system. This EA functions as a true strategy builder , allowing you to combine multiple technical indicators and custom rules to adapt to any market, asset, or timeframe. Unlike traditional robots with fixed logic, BARAK MEGA EA features a modular architecture where every component can be independently enabled, disabled, and
FREE
Elevate Your Trading Experience with the famous UT Bot Alert Indicator! Summary: The UT Bot Alert Indicator by Quant Nomad has a proven track record and is your gateway to a more profitable trading journey. It's a meticulously crafted tool designed to provide precision, real-time insights, and a user-friendly experience.  Key Features: 1. Precision Analysis: Powered by advanced algorithms for accurate trend identification, pinpointing critical support and resistance levels. 2. Real-time Alert
Les acheteurs de ce produit ont également acheté
Trend Sniper X
Sarvarbek Abduvoxobov
4.86 (44)
Trend Sniper X est un indicateur de suivi de tendance multi-unités de temps pour MetaTrader 5 qui aide les traders à identifier la direction de la tendance et les points d'inversion potentiels avec clarté et précision. pour MT4: https://www.mql5.com/en/market/product/193245 Informations sur le prix : Le prix actuel est un prix promotionnel et est susceptible de changer lors des prochaines mises à jour et nouvelles fonctionnalités. Offre bonus : Pour obtenir GRATUITEMENT l'Auto-Trade Assistant E
Gann Made Easy   est un système de trading Forex professionnel et facile à utiliser qui est basé sur les meilleurs principes de trading en utilisant la théorie de mr. WD Gann. L'indicateur fournit des signaux d'ACHAT et de VENTE précis, y compris les niveaux Stop Loss et Take Profit. Vous pouvez échanger même en déplacement en utilisant les notifications PUSH. VEUILLEZ ME CONTACTER APRÈS L'ACHAT POUR RECEVOIR GRATUITEMENT DES INSTRUCTIONS DE TRADING ET D'EXCELLENTS INDICATEURS SUPPLÉMENTAIRES! V
Entry Points Pro vous montre où entrer, où placer le stop et avec quel lot trader — avant que vous ne passiez l'ordre. PRIX Actuellement 149 USD, et c'est le dernier exemplaire à ce prix. Ensuite, le prix passe à 199 USD, et le prix final est de 349 USD. Je gagne ma vie en tradant sur les marchés, et je le montre, donc je n'ai pas besoin de vendre cet indicateur à tout le monde. C'est un outil pour les traders qui réfléchissent par eux-mêmes, pas un bouton magique. La flèche apparaît à la clôtu
Ultra Indicator
Ihor Otkydach
5 (1)
ULTRA est un indicateur technique « tout-en-un » : il analyse le marché de manière autonome, génère des signaux de trading, affiche les niveaux permettant de définir des ordres stop-loss et suggère le moment opportun pour clôturer les positions afin de sécuriser les bénéfices ou de minimiser les pertes. En d'autres termes, peu importe que vous ne sachiez pas analyser le marché, déterminer les niveaux (où placer votre stop-loss) ou que vous ayez du mal à gérer votre capital. ULTRA s'occupera de t
M1 Sniper MT5
Oleg Rodin
5 (7)
M1 SNIPER   est un système d'indicateurs de trading facile à utiliser. Il s'agit d'un indicateur à flèche conçu pour l'unité de temps M1. Cet indicateur peut être utilisé seul pour le scalping sur l'unité de temps M1 ou intégré à votre système de trading existant. Bien que conçu spécifiquement pour le trading sur l'unité de temps M1, ce système peut également être utilisé avec d'autres unités de temps. Initialement, j'avais conçu cette méthode pour le trading du XAUUSD et du BTCUSD. Cependant, j
Adaptive Price Action Engine Achetez un indicateur, obtenez l'EA gratuitement Analyse auto-optimisée des tendances et des figures de chandeliers Multi-Timeframe Les marchés évoluent constamment, et tous les modèles de Price Action n’ont pas la même valeur dans toutes les conditions de marché. Adaptive Price Action Engine a été conçu pour s’adapter aux changements du marché en combinant structure de tendance, analyse Multi-Timeframe, figures de chandeliers et optimisation statistique au sein d’un
FiboSniper Pro
Van Minh Nguyen
5 (4)
FiboSniper Pro – Multi-Filter Fibonacci System with Auto SL/TP and Control Panel FiboSniper Pro est un indicateur technique qui combine des Fibonacci Envelopes dynamiques avec plusieurs filtres de confirmation afin de générer des signaux Buy et Sell sélectionnés. Les niveaux de Fibonacci sont calculés à partir de Moving Average et ATR, puis filtrés par ADX, EMA, RSI, ATR, Volume, Time et la structure des bougies. L’indicateur affiche directement sur le graphique les niveaux automatiques de Stop
Auto Optimized SpeedAngle est un système de vectorisation du momentum de niveau institutionnel qui élimine l'ajustement de courbe ( curve-fitting ) grâce à une optimisation continue par avancement ( Walk-Forward Optimization , WFO). Plutôt que de s'appuyer sur des entrées statiques qui se dégradent lorsque les régimes de marché changent, l'indicateur recalibre dynamiquement ses paramètres en utilisant une validation hors échantillon ( Out-of-Sample , OOS), garantissant ainsi que les signaux affi
ARICoins
Temirlan Kdyrkhan
ARICoin is a powerful trading companion designed to generate high-probability entry signals with dynamic TP/SL/DP levels based on volatility. Built-in performance tracking shows win/loss stats, PP1/PP2 hits, and success rates all updated live. Key Features: Buy/Sell signals with adaptive volatility bands Real-time TP/SL/DP levels based on ATR Built-in MA Filter with optional ATR/StdDev volatility Performance stats panel (Success, Profit/Loss, PP1/PP2) Alerts via popup, sound, push, or email Cust
Boba Analysis Suite
Trade Ready Solutions LLC
5 (2)
Boba Analysis Suite Boba Analysis Suite est un indicateur d’analyse pour MetaTrader 5. Il réunit la structure du marché, les zones de prix pertinentes et le contexte général du marché dans une même vue graphique. Développé à partir de l’expérience pratique d’un trader et formateur en trading, il accompagne une démarche d’analyse structurée : évaluer la direction du marché, identifier les niveaux importants et analyser plusieurs unités de temps conjointement. Une analyse en contexte La significat
ScalpPoint
Temirlan Kdyrkhan
ScalpPoint is a powerful trading companion designed to generate high-probability entry signals with dynamic TP/SL/DP levels based on volatility. Built-in performance tracking shows win/loss stats, PP1/PP2 hits, and success rates — all updated live. Key Features: Buy/Sell signals with adaptive volatility bands Real-time TP/SL/DP levels based on ATR Built-in MA Filter with optional ATR/StdDev volatility Performance stats panel (Success, Profit/Loss, PP1/PP2) Alerts via popup, sound, push, or emai
Scalper Vault est un système de trading puissant et complet, conçu pour les traders en quête de régularité dans le cadre du trading intrajournalier. Cet indicateur de haute précision constitue un système de trading autonome et exhaustif, offrant des analyses de qualité institutionnelle, aussi bien pour le Forex que pour les options binaires. VEUILLEZ ME CONTACTER APRÈS VOTRE ACHAT POUR OBTENIR MES CONSEILS DE TRADING AINSI QU'UN EXCELLENT BONUS ! En éliminant les incertitudes et les analyses man
Apex Patterns PRO Achetez l'indicateur - Obtenez GRATUITEMENT l'Expert Advisor basé sur celui-ci. Intelligence auto-optimisée des figures chartistes et des cassures Les scanners de figures traditionnels s'appuient sur des paramètres fixes, sous-performant souvent lorsque la volatilité et les structures du marché changent. Apex Patterns PRO est conçu pour s'adapter aux conditions changeantes du marché en combinant la reconnaissance des figures chartistes structurelles, le filtrage du momentum et
Volatility Master for MetaTrader is a real-time dashboard tool that scans up to  50 symbols  to identify high-volatility , trending markets instantly. With bullish/bearish signals, customizable alerts, and a user-friendly interface, it helps you avoid range-bound conditions and focus on high-probability trades. Clarity leads to confidence. Trade confidently and protect your capital effectively with this powerful dashboard. We don't offer free or bonus indicators in exchange of reviews from you.
SIO Oscillator : oscillateur auto-optimisé de déséquilibre de semi-variance Achetez l’indicateur et recevez GRATUITEMENT l’Expert Advisor (EA) basé sur celui-ci. La plupart des oscillateurs traitent tous les mouvements de prix de la même manière. SIO sépare la pression haussière de la pression baissière et mesure le déséquilibre entre les deux, montrant quel camp contrôle réellement le marché : les acheteurs ou les vendeurs. Lorsque le déséquilibre atteint un extrême, SIO génère un signal clair
Indicateur de force et de momentum multi-devises MT5 Dynamic Forex28 Navigator est l'évolution de nos indicateurs populaires de longue date et réunit la puissance de trois outils en un : Advanced Currency Strength28 Indicator (700 avis) Advanced Currency IMPULSE with ALERT (530 avis) CS28 Combo Signals (bonus actuel) Les deux indicateurs précédents totalisent plus de 1 200 avis sur le MQL5 Market et font partie des outils incontournables de la communauté MT4 depuis 2016. Dynamic Forex28 Navigato
Neuro Poseidon MT5
Daria Rezueva
4.68 (53)
Neuro Poseidon is a new indicator by Daria Rezueva. It combines precise trading signals with adaptive TP/SL levels - creating best possible trades as a result! Message me and get  Neuro Poseidon Assistant  as a gift to automize your trading process! What makes it stand out? 1. Proven profitability on all assets and timeframes 2. Only confirmed BUY and SELL signals present on the chart 3. Adaptive TP & SL levels generated by the software for each trade 4. Easy to understand - suitable for al
AriFocus
Temirlan Kdyrkhan
AriFocus - Non-Repainting Buy/Sell Signals AriFocus - one clear signal. AriFocus marks buy and sell signals directly on the chart and suggests a stop-loss level for each one. Every signal is confirmed on bar close and never repaints. - Buy/sell arrows, confirmed on bar close - Suggested stop-loss level for every signal - Trend band and candle coloring to show direction at a glance - 10 ready-made presets, or your own settings (14 calculation methods) - Pop-up, push and email alerts with entr
Currency Strength Wizard   est un indicateur très puissant qui vous offre une solution tout-en-un pour un trading réussi. L'indicateur calcule la puissance de telle ou telle paire de devises en utilisant les données de toutes les devises sur plusieurs périodes. Ces données sont représentées sous la forme d'un indice de devise facile à utiliser et de lignes électriques de devise que vous pouvez utiliser pour voir la puissance de telle ou telle devise. Tout ce dont vous avez besoin est d'attacher
Advance AI Scanner
Mohamed Samsudeen
5 (1)
Advance AI Scanner is a multi-symbol analysis indicator for MetaTrader 5. It scans Forex pairs, metals, energy, stock indices and cryptocurrencies at the same time and rates each instrument with its own self-training model. It explains in plain English what moved each market and why, and it estimates how far upcoming economic news usually moves each symbol, measured on your broker's own price history. $199 instead of $499. 10 copies left at this price. One time purchase  Installation and User
Azimuth Pro
Ottaviano De Cicco
5 (7)
Azimuth Pro V2: Synthetic Fractal Structure and Confirmed Entries for MT5 Overview Azimuth Pro is a multi-level swing structure indicator by Merkava Labs . Four nested swing layers, swing-anchored VWAP, ABC pattern detection, three-timeframe structural filtering, and closed-bar confirmed entries — one chart, one workflow from micro-swings to macro-cycles. This is not a blind signal product. It is a structure-first workflow for traders who care about location, context, and timing. Halloween P
SkyHammer Signal Pro Indicateur professionnel de signaux de tendance sans repaint, avec niveaux Entry, SL et TP verrouillés SkyHammer Signal Pro est un indicateur de tendance et de momentum structuré, conçu pour les traders qui recherchent des signaux clairs, fixes et vérifiables. Il fonctionne le mieux sur les timeframes courts, comme M1 et M5 . L’indicateur ne cherche pas à prédire les sommets ou les creux du marché. Il attend plutôt une structure de marché confirmée, une direction de tendance
Bill Williams Advanced
Siarhei Vashchylka
5 (11)
Bill Williams Advanced is designed for automatic chart analysis using Bill Williams' "Profitunity" system. The indicator analyzes four timeframes at once. Manual (Be sure to read before purchasing) Advantages 1. Analyzes the chart using Bill Williams' "Profitunity" system. Signals are displayed in a table in the corner of the screen and on the price chart. 2. Finds all known AO and AC signals, as well as zone signals. Equipped with a trend filter based on the Alligator. 3. Finds "Divergence Bar
Power Candles MT5
Daniel Stein
4.58 (12)
Power Candles V3 - Indicateur de force à optimisation automatique Power Candles V3 transforme la force des devises et des instruments en un plan de trading exploitable sur chaque graphique auquel il est associé. Au lieu de se contenter de colorer les bougies, il effectue une optimisation automatique en temps réel en arrière-plan et vous fournit les meilleurs niveaux de Stop Loss, Take Profit et seuils de signal pour le symbole que vous avez sous les yeux. Un simple clic suffit pour l'adopter en
Apollo SR Master est un indicateur de support/résistance doté de fonctionnalités spéciales qui simplifient et fiabilisent le trading basé sur les zones de support/résistance. Cet indicateur calcule ces zones en temps réel, sans aucun décalage, en détectant les sommets et les creux locaux des prix. Pour confirmer la nouvelle zone de support/résistance, il affiche un signal spécifique indiquant que cette zone peut être prise en compte et utilisée comme un véritable signal d'achat ou de vente. Dans
Murrey Math Classic
Sarvarbek Abduvoxobov
5 (2)
Murrey Math Classic Murrey Math Classic est un indicateur de trading professionnel et dynamique conçu pour prédire les mouvements de prix sur les marchés financiers mit avec une précision mathématique. Le système modernise la légendaire géométrie prix-temps, la transformant en un modèle mathématique hautement structuré adapté aux marchés financiers modernes. La logique fondamentale de Murrey Math est que les marchés financiers ne se déplacent pas de manière aléatoire ; ils évoluent selon un ryth
Divergence Bomber
Ihor Otkydach
4.89 (94)
Chaque acheteur de cet indicateur reçoit également gratuitement : L’outil exclusif « Bomber Utility », qui accompagne automatiquement chaque opération de trading, fixe les niveaux de Stop Loss et de Take Profit, et clôture les positions selon les règles de la stratégie Des fichiers de configuration (set files) pour adapter l’indicateur à différents actifs Des set files pour configurer le Bomber Utility selon différents modes : « Risque Minimum », « Risque Équilibré » et « Stratégie d’Attente »
Superhero
Ihor Otkydach
5 (3)
L'indicateur SUPERHERO est un système de trading multidevises conçu selon un principe « tout compris ». Cet indicateur analyse le marché de manière autonome et fournit des signaux indiquant quand ouvrir et clôturer des positions. Il utilise des ordres Stop Loss et Take Profit. Le rapport R:R est de 1:1. Ce système peut envoyer des notifications push sur votre smartphone, ce qui vous permet de passer des ordres « où que vous soyez », sans avoir à rester devant un ordinateur. C'est la solution idé
TREND LINES PRO     Cet indicateur permet de comprendre les véritables changements de direction du marché. Il révèle les renversements de tendance et les points de retour des principaux acteurs. Tu vois     Lignes BOS     Détection des changements de tendance et des niveaux clés sur des unités de temps supérieures, sans paramètres complexes ni interférences inutiles. Les signaux restent affichés sur le graphique même après la fermeture de la bougie. VERSION MT 4    -     Révèle son potentiel max
FootPrint Chart MT5
Gayathiri Gopalakrishnan
5 (1)
Turn every candle into a bid x ask footprint built from real tick data. See who is actually trading at each price, with delta, volume profile, imbalance zones and a scored setup engine that prints entry, stop and target Order Flow Footprint Chart Pro Most indicators tell you what price did. This one tells you who did it. Order Flow Footprint Chart Pro rebuilds every candle on your chart from raw tick data and shows you the volume that traded at each individual price inside it, split into the am
Plus de l'auteur
Meridian Signal
Muhammad Okasha Razaq
Introducing Meridian Signal, a trend-following signal indicator that turns every trend reversal into a clear, ready-to-use trade plan. Meridian tracks the market's direction with an adaptive trend line built from price channels, short moving averages, and ATR volatility. When the trend reverses, it marks the signal on your chart and instantly calculates your Entry, Stop Loss, and Take Profit. Everything you need to plan a trade is in one place, helping you spend less time analyzing and more tim
Obsidian Trend
Muhammad Okasha Razaq
Obsidian Trend: Trend Reversal Signals with a Live Dashboard Obsidian Trend is a trend-following indicator that displays the market's direction as a single step-style trend line. When the trend reverses, it marks the change with an arrow and a BUY/SELL tag displaying the signal price. A live dashboard panel on the chart shows the current trend, the latest signal, and how price has moved since the signal appeared. The trend line follows the market using recent highs and lows over an adjustable A
Helix Ribbon
Muhammad Okasha Razaq
Introducing Helix Ribbon, a trend-following ribbon indicator that turns every trend crossover into a clear, ready-to-read signal. Helix tracks the market's direction with two moving averages: a fast Triple Exponential Moving Average (TEMA) and a slow Hull Moving Average. The space between them is drawn as a flowing, color-shifting ribbon with thin strands inside it. When the fast line crosses the slow line, the ribbon twists and Helix marks the new trend on your chart with an arrow and a BUY/SEL
Vantage Bands
Muhammad Okasha Razaq
Introducing Vantage Bands, a multi-layer trend indicator that combines a Natural Moving Average, an anchored VWAP, a Bollinger cloud and a Kalman-smoothed Hull crossover into one clean chart overlay. Vantage reads the market in layers. The Natural Moving Average (NMA) shows the main trend and changes color with its slope. The anchored VWAP shows where the session's volume-weighted price sits. The Bollinger cloud shows how stretched price is. Two Kalman-filtered Hull lines, a Hull Trend line and
Zygos TDI
Muhammad Okasha Razaq
Introducing Zygos TDI, a Traders Dynamic Index indicator that turns RSI momentum, volatility and trend into one clear, ready-to-read window. Zygos builds on the classic TDI idea. It smooths the RSI into a fast price line and a slower signal line, then wraps them in volatility bands and a colour-changing baseline. When the price line crosses the signal line, Zygos marks the exact bar with an arrow. The bands show how stretched the market is, the baseline shows which way momentum is leaning, and t
Themis SMC
Muhammad Okasha Razaq
Introducing Themis SMC, a Smart Money Concepts indicator that puts market structure, order blocks, liquidity, fair value gaps, premium and discount zones and rule-based entry signals on one clean chart overlay. Themis reads the market in layers. Internal and swing structure show every Break of Structure (BOS) and Change of Character (CHoCH). Order blocks mark the zones where price is likely to react. Equal highs and lows show resting liquidity. Fair value gaps show imbalance. The premium and di
Nova Exhaustion
Muhammad Okasha Razaq
Introducing Nova Exhaustion , a trend exhaustion indicator that finds the bar where a move runs out of steam. It combines a 9-count setup, a filled SuperTrend and automatic support and resistance levels, all on one clean chart overlay. Nova Exhaustion counts consecutive closes against the close four bars earlier. Nine closes in a row below it mark selling exhaustion and a BUY. Nine closes in a row above it mark buying exhaustion and a SELL. The counts at 7 and 8 warn you early that a 9 is close.
Vortex Anchor
Muhammad Okasha Razaq
Introducing Vortex Anchor , a multi-level market structure and Anchored VWAP indicator that brings swing analysis, trend bias, key price levels and entry signals together in one chart. Vortex Anchor tracks market structure through four independent ZigZag swing levels, each designed to highlight a different degree of price movement. From small local swings to major structural turning points, every level has its own marker, making it easier to distinguish short-term movements from broader market d
Axiom RSI
Muhammad Okasha Razaq
Introducing Axiom RSI , a momentum and trend analysis indicator that combines advanced RSI calculations, moving-average trend detection, a color-coded histogram and rule-based BUY/SELL signals in one integrated indicator. Axiom RSI combines RSI momentum with fast and slow moving-average channels to identify bullish, bearish and neutral market conditions. It offers multiple RSI calculation methods and customizable trend filters to adapt the analysis to different trading approaches. When the sele
Trinity Nexus
Muhammad Okasha Razaq
Introducing Trinity Nexus , a multi-indicator trend analysis tool that combines Flux, Core Trend, Pulse, and Anchor to identify market direction and generate aligned BUY/SELL signals. Trinity Nexus evaluates the selected indicators together, generating signals when all enabled components agree on market direction. It also offers configurable signal modes, trend-strength analysis, and an interactive dashboard for monitoring market conditions. Key Features: Four Indicator Components: Combines Flu
Lumen Trend
Muhammad Okasha Razaq
Introducing Lumen Trend , a multi-component trend analysis indicator that combines MACD momentum, RSI conditions, Wave Trend confirmation, and moving-average trend detection to identify potential BUY and SELL opportunities. Lumen Trend uses three configurable trend meters alongside two additional moving-average trend bars to assess market direction. When all three primary meters align, the indicator generates a potential BUY or SELL signal, with optional Wave Trend crossover confirmation to refi
Helios Flux
Muhammad Okasha Razaq
Introducing Helios Flux , a SuperTrend-based trend analysis and trading signal indicator that combines ATR bands, EMA bias, RSI momentum and candle confirmation to identify potential trend reversals and pullback opportunities. Helios Flux detects trend changes using an ATR-based SuperTrend engine and applies optional EMA, RSI and candle filters to validate entries. It also supports pullback re-entry signals, BUY/SELL markers, trade plan previews, customizable alerts and an interactive dashboard.
Kestrel Trail
Muhammad Okasha Razaq
Introducing Kestrel Trail , a SuperTrend-based trend-following indicator that combines ATR trailing levels with optional RSI, ADX and EMA filters to identify potential BUY/SELL opportunities. Kestrel Trail uses ATR-based calculations to establish dynamic trailing levels and detects trend reversals when price crosses the trail. Optional confirmation filters help validate entries through momentum, trend strength and EMA direction, providing a structured approach to trend analysis. Key Features: Dy
Halcyon Channel
Muhammad Okasha Razaq
Introducing Halcyon Channel , a Keltner Channel-based trend and trading signal indicator that combines EMA, ATR bands and optional RSI confirmation to identify potential BUY/SELL opportunities. Halcyon Channel builds dynamic price channels using an EMA basis and ATR-based upper and lower bands. It offers three entry modes: Breakout, Basis Cross and Band Re-entry, with optional RSI confirmation to validate signals. A trend-coloured basis, chart markers, live dashboard and customizable alerts prov
Eclipse Valkyrie
Muhammad Okasha Razaq
Introducing Eclipse Valkyrie , a relative volume and momentum-based trading indicator that combines RVOL analysis, EMA trend confirmation and price breakouts to identify potential BUY/SELL opportunities. Eclipse Valkyrie compares current volume against historical averages to classify market activity as Surge, Normal or Dormant. It combines EMA alignment, candle strength, breakout confirmation and minimum relative volume requirements to identify potential entries, supported by clear chart signal
Ambrosia Pulse
Muhammad Okasha Razaq
Introducing Ambrosia Pulse , a momentum-based trading indicator that combines momentum strength and PPO confirmation to identify potential BUY/SELL opportunities. Ambrosia Pulse analyzes market momentum using a configurable momentum oscillator and PPO histogram, generating signals when both align and momentum strengthens. With clear chart labels, a live dashboard and customizable alerts, it provides a structured approach to identifying potential market entries. Key Features: Momentum Analysis:  
Moira Threads
Muhammad Okasha Razaq
Introducing Moira Threads, a multi-factor trend analysis indicator that combines multiple market indicators to identify market direction, measure trend strength and detect potential trading opportunities. Moira evaluates market conditions using RSI, multi-timeframe EMA alignment, Bollinger Bands and relative strength against a configurable benchmark. These components contribute to a weighted score ranging from -100 to +100, which is used to determine the current trend state and generate trading
DynaRatchet
Muhammad Okasha Razaq
DynaRatchet is an automated trading tool that locks in your profits while giving your trades room to breathe. Much like a mechanical ratchet that only turns one way, this tool moves your safety floor forward as the market goes in your favor, but completely locks in place during temporary pullbacks. This removes the guesswork and emotion from deciding exactly when to exit a trade. Instead of using a rigid, fixed distance, it automatically studies the market's current speed. It widens during wild
Filtrer:
Aucun avis
Répondre à l'avis