ULTRA Indicator V1

ULTRA Indicator V1 MT5 | Smart Money Concepts (SMC) + Order Block Supply & Demand Trading System

Overview

ULTRA Indicator V1 is a professional MetaTrader 5 (MT5) Smart Money Concepts (SMC) trading system designed to identify institutional-level market structure, liquidity zones, and high-probability reversal areas using Order Blocks and Supply & Demand analysis.

This indicator integrates two powerful MQL5 Market tools:

  • SMC Structure Markup
  • Supply and Demand Order Blocks MT5 (OB)

By combining structure + liquidity + confirmation signals, ULTRA Indicator V1 provides a complete rule-based trading framework for forex traders who want to trade like institutions rather than retail traders.

Key Concept Behind ULTRA Indicator V1

The system is built on institutional trading logic:

  • Markets move in structured phases (accumulation, manipulation, distribution)
  • Price reacts to liquidity zones (Order Blocks)
  • High-probability trades occur when structure and liquidity align

ULTRA Indicator V1 filters market noise and focuses only on high-quality institutional setups.

Core Components

1. Smart Money Concepts (SMC) Structure Engine

  • Automatically maps market structure in real-time
  • Identifies swing highs and swing lows
  • Detects Break of Structure (BOS)
  • Defines bullish or bearish market bias
  • Highlights active trading range for precision planning

2. Supply & Demand Order Block System (MT5)

Powered by the Supply and Demand Order Blocks MT5 (OB) indicator:

  • Detects institutional Order Blocks (OBs)
  • Separates:
    • 🔵 Decisional Order Blocks (trend-shifting zones)
    • 🔴 Extreme Order Blocks (liquidity extremes)
  • Highlights high-probability reversal and continuation zones
  • Maps key institutional supply and demand areas

3. ULTRA Signal Confirmation Engine

  • Provides entry confirmation after structure + OB alignment
  • Eliminates premature entries
  • Confirms timing only when price interacts with valid zones
  • Designed for precision execution, not prediction
Trading Methodology (Step-by-Step Strategy)

Step 1: Market Structure Analysis (SMC)

Use the SMC Structure Markup to:

  • Identify market trend direction
  • Mark swing structure
  • Define the active trading range

Step 2: Order Block Mapping

Using Supply and Demand OB tool:

  • Identify Decisional Order Blocks
  • Identify Extreme Order Blocks
  • Mark all institutional liquidity zones

Step 3: Wait for Price Reaction

Do not enter early.

Wait for price to:

  • Return into a valid Order Block zone
  • Re-enter institutional liquidity area

Step 4: ULTRA Signal Confirmation

Only execute when:

  • Price is inside OB zone
  • SMC structure supports direction
  • ULTRA signal confirms entry

Step 5: Entry Execution

  • Enter at the exact price provided by the indicator
  • Set Stop Loss slightly beyond invalidation level
  • Avoid widening SL unnecessarily

Step 6: Take Profit Strategy

  • Set Take Profit at nearest:
    • Swing high (for sell setups)
    • Swing low (for buy setups)
  • Based strictly on market structure, not fixed RR
Key Features

✔ Smart Money Concepts (SMC) structure detection
✔ Automated Break of Structure (BOS) identification
✔ Institutional Order Block detection (Decisional + Extreme)
✔ Supply and Demand zone mapping
✔ High-probability signal confirmation system
✔ Precise entry price guidance
✔ Structure-based take profit targeting
✔ Clean, rule-based trading workflow
✔ Works on all MT5 trading instruments

Trading Strategy Philosophy

ULTRA Indicator V1 is built for traders who want to move beyond indicators that "predict" price.

Instead, it focuses on:

  • Liquidity-driven price movement
  • Institutional footprint (Order Blocks)
  • Market structure confirmation (SMC)
  • Timing precision through signal validation

This creates a non-discretionary trading framework where every trade is based on structured logic.

Ideal For
  • Smart Money Concepts (SMC) traders
  • Institutional-style forex traders
  • Intraday traders (M15, M30, H1)
  • Swing traders (H4, Daily)
  • Traders using Order Block strategies
  • Traders seeking rule-based entry systems
Advantages Over Traditional Indicators

Unlike standard MT5 indicators, ULTRA Indicator V1:

  • Does NOT rely on lagging signals alone
  • Does NOT generate random arrows
  • Does NOT trade without structure context

Instead, it combines:

  • Structure + Liquidity + Confirmation = Precision Entry System
How to Use Effectively

For best results:

  • Trade only when structure and OB align
  • Avoid trading against market bias
  • Wait for ULTRA confirmation signal
  • Always respect swing-based targets
  • Do not force trades in low liquidity zones
FAQ

What is an Order Block in trading?

An Order Block is a zone where institutional traders place large orders, causing strong market reversals or continuations.

Does this indicator repaint?

No. Signals are based on confirmed structure and completed price action conditions.

Can it be used for scalping?

Yes, but it performs best in intraday and swing trading conditions.

What markets does it support?

All MT5 instruments including forex, indices, gold, and crypto.

Do I need SMC knowledge?

Basic understanding helps, but the indicator visually maps structure and zones automatically.

Final Summary

ULTRA Indicator V1 MT5 is a complete Smart Money Concepts trading system that merges:

  • Market structure intelligence (SMC)
  • Institutional liquidity zones (Order Blocks)
  • Precise signal confirmation

It is designed for traders who want structured, rule-based, high-probability entries instead of emotional or indicator-heavy trading.

推荐产品
Volume flow Profile
Israr Hussain Shah
大师版是一款专业级的分析工具,旨在通过成交量和资金流向的视角来可视化市场结构。与标准的成交量指标不同,该工具直接在图表上显示每日成交量分布,让您准确看到价格发现发生的位置以及“聪明钱”的定位。 此大师版专为清晰度和速度而设计,具有独特的自动主题同步系统,加载后即刻美化您的图表布局。 主要特点: 真实资金流向计算: 超越标准的跳动量。启用“Use Money Flow”时,成交量按价格加权,揭示了特定价格水平的实际资金投入。 价值区域 (VA) 可视化: 自动计算价值区域(默认为成交量的70%)。 VA填充: 为价值区域背景着色,以便即时识别控制区域。 关键水平: 清晰标记控制点 (POC)、价值区域高点 (VAH) 和价值区域低点 (VAL)。 专业标记系统: 扫描概况结构以识别关键交易区域: HVN (高成交量节点): 接受和盘整区域(支撑/阻力)。 LVN (低成交量节点): 拒绝区域或“快速通过”区域。 所有标记均向右绘制延长线,便于监控。 Delta 背离(左侧直方图): 左侧直方图可视化每个级别的买卖压力对比。这有助于识别隐藏的背离——即价格可能上涨,但卖家在这些水平上激进打
FVG Concept and Market Structure (MS) Indicator – Comprehensive Analysis with Interactive Control This is not just an indicator. It is a useful tool for market analysis. This indicator combines several analytical functions, making it one of the more complete solutions in its field. This tool represents a comprehensive solution for analyzing market behavior with the goal of forecasting the direction of price movement. The indicator is designed to assist the trader and not distract them with unnec
FREE
The indicator for trading on the signals of the harmonic pattern AB=CD. It gives signals and shows the levels of entry into the market, as well as levels for placing stop orders, which allows the trader to make timely decisions on entering the market, as well as effectively manage positions and orders. It supports sending push notifications to a mobile device, e-mail, as well as alerts. This indicator has been ported from the version for MetaTrader 4. For more information, as well as a detailed
RGT Cluster Footprint 显示 每根K线内部 发生了什么:每个价格成交了多少量、谁更主动(买方或卖方),以及市场可能在哪里反应。一个指标,一张图,终身许可。 主要功能 5种视图(一键切换) :CLASSIC、PRO、BOX、BID x ASK 足迹图,以及新的 WICK 模式:实体为绿/红色,上影线拒绝为橙色,下影线拒绝为紫色,POC 为蓝色,强拒绝带白框。 每根K线的 POC、对角失衡(imbalance)以及 3 级以上的堆叠失衡支撑/阻力区。 吸收区与大额单边成交气泡。 成交量分布(日、周或多日)含 POC、VAH、VAL;时段 VWAP 及 ±1/±2 标准差带。 前一日 POC / VAH / VAL / 高点 / 低点,裸 POC 与未完成拍卖作为价格目标。 每根K线下方显示 Delta,下方面板显示 Delta 与 CVD(按日或按时段重置)。 亚洲 / 伦敦 / 纽约时段及亚洲波动提醒。 BUY/SELL 信号及自动交易计划:入场、止损、TP1、TP2 与风险回报比。 Setup Lab :在您自己的品种和周期上,扣除点差后衡量 5 种订单流形态的结果
供需量能区域 — 机构级支撑/阻力区与多空力量分析 Supply Demand Volume 是一款精密工具,能基于价格结构、成交量分析与实时波动,自动识别关键的供需区域。专为依赖精准支撑阻力位、供需订单流、Wyckoff逻辑或Smart Money概念的交易者设计,该指标提供增强的洞察力,展示多空力量对比,并标记潜在反转信号。 核心功能: 自动区域识别 – 基于历史高低点和平均真实波动范围(ATR),定位关键机构成交量支撑与阻力区域。 多空成交量分析 – 实时展示买方与卖方的力量对比,帮助确认交易方向。   中线与价格标签 – 提供中间区域引导,支持自定义颜色与价格水平标记。 时间延展功能 – 区域自动延伸到未来,保持长期参考价值而无需重绘。 适合人群: 反转交易者 突破交易者 成交量/价格行为交易者 剥头皮 & 日内交易者 如果买盘量大于卖盘量,价格很可能突破供给区上方。如果卖盘量大于买盘量,价格可能跌破需求区下方。如果买卖量相等,市场很可能在两个水平之间震荡或盘整。 ️ 注意:此指标不建议单独使用。请结合 RSI、TDI, SQUEEZE MOMENTUM
Fixed Volume Profile
Carlos Pascual Perez Maturano
This indicator, titled "Fixed Volume Profile.mq5", is a custom tool for MetaTrader 5 (MQL5) designed to calculate and display a Volume Profile over a user-defined fixed time range. The Volume Profile shows the distribution of trading volume at different price levels during a specific period, helping to identify areas of high activity (such as Points of Control or POCs) and volume-based support/resistance areas. Main Functionality: Interactive Range: The indicator creates two vertical lines on
FREE
This SMT (Smart Money Technique) divergence indicator identifies discrepancies in price movement between two different trading symbols, helping traders detect potential market reversals. This tool compares the price action of two correlated assets, such as two currency pairs or indices, to spot divergences where one asset's price moves in the opposite direction of the other. For example, while one symbol may be making higher highs, the other might be making lower highs, signaling a divergence. T
FREE
Visual Bollinger Bands Divergence
Luiz Felipe De Oliveira Caldas
VWAP 波段视觉样式 1.0 金融市场指标是交易者和投资者用来分析金融市场和做出决策的重要工具。 VWAP 和布林带是交易者用来衡量市场趋势和价格波动的两种流行技术分析工具。在此产品中,我们建议结合这两个指标来创建一个独特的产品,提供对市场趋势和波动性的全面分析。该产品非常适合希望根据数据驱动分析做出明智决策的交易者和投资者。 背离策略是一种流行的技术分析技术,交易者使用它来识别市场中潜在的趋势逆转。该策略依赖于识别价格走势和技术指标之间的差异。在本节中,我们将使用视觉风格和布林带描述背离策略。 例如,使用 Visual Style 和 Bollinger Bands 的背离策略是一种流行的技术分析技术,交易者使用它来识别市场中潜在的趋势逆转。该策略依赖于识别 RSI 和证券价格行为之间的差异。通过使用此策略,交易者可以根据数据驱动的分析做出明智的决策,从而实现更有利可图的交易和投资。
Hunttern ZigZag MT5
Hassan Gh Fakhraei
5 (1)
Hunt markets with Hunttern ZigZag . Easy to use with one parameter    You can use it for the following:       -Classic patterns       -Heads and shoulders       -Harmonic patterns       -Elliott Wave       -Support and resistance       -Supply and Demand Single parameter:      -Period (1-120) Features:        -Candle time        -Single parameter        -Light mode template This is version 1 of Hunttern ZigZag. We are very happy to receive feedback from you.
FREE
SessionFlowMap — 多时段成交量与Delta分布图(含POC关键位) SessionFlowMap 为外汇交易日的各个交易时段(亚洲、伦敦、纽约,另可选悉尼和自定义时段)生成成交量分布图和Delta分布图(买卖失衡)。对于每个时段,指标会找出 POC(控制点,即成交量最大的价格)和价值区域 Value Area(VAH 与 VAL,容纳大部分成交量的区间),并把这些水平位以水平线的形式向右延伸。你可以一眼看出市场在每个时段把时间和资金花在了哪里,以及哪些价位可能再次变得重要。 MT4-version:  https://www.mql5.com/en/market/product/200941 工作原理 每个时段按各自的时间从 M1 历史数据中截取。亚洲、伦敦、纽约和悉尼的时间以 GMT 设置,并自动换算为经纪商服务器时间;自定义时段直接使用服务器时间。 时段的价格区间被划分为若干价格行(目标行数由你设置),成交量分配到各行。外汇没有集中式成交量,因此使用的是 Tick 成交量。 成交量分布图是每一行的总成交量;Delta 分布图是每一行的买入量减去卖出量(绿色表示买方
SPECIAL LAUNCH OFFER: $30 (1-Month Rent) Limited time offer to build our community and gather feedback! AmbM GOLD Institutional Scalper A high-precision M5 algorithm for XAUUSD (Gold) , engineered to trade exclusively at Institutional Liquidity Levels ($5/$10 psychological marks). PERFORMANCE DATA (BUY ONLY) • Win Rate: 87.09%. • Safe Growth: +$4,113 profit on $10k (13.75% Max Drawdown). • Extreme Stress Test: Successfully generated +$22,997 in a 5-year stress test (2020-2026), proving
UZFX-Alpha Strike Signals v2.0是一款专业级市场分析工具,旨在精准清晰地识别高概率交易机会。该先进指标融合了精密的价格行为识别与动态风险管理可视化功能,直接在图表上呈现清晰的买入与卖出信号。 注意:结合使用 { LTL 164343 } 指标,可提高获胜信号的准确率。 利用 LTL 信号判断趋势,并以 Alpha 信号作为入场信号。 这种方法将最大限度地提高您的胜率,并有助于避免误判信号。 工作原理 该指标通过识别特定K线形态来分析市场结构,这些形态预示着潜在趋势反转或延续。当这些形态符合专有算法条件时,指标将生成清晰视觉信号: • 买入信号(蓝色箭头)出现在市场底部,表明看涨动能显现 • 卖出信号(红色箭头)出现在市场顶部,确认看跌压力形成 交易者核心优势 1. 清晰可执行的信号 无需解读猜测——信号位置直接在图表上显示箭头 色彩编码信号(买入蓝标/卖出红标)实现即时识别 可配置信号灵敏度以匹配您的交易风格 2. 完整交易管理可视化 信号出现时,指标自动绘制: 入场点位——最佳建仓价格 止损位——基于近期价格走势的保护性位 多级止盈位(1
FREE
This is the Full Version, to get the free version please contact me. The free version works on “GBPCHF” charts. All symbols and time frames scanner. Harmonic Pattern Harmonic patterns are used in technical analysis that traders use to find trend reversals. They are considered one of the most accurate technical analysis tools, as they allow traders to predict the future price movement direction and the potential trend targets. Also, unlike many other technical tools, the number of false signals
Precision Spike Detector
Francisco Mandomo Simbine
5 (2)
Precision Spike Detector V3 – Institutional-Grade AI Trading System Attention: The price increases by US$50 for every 10 purchases.  Final price: US$599 Precision Spike Detector V3   is a   state-of-the-art, institutional-grade market analysis system   for   MetaTrader 5 , designed to detect   high-probability market movements   in synthetic indices such as   Boom, Crash, GainX, and PainX . After purchase, send me a private message to receive the optimized configuration files,  the installation
Qzone
Vinutthapon Bumroong
Quantific Structure Zone is a technical indicator designed for Price Action and SMC traders. It maps the market structure and identifies dynamic supply and demand zones on the chart. Built with a non-repainting algorithm, it provides signals upon confirmed candle closes, making it suitable for live trading and backtesting. The indicator highlights market swings and price levels. Features Automated Market Structure: Identifies and labels structural swing points with HH (Higher High), HL (Higher
FREE
Matreshka
Dimitr Trifonov
5 (2)
Matreshka self-testing and self-optimizing indicator: 1. Is an interpretation of the Elliott Wave Analysis Theory. 2. Based on the principle of the indicator type ZigZag, and the waves are based on the principle of interpretation of the theory of DeMark. 3. Filters waves in length and height. 4. Draws up to six levels of ZigZag at the same time, tracking waves of different orders. 5. Marks Pulsed and Recoil Waves. 6. Draws arrows to open positions 7. Draws three channels. 8. Notes support and re
VolumeDeltaWaves
Stanislav Korotky
This indicator is an extended implementation of Weis waves. It builds Weis waves on absolute volumes (which is the classical approach) or delta of volumes (unique feature) using different methods of wave formation and visualization. It works with real volumes, if available, or with tick volumes otherwise, but also provides an option to use so called "true volume surrogates", as an artificial substitution for missing real volumes (for example, for Forex symbols), which was introduced in correspo
Here I present you this awesome indicator I made. This is a nique combination witch puts you in the same level as MM's. So you can surf a lot of waves and identify the rally time, breakouts, and the perfect time to get in the market. ---- The SSL Channel is a great all-rounder based on 2 Simple Moving Averages, one of recent Highs, one of recent Lows. The calculation prints a   channel   on the chart consisting of 2 lines. This strategy gives a Long signal when price closes above the top of thes
Ultimate Double Top & Bottom (Pro Volume Matrix) Stop trading retail breakouts. Start trading Institutional Traps. The   Ultimate Double Top & Bottom   is not a standard, lagging pattern scanner. It is a highly advanced, non-repainting structural engine equipped with a proprietary   3-Leg Volume Matrix . Designed exclusively for Smart Money Concepts (SMC) and order flow traders, this indicator mathematically dissects the tick volume inside M and W patterns to reveal true institutional intent:  
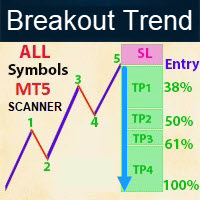
-  Real price is 70$ - 50% Discount (It is 35$ now) Please contact me by temporarily account for more info: https://www.mql5.com/en/users/temp_elif_kaya/ messages Contact me for instruction, any questions! - New Update - Lifetime update free - Non-repaint - I just sell my products in Elif Kaya Profile, any other websites are stolen old versions, So no any new updates or support. Introduction Breakout Trend Scanner indicator works based on the Elliott Wave in technical analysis describes price m
Anti-Harmonic Pattern Scanner (MT5) Elevate your technical analysis and capture high-probability market reversals with the Anti-Harmonic Pattern Scanner for MetaTrader 5. Built specifically to tackle the unique price delivery of modern synthetic and spike indices, this indicator combines advanced geometric precision with strict non-repainting execution to give you a true trading edge. Key Perks & Features 100% Non-Repainting & Permanent Stamping: Say goodbye to the illusion of "perfect" backtest
Psychological Levels – Round Number Lines and Order Block Zones for MT5 Overview Psychological Levels draws horizontal price levels at round numbers (endings in 0 and 5) and highlights order block zones around them. Traders often watch these areas for reactions, reversals, and liquidity. The indicator keeps your chart clean by drawing only the levels near the current price and updating them as price moves. Features Horizontal lines at round numbers ending in 0 and 5, each with its own style, wid
FREE
IBI Footprint
Brahim Eljaziri
IBI Footprint draws a professional footprint chart from the real trades of the exchange : for every candle and every price level you see how many contracts were sold and how many were bought . What you see Top of each column: candle volume (V) and delta (Δ = buys − sells). Each price row: sells | buys. Warmer cells = more volume. Diagonal imbalances highlighted (buyer in blue, seller in red). POC (price with the most volume) framed in gold. Click the panel to shrink it to a thin bar and see your
FREE
该指标基于离散哈特利变换。使用此转换允许您在处理金融时间序列时应用不同的方法。该指标的一个显着特点是它的读数不是指图表上的一个点,而是指指标周期的所有点。 处理时间序列时,指标允许您选择时间序列的各种元素。过滤的第一种可能性是建立在这种方法上的——所有不必要的高频分量都被简单地丢弃。第一个图展示了这种方法的可能性,选择CutOff参数,可以选择原始时间序列的细节(红线-只剩下主要信息CutOff = 0,黄色-主要和最低频率周期CutOff = 1 , 蓝色 - 所有最高频的噪声都被丢弃 CutOff = 4 )。然而,这不是唯一的可能性——噪声分量可以通过额外的过滤来抑制。 这两个选项都在该指标中实施。它的参数是: iPeriod - 指标周期 Shift - 指标相对于当前柱的偏移。通过更改此参数,您可以评估指标过去的表现。 NoiseReduction 是一种降低噪音的方法。可能的值:none - 不抑制噪声(在这种情况下只有 CutOff 参数起作用),constant - 噪声通过常数衰减,linear - 线性噪声抑制,对数 - 对数衰减,square - 根据平方根进行
" Blow It Up!" - The Trading Indicator That Questions Your Life Choices Tired of boring indicators? Meet your new market companion that delivers: "YOLO BUY!" arrows when you should probably panic Explosive rectangle confetti (because why not?) 200+ soul-crushing quotes like "Your stop loss is imaginary" and "This is n't trading, it's donating to whales" Random alerts that roast your strategy This Indicator is lik e Therapy - Because daytrading shouldn't fe el like watching paint dry! Highlights
成交量分布多模式:按您自己的方式分析成交量,而不是按指标的方式。 大多数成交量分布指标将交易者限制在预定义的分析范围内。但市场并非按照固定的模式运行,所以你的分析也应该如此。 成交量分布多模式指标 让您可以完全自由地决定在何时何地以及如何分析成交量。无论您是研究市场结构、分析交易时段、监控更高时间框架的活动,还是追踪正在形成的竞价行情,该指标都会适应您的交易风格,而不是强迫您去适应它。 Volume Profile Multi-Mode 专为寻求直观工作流程的初学者和要求灵活性的专业人士而设计,它将四种强大的分析方法结合到一个高度交互式和可定制的交易工具中。 四种强大的分析模式 1.       灵活框: 在控制面板中将切换按钮设置为 “灵活框” ,然后点击“创建新的灵活框” 。只需在任何价格结构周围绘制一个矩形,指标即可立即在选定区域内生成成交量分布图。您可以随时移动、调整大小或删除该框,以便在分析发生变化时创建多个独立的分布图,从而同时比较不同的市场结构。 2.       固定范围 :将切换按钮设置为 “固定范围” ,然后单击 “创建新的固定范围” 。图表上会显示两条可移动的垂直
AURA Session Zones Mapper is a professional-grade, ultra-clean chart indicator designed specifically for Smart Money Concepts (SMC), ICT, and Price Action day traders. Say goodbye to cluttered charts with overlapping, opaque boxes. AURA provides a minimalist, visually pleasing approach to mapping major market sessions, ensuring your focus remains strictly on price action and institutional levels. Built with a strict No-Repaint algorithm , this indicator not only maps the sessions but actively an
FREE
This indicator will show you the average entry price for positions, pending orders and both, every side and every type has an different color; It will also show you actual risk, pending risk, both sum and for both sides and the sum of both; you can configure Day, Week, Month and Year Financial Risk to show you if you are close to it; it shows the risk return of each side and both sides too, based on risk and profit for actual position and pending orders
FREE
Expert VWAP TripleMA
Michael Amorim Vieira
Expert VWAP TripleMA is a visual indicator developed for traders who want to concentrate essential readings of average price, trend, and operational confluence into a single tool. It combines a daily VWAP, VWAP standard deviation bands, and up to 3 independent moving averages, all fully configurable by the user. Its purpose is to reduce dependence on multiple external indicators and provide a cleaner, more objective, and better organized view directly on the MetaTrader 5 chart. The indicator was
Impulse MACD Signals MT5
Bruno Alberto Nunez Aguilar
Impulse MACD Signals is a momentum oscillator designed to reduce the false signals that affect the classic MACD in ranging markets. Unlike the traditional MACD, the Impulse MACD outputs a value of zero when price action stays inside the moving average channel, which means the indicator naturally stays silent during consolidation phases. This implementation is a clean, non-repainting port of the Impulse MACD concept for MetaTrader 5, built from the mathematical specification and enhanced with a
该产品的买家也购买
Entry Points Pro for MT5
Yury Orlov
4.55 (152)
Entry Points Pro 会在您下单之前,告诉您在哪里入场、止损放在哪里、用多大的手数交易。 价格 现在 199 USD,按此价格出售 8 份,之后为 249 USD。最终价格为 349 USD。 我靠交易市场赚钱,并公开展示,所以我不需要把这个指标卖给所有人。它是为独立思考的交易者准备的工具,而不是一个神奇按钮。 没有突破,就没有交易。灰色箭头表示信号已取消:价格没有突破信号K线,因此没有入场,也没有亏损。 箭头在 K 线收盘时出现,并且不会重绘。只有两项设置:您的本金和每笔交易的风险。 付款前先验证:免费演示版可在 MT5 策略测试器中运行,只需两分钟。购买后,我会亲自帮您完成设置。 2019 年,我向全世界展示了这款指标的能力。我按它的信号手动交易,用的是真实账户,全程公开——账户在 Myfxbook 上接受监控,我还在 Facebook 上详细记录了这次实验。结果:10,000 美元在四个月内变成了 941,411 美元。风险是我有意设得极高的——回撤一度达到 54%,因为在我们这一行,利润和风险总是相伴而行。Myfxbook 的截图就是图库中的第一张图片。 看来
Gann Made Easy MT5
Oleg Rodin
5 (13)
Gann Made Easy   是一个专业且易于使用的外汇交易系统,它基于使用先生理论的最佳交易原则。 W.D.江恩。该指标提供准确的买入和卖出信号,包括止损和获利水平。您甚至可以使用推送通知在旅途中进行交易。 购买后请联系我,即可免费获得交易指导和超棒的额外指标! 您可能已经多次听说过江恩交易方法。通常 Gann 的理论不仅对于新手交易者而且对于那些已经有一定交易经验的人来说都是非常复杂的东西。这是因为江恩的交易方法在理论上并不那么容易应用。我花了几年时间来完善这些知识,并将最好的原则应用到我的外汇指标中。 该指标非常易于应用。您所需要的只是将其附加到您的图表并遵循简单的交易建议。该指标不断进行市场分析工作并寻找交易机会。当它检测到一个好的入口点时,它会为您提供一个箭头信号。该指标还显示止损和获利水平。 换句话说,当您像先生一样进行交易时,该指标会为您提供最佳江恩建议。江恩亲自告诉你此时此刻该做什么。但最好的部分是您不需要了解任何有关江恩交易原则的知识,因为该指标会为您完成整个市场分析工作。
Ultra Indicator
Ihor Otkydach
5 (1)
ULTRA 是一項採用「一站式」運作模式的技術指標——它能獨立分析市場、產生交易訊號、顯示設定停損單的價位,並建議何時平倉以鎖定獲利或將損失降至最低。 換句話說,無論您是否懂得分析市場、判定價位(該將停損設在哪裡),或是對資金管理感到棘手,都無妨。ULTRA 會為您處理所有這些事情! 買家專屬好禮 : 購買 ULTRA 指標後,請透過私訊聯繫我,即可免費獲贈「ULTRA BOT」。這是一款特別設計的工具,能協助您根據該指標發出的訊號來管理已開倉的交易(它會為每筆交易設定停損點,並依照策略規則自動平倉,以爭取最佳交易結果)。 我還會為買家提供各種資產的預設參數,讓該指標能發揮最大效能。請透過私訊聯繫我,免費獲得這些超級好處! ULTRA 策略的運作方式 ULTRA 指標會分析歷史價格數據(涵蓋約過去 4 年),並自動學習辨識波段反轉,以便在實際交易中為您創造最大利潤。 該指標的訊號絕不會重新繪製!!一切都盡可能做到真實且直觀! ULTRA 指標運用特殊的虛擬化演算法,根據歷史數據計算所有訊號的結果,並將其交易成果顯示於儀表板上。這意味著您甚至在開始交易之前,就能預先了解 ULTRA 指標
Boba Analysis Suite
Trade Ready Solutions LLC
5 (2)
Boba Analysis Suite Boba Analysis Suite 是一款适用于 MetaTrader 5 的分析指标。它将市场结构、关键价格区域和整体市场背景整合到同一图表视图中。 该指标源于交易及交易教学的实践经验,旨在帮助用户建立有条理的分析流程:评估市场方向、识别重要价位,并结合多个时间周期进行分析。 结合市场背景进行分析 单个信号的意义取决于市场背景。Boba Analysis Suite 帮助用户将当前图表状况与更大范围的市场结构相结合,并根据预先制定的规则评估交易思路。 分析功能包括: **趋势与市场结构:**评估市场方向及相关结构背景。 **关键价格区域与价位:**在图表上直观标示值得进一步分析的重要区域。 **多时间周期:**整合不同时间周期的信息,评估整体市场背景。 **可视化分析流程:**直接在图表上查看分析信息。 自主做出交易决策 Boba Analysis Suite 适合希望系统分析图表并结合多个时间周期信息的交易者。 该指标用于辅助分析,不会开仓或平仓,也不能替代交易策略或风险管理。每一笔交易的决策均由用户自行做出。 使用与许可 平台:Meta
M1 Sniper MT5
Oleg Rodin
5 (7)
M1 SNIPER   是一款易于使用的交易指标系统。它是一个专为 M1 时间框架设计的箭头指标。该指标可以作为独立的系统在 M1 时间框架下进行剥头皮交易,也可以作为您现有交易系统的一部分使用。虽然该交易系统专为 M1 时间框架交易而设计,但它也可以用于其他时间框架。我最初设计此方法是为了交易 XAUUSD 和 BTCUSD。但我发现这种方法在其他市场交易中也同样有用。 指标信号既可以顺势交易,也可以逆势交易。我教授一种特殊的交易技巧,帮助您利用指标信号进行双向交易。该方法基于使用特殊的动态支撑位和阻力位区域。 购买后,您可以立即下载 M1 SNIPER 箭头指标。此外,我还为所有 M1 SNIPER 工具用户免费提供下方屏幕截图所示的 Apollo Dynamic SR 指标!这两个指标的组合可以帮助您更轻松、更准确地利用 M1 时间框架进行交易。 购买后请联系我,免费获取交易提示和奖励指标! 祝您交易成功!
Apex Patterns PRO 购买指标 — 免费获取基于该指标的 Expert Advisor。 自我优化的图表形态与突破分析智能 传统的形态扫描器依赖固定输入,在市场波动和结构发生变化时通常表现不佳。 Apex Patterns PRO 旨在适应不断变化的市场条件,将结构性图表形态识别、动量过滤和统计自我优化结合到一个分析框架中。 适应性扫描引擎 自我优化形态模式 在近期历史数据中自动搜索合适的形态参数,使指标能够根据当前市场行为调整其结构检测,而不是使用静态配置。 智能突破过滤 将经典形态识别与动量、成交量和价格行为指标相结合。引擎不会同等对待每次突破,而是评估潜在的市场结构,以识别符合当前统计环境的交易设置。 主要功能 固定的、不重绘的实时信号 自我优化的形态检测参数 丰富的图表结构库(顶部/底部、头肩顶/底、三角形、楔形) 基于动量和成交量的突破过滤 基于市场结构的动态止损和止盈水平 图表信号和实时性能指标 标准的推送、电子邮件和平台提醒 专为适应不断变化的市场条件而设计,而非依赖永久固定的参数 核心理念 目标不是将静态的几何形状强加于动态的市场。 目标是让历史市场数据
SQN Max indicator for MT5 by ITC
Renaud Herve Francois Candel
Sqn Max Indicator Sqn Max is an exclusive indicator to trade the market with high effectiveness. The indicator is based on price action, volatility and trend. This indicator is as simple as possible but not too simple. The indicator can generate alerts to ease the trading process. You don't have to stay all day in front of your screen. The indicator can be used with any class of assets and with any time frame. It is possible to achieve better results trading our list of selected assets. We achi
Adaptive Price Action Engine 买指标,免费送EA 自适应多时间框架趋势与K线形态智能分析系统 市场环境始终在变化,不同的市场阶段中,并非所有 Price Action 形态都具有相同的参考价值。 Adaptive Price Action Engine 旨在适应不断变化的市场条件,将 趋势结构、多时间框架分析、K线形态与统计优化 整合到一个统一的分析框架中。 两种自适应模式 Dual Alpha Trend Mode(双 Alpha Trend 模式) 自动搜索适合的 Alpha Trend 参数,并结合低周期与高周期市场结构,使指标能够根据近期市场行为动态调整趋势识别。 Candlestick + Alpha Mode(K线 + Alpha 模式) 将 Alpha Trend 市场状态与 22种多空K线形态 相结合。系统不会简单地对所有形态一视同仁,而是对不同的形态组合进行统计评估,并识别在特定市场环境下表现出更强历史统计特征的配置。 主要功能 趋势参数自动优化 多时间框架市场状态分析 22种多头与空头 Price Action K线形态 对数千种可能
Divergence Bomber
Ihor Otkydach
4.89 (94)
购买该指标的每位用户将额外免费获得以下内容: 原创工具“Bomber Utility”,该工具会自动跟踪每一笔交易,设置止损和止盈点,并根据策略规则自动平仓; 适用于不同交易品种的指标设置文件(Set 文件); 三种不同风险模式下的 Bomber Utility 设置文件:“最低风险”、“平衡风险” 和 “观望策略”; 一套详细的 视频操作手册,帮助您快速完成安装、配置并开始使用本交易系统。 注意: 要获取以上所有赠品,请通过 MQL5 的私人消息系统联系卖家。 我为您介绍原创的自定义指标 “Divergence Bomber”(背离轰炸机),它是一套基于 MACD 背离交易策略 的“全功能”交易系统。 该技术指标的主要任务是识别 价格与 MACD 指标之间的背离,并发出交易信号(包括推送通知),指示未来价格可能的运动方向。平均而言,这些信号的准确率超过 98%。有关该指标如何工作的详细说明,请观看本页面上的视频演示。 该系统使用 止损订单 和 动态回撤平仓机制 来管理交易。 Divergence Bomber 指标的主要特点: 支持交易的品种: AUDCAD、AUDCHF、AUDS
货币强度向导是一个非常强大的指标,为您提供成功交易的一体化解决方案。该指标使用多个时间范围内所有货币的数据来计算这个或那个外汇对的力量。此数据以易于使用的货币指数和货币电力线的形式表示,您可以使用它们来查看这种或那种货币的力量。 您所需要的只是将指标附加到您要交易的图表上,该指标将向您显示您交易的货币的真实强度。该指标还向您显示买卖量压力的极值,您可以在顺势交易时利用这些压力。该指标还显示了基于斐波那契的可能目标。该指标可用于各种交易时间范围。该指标支持各种货币对的交易。   该指标为您提供所有类型的警报,包括推送通知。 购买后请联系我。我将与您分享我的交易技巧,并免费为您提供丰厚的红利指标! 祝您交易愉快,获利丰厚!
Auto Optimized SpeedAngle 是一款机构级的动量向量化系统,通过持续的前瞻优化(Walk-Forward Optimization, WFO)彻底消除了曲线拟合(curve-fitting)。该指标没有采用在市场 状态转换时容易失效的静态输入参数,而是利用出样外验证(Out-of-Sample, OOS) dynamically 动态重新校准设置,从而确保显示的 信号代表真正的统计优势,而非历史巧合。 核心机构级架构 前瞻优化引擎(Walk-Forward Optimization Engine): 核心算法持续扫描数千种回溯周期(lookback)与阈值组合,严格将数据划分为样本内(in-sample)和样本外(out-of-sample)。只有当参数配置在未知数据环境中证明具备数学优越性时,系统才会对其进行 adoption。 量化目标函数(Quantitative Objective Functions): 优化引擎不一味追求绝对毛利,而是聚焦于机构级的稳定性指标。用户可针对系统质量数(SQN)、期望值(每笔交易的平均 R 倍数)或净 R 值进行优化,从而优
Dynamic Forex28 Navigator MT5
Bernhard Schweigert
5 (1)
多货币强度与动量指标 MT5 Dynamic Forex28 Navigator 是我们长期受欢迎的指标的演进,把五种力量合而为一: Advanced Currency Strength28 Indicator(700 条评价) Advanced Currency IMPULSE with ALERT(530 条评价) Currency Strength EXOTICS GOLD Impulse with Alert CS28 Combo Signals(当前赠品) 无需购买四个指标并把它们堆在图表上。一切都合并在一个强大的指标中:28 个 Forex 货币对的强度、引领它们的市场动量,以及两者的警报——在一个窗口中,在一张图表上。 上述程序在 MQL5 Market 上合计获得超过 1,200 条评价,自 2016 年以来一直是 MT4 社区的一部分。Dynamic Forex28 Navigator MT5 延续同样经过验证的逻辑。 为 MetaTrader 5 完全重建——专为利用 MT5 原生多品种架构而设计。 用户手册: https://www.mql5.com/en/blo
Azimuth Pro
Ottaviano De Cicco
5 (7)
Azimuth Pro V2:MT5合成分形结构分析与确认入场 概述 Azimuth Pro 是 Merkava Labs 推出的多层级波段结构指标。四层嵌套波段层级、锚定波段的VWAP、ABC形态识别、三时间框架结构过滤以及收盘确认入场——一个图表,一个从微观波段到宏观周期的完整工作流程。 这不是盲目的信号产品。它是一个以结构为先的工作流程,专为重视位置、背景和时机的交易者打造。 1. V2的变化 合成多时间框架引擎 高时间框架分析从零开始重建,采用与Meridian Pro相同的专有合成架构。更清晰的HTF背景、稳定的实时行为、无经典MTF同步问题。合成引擎还解锁了 固定比率时间框架级联 (x2、x3、x4、x6)——不再在经纪商的固定时间框架之间任意跳转,您可以按图表时间框架的固定倍数分析结构,在每个尺度上保持相同的分形关系。 确认入场箭头 作为稳定且可恢复的执行层而设计的收盘确认箭头。当ABC设置形成且自适应确认逻辑在收盘K线上验证方向时,箭头会写入下一根K线的开盘,并设计为在刷新、切换时间框架、重新加载指标或重启终端等正常图表生命周期事件后仍能一致恢复。 这些不是独立的买
ARICoins
Temirlan Kdyrkhan
ARICoin is a powerful trading companion designed to generate high-probability entry signals with dynamic TP/SL/DP levels based on volatility. Built-in performance tracking shows win/loss stats, PP1/PP2 hits, and success rates all updated live. Key Features: Buy/Sell signals with adaptive volatility bands Real-time TP/SL/DP levels based on ATR Built-in MA Filter with optional ATR/StdDev volatility Performance stats panel (Success, Profit/Loss, PP1/PP2) Alerts via popup, sound, push, or email Cust
PZ Swing Trading MT5
PZ TRADING SLU
5 (5)
Swing Trading 是第一个旨在检测趋势方向的波动和可能的反转波动的指标。它使用在交易文献中广泛描述的基准摆动交易方法。该指标研究多个价格和时间向量,以追踪总体趋势方向,并检测市场超卖或超买并准备好进行修正的情况。 [ 安装指南 | 更新指南 | 故障排除 | 常见问题 | 所有产品 ] 市场波动的利润不会被窃取 指示器始终显示趋势方向 彩色价格带代表机会基准 彩色虚线表示可能的反转波动 该指标分析其自身的质量和性能 它实现了一个多时间仪表板 可定制的趋势和波动周期 它实现了电子邮件/声音/推送警报 指示器为非重涂或重涂 什么是摇摆交易 摇摆交易是一种尝试在一天到一周内从证券中获得收益的交易方式,尽管某些交易最终可以保持更长的寿命。摇摆交易者使用技术分析来买入弱点和卖出力量,并有耐心等待这些机会的发生,因为在发生一波抛售浪潮之后购买证券而不是陷入抛售更有意义。 机会基准 关于历史数据的大量研究证明,适合于波动交易的市场倾向于在基线价格带上下交易,基线价格带由图表显示,使用平均真实区间计算得出。波动交易者使用基线,该策略是购买常态和卖出躁狂,或做空常态并掩盖沮丧。在没有疲
Neuro Poseidon MT5
Daria Rezueva
4.68 (53)
Neuro Poseidon is a new indicator by Daria Rezueva. It combines precise trading signals with adaptive TP/SL levels - creating best possible trades as a result! Message me and get  Neuro Poseidon Assistant  as a gift to automize your trading process! What makes it stand out? 1. Proven profitability on all assets and timeframes 2. Only confirmed BUY and SELL signals present on the chart 3. Adaptive TP & SL levels generated by the software for each trade 4. Easy to understand - suitable for al
SIO Oscillator
Davit Beridze
SIO Oscillator:自优化半方差失衡振荡器 购买指标,即可免费获得基于该指标的智能交易系统(EA)。 大多数振荡器对所有价格波动一视同仁。SIO 将上行压力与下行压力分开,并衡量两者之间的失衡程度,清楚显示究竟是买方还是卖方在真正掌控市场。当失衡达到极值时,SIO 会给出明确的信号,并附带入场价、止损(Stop Loss)和止盈(Take Profit)水平。 SIO 的独特之处在于它不依赖固定参数。内置的自优化器会持续寻找适合当前品种和周期的参数,并在使用之前对其进行验证。 两种信号模式 均值回归(Mean Reversion):在失衡极值处交易,预期价格回归平衡。 趋势跟随(Trend Following):顺着持续、占主导地位的失衡方向交易。 自动模式:由优化器根据近期数据选择表现更好的模式。 具备真实验证的自优化器 滚动前推优化(Walk-forward):参数只用历史数据选出,然后应用于之后的K线。 真正的样本外保留期(Hold-out):结果会在优化器从未训练过的数据上得到确认。 平台图(Plateau map):所有测试参数的可视化热力图。SIO 优先选择结果稳
Advanced Supply Demand MT5
Bernhard Schweigert
4.53 (15)
任何新手或专业交易者的最佳解决方案! 该指标是一款独特、高质量、且价格合理的交易工具,因为我们已经整合了许多专有功能和新公式。 依据此更新,您将能够显示双重时间帧区域。 您不仅可以显示一个较高的时间帧,还可以同时显示图表时间帧,加上更高的时间帧:显示嵌套时区。 供需双方所有交易者都会喜欢它。 :) 重要信息披露 高级供需的最大潜力,请访问 https://www.mql5.com/zh/blogs/post/720245   想象您的交易如何得以改善,是因为您能够精准定位入场或目标位吗? 构建于新的底层算法,它可以更轻松地识别出买卖双方之间的潜在失衡。 这是因为它以图形方式展示供需最强劲区域,及其过去的表现(显示旧区域)。 这些功能旨在帮助您更轻松地发现最佳入场区域和价位。 现在您可以针对您的交易品种和时间帧来优化和编辑区域强度! 高级供需指标适用于所有产品和时间帧。 它是一个新的公式,非常新的功能是两个区域强度函数可由用户输入进行调整! 这在交易中是一大优势。 当您学习如何使用专有功能,例如带有价格游离最小 X 因子的区域强度时,您能够判断该区域强劲与否。 供需区域用作警报触发器。
ScalpPoint
Temirlan Kdyrkhan
ScalpPoint is a powerful trading companion designed to generate high-probability entry signals with dynamic TP/SL/DP levels based on volatility. Built-in performance tracking shows win/loss stats, PP1/PP2 hits, and success rates — all updated live. Key Features: Buy/Sell signals with adaptive volatility bands Real-time TP/SL/DP levels based on ATR Built-in MA Filter with optional ATR/StdDev volatility Performance stats panel (Success, Profit/Loss, PP1/PP2) Alerts via popup, sound, push, or emai
Superhero
Ihor Otkydach
5 (3)
SUPERHERO 指標是一款基於「全方位」原則設計的多貨幣交易系統。該指標能獨立分析市場,並提供開倉與平倉的交易訊號。它採用止損與獲利了結訂單,風險報酬比(R:R)為 1:1。 此系統可向您的智慧型手機發送推播通知,讓您無需綁定電腦,即可「隨時隨地」進行交易。這對於自營交易公司而言再適合不過了。 每位顧客皆可享額外好禮: 每位購買此指標的買家,都將收到我贈送的一項特別實用工具,該工具: 自動下達止損與獲利了結訂單 當價格達到目標水準時,系統會自動平倉 支援待執行訂單交易 支援均值交易模式 如果您希望將這款優秀且極為便利的工具作為禮物獲贈,請在購買 SUPERHERO 指標後,立即透過 MQL5 平台的私訊與我聯繫。此外,您還將獲得培訓課程「如何安裝與設定 SUPERHERO 並開始穩定獲利」的存取權限。 關於「超級英雄」策略 SUPERHERO 策略是利用價格回調時,順應趨勢方向進行盤中交易。 「超級英雄」程式碼內含數個強大的技術指標,用以分析價格通道的趨勢方向與波動範圍,並能識別在修正性回調後形成的盤中波段反轉形態。 SUPERHERO 指標採用獨特的自我優化演算法,一旦添加至價格
Bill Williams Advanced
Siarhei Vashchylka
5 (11)
Bill Williams Advanced is designed for automatic chart analysis using Bill Williams' "Profitunity" system. The indicator analyzes four timeframes at once. Manual (Be sure to read before purchasing) Advantages 1. Analyzes the chart using Bill Williams' "Profitunity" system. Signals are displayed in a table in the corner of the screen and on the price chart. 2. Finds all known AO and AC signals, as well as zone signals. Equipped with a trend filter based on the Alligator. 3. Finds "Divergence Bar
Naked Forex Kangaroo Tail Pro Indicator Kangaroo Tail Pro Indicator is a pattern recognition indicator for Forex, Stocks, Indices, Futures, Commodities and Cryptos. The Kangaroo Tail is a multi-bar pattern. The Kangaroo Tail pattern is very effective and is very simple to trade. The strategy that comes with the Kangaroo Tail is based on price action. The indicator does what it was designed for: displaying Kangaroo Tail patterns.     Don't expect to follow the up and down arrows and make mone
AriFocus
Temirlan Kdyrkhan
AriFocus - Non-Repainting Buy/Sell Signals AriFocus - one clear signal. AriFocus marks buy and sell signals directly on the chart and suggests a stop-loss level for each one. Every signal is confirmed on bar close and never repaints. - Buy/sell arrows, confirmed on bar close - Suggested stop-loss level for every signal - Trend band and candle coloring to show direction at a glance - 10 ready-made presets, or your own settings (14 calculation methods) - Pop-up, push and email alerts with entr
RSI Thunder MT5
Muhammad Abdulrahman Omar Naima Allah Al-rais
RSI Thunder 是一款专为追求高胜率与高质量交易信号的交易者精心打造的专业智能交易指标。 该指标严格遵循“蜡烛收盘后确认”的原则,仅在K线完全收盘后生成信号,从根本上避免重绘和虚假入场问题。 RSI Thunder 将 RSI、EMA、ADX 和 ATR 等核心技术指标有机结合,形成一套完整、严谨的交易决策逻辑。 同时,通过 SMA40 趋势方向过滤器,确保所有交易都顺应市场的主要趋势方向。 指标会系统性地分析最近五根K线的价格结构,仅在动能、趋势和突破条件同时满足时才确认信号。 所有买卖信号都会以清晰直观的箭头形式直接显示在图表上,帮助交易者快速做出决策。 每一次信号都会自动计算基于 ATR 的止盈(Take Profit)水平,使交易管理更加科学和一致。 RSI Thunder 运行高效,占用系统资源极低,适合长时间稳定运行。 无论是新手还是经验丰富的专业交易者,都可以轻松上手并灵活应用。 该指标特别适用于 M15、M30、H1 等主流交易周期。 RSI Thunder 不仅仅是一个技术指标,而是一套成熟、可靠、可执行的完整交易系统。
Boom Crash GainX PainX Spike Detector Overview Boom Crash GainX PainX Spike Detector is a professional analytical indicator for Deriv synthetic indices. It is designed to identify potential spike opportunities using multiple technical indicators, price movement analysis, and tick-based cycle monitoring. The indicator supports both market directions in one tool: Boom and GainX: BUY signals for potential upward spikes. Crash and PainX: SELL signals for potential downward spikes. The indicator auto
Volatility Master for MetaTrader is a real-time dashboard tool that scans up to  50 symbols  to identify high-volatility , trending markets instantly. With bullish/bearish signals, customizable alerts, and a user-friendly interface, it helps you avoid range-bound conditions and focus on high-probability trades. Clarity leads to confidence. Trade confidently and protect your capital effectively with this powerful dashboard. We don't offer free or bonus indicators in exchange of reviews from you.
Scalper Vault MT5
Oleg Rodin
5 (1)
Scalper Vault 是一套功能强大且配置完善的交易系统,专为追求日内交易稳定性的交易者而设计。 作为一套完整且独立的交易系统,该高精度指标能够为外汇和二元期权交易者提供机构级的市场分析。 购买后请联系我,获取我的独家交易技巧以及一份超值赠品! Scalper Vault 能够消除凭感觉交易和复杂的各种手动分析,让您只需专注于执行交易,并运用简单易行的交易技巧进行操作。 精准的顺势交易信号:其核心算法通过分析市场结构,仅在市场主导趋势的方向上提供高胜率信号,从而大幅减少错误的入场操作。 精确的顶部与底部探测:系统能够识别市场动能耗尽的状态,从而锁定潜在的反转区域。 基于江恩(Gann)理论的买卖区域:系统会自动绘制江恩数学市场点位,让您能清晰洞察大型机构交易者在何处寻求买入或卖出。 100% 不会重绘(Non-Repainting):一旦K线收盘,生成的信号便会永久固定在图表上。绝无动态偏移,绝无虚假信号——您在历史数据中所见,即为该指标的真实表现。 广泛的市场适用性:适用于各类货币对、黄金、指数以及加密货币交易。
FX Sniper Orange indicator for MT5
Renaud Herve Francois Candel
FX Sniper Orange Indicator FX Sniper Orange is an exclusive indicator to spot situations where market has gone too far and market could reverse soon after. The indicator displays arrows in your chart indicating probable future price action (see screenshot attached). FX Sniper Orange never repaints. Once candle is closed signal is confirmed and arrow will never disappear. Users of the indicator can setup alerts when new arrows are displayed in the chart. Inputs of the indicator are: Distanc
ARIPoint
Temirlan Kdyrkhan
1 (4)
ARIPoint is a powerful trading companion designed to generate high-probability entry signals with dynamic TP/SL/DP levels based on volatility. Built-in performance tracking shows win/loss stats, PP1/PP2 hits, and success rates all updated live. Key Features: Buy/Sell signals with adaptive volatility bands Real-time TP/SL/DP levels based on ATR Built-in MA Filter with optional ATR/StdDev volatility Performance stats panel (Success, Profit/Loss, PP1/PP2) Alerts via popup, sound, push, or email Cu
SkyHammer Signal Pro
Shengzu Zhong
5 (5)
SkyHammer Signal Pro Professional No-Repaint Trend Signal Indicator with Locked Entry, SL and TP Levels SkyHammer Signal Pro is a structured trend and momentum signal indicator designed for traders who want clear, fixed, and verifiable trading signals. It works best on lower timeframes such as M1 and M5 . The indicator does not try to predict tops or bottoms. Instead, it waits for confirmed market structure, trend direction, momentum strength, volatility quality, and target space before generati
作者的更多信息
Ultra Prokit Tool
Francis Muchai Waweru
ULTRA PRO TOOLKIT EA Draw it. Size it. Execute it. Most charts are buried under tools that refuse to talk to each other. You mark a level in one place, work out your lot size somewhere else, then hand-type an order and hope you remembered the stop. Ultra Pro Toolkit EA puts the entire workflow on one panel: sketch your market structure, tell it how many dollars you are willing to lose, and let it handle the arithmetic and the order routing. ️ This is a manual trading cockpit, not a signal
筛选:
无评论
回复评论