Argent Aegis

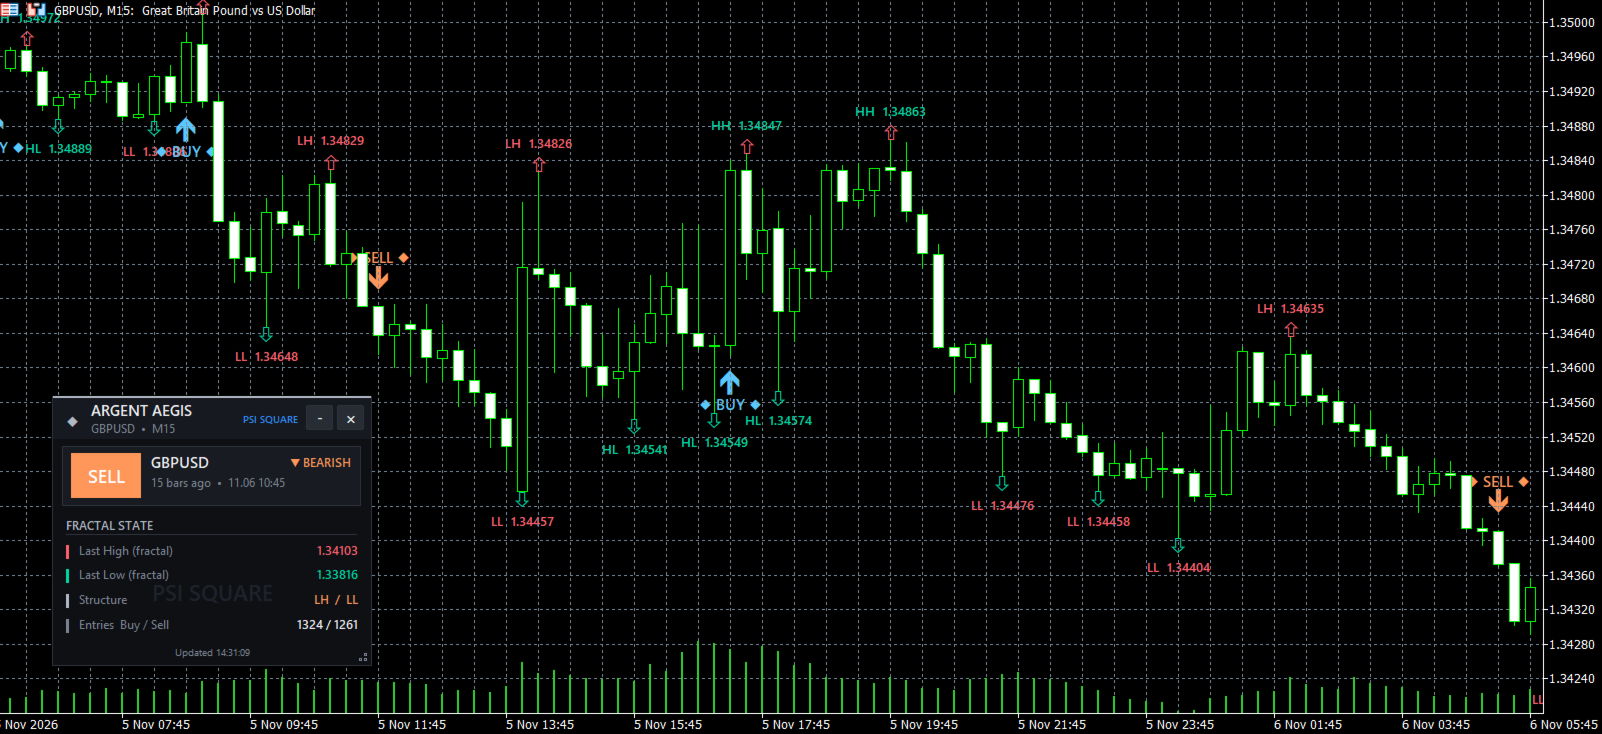
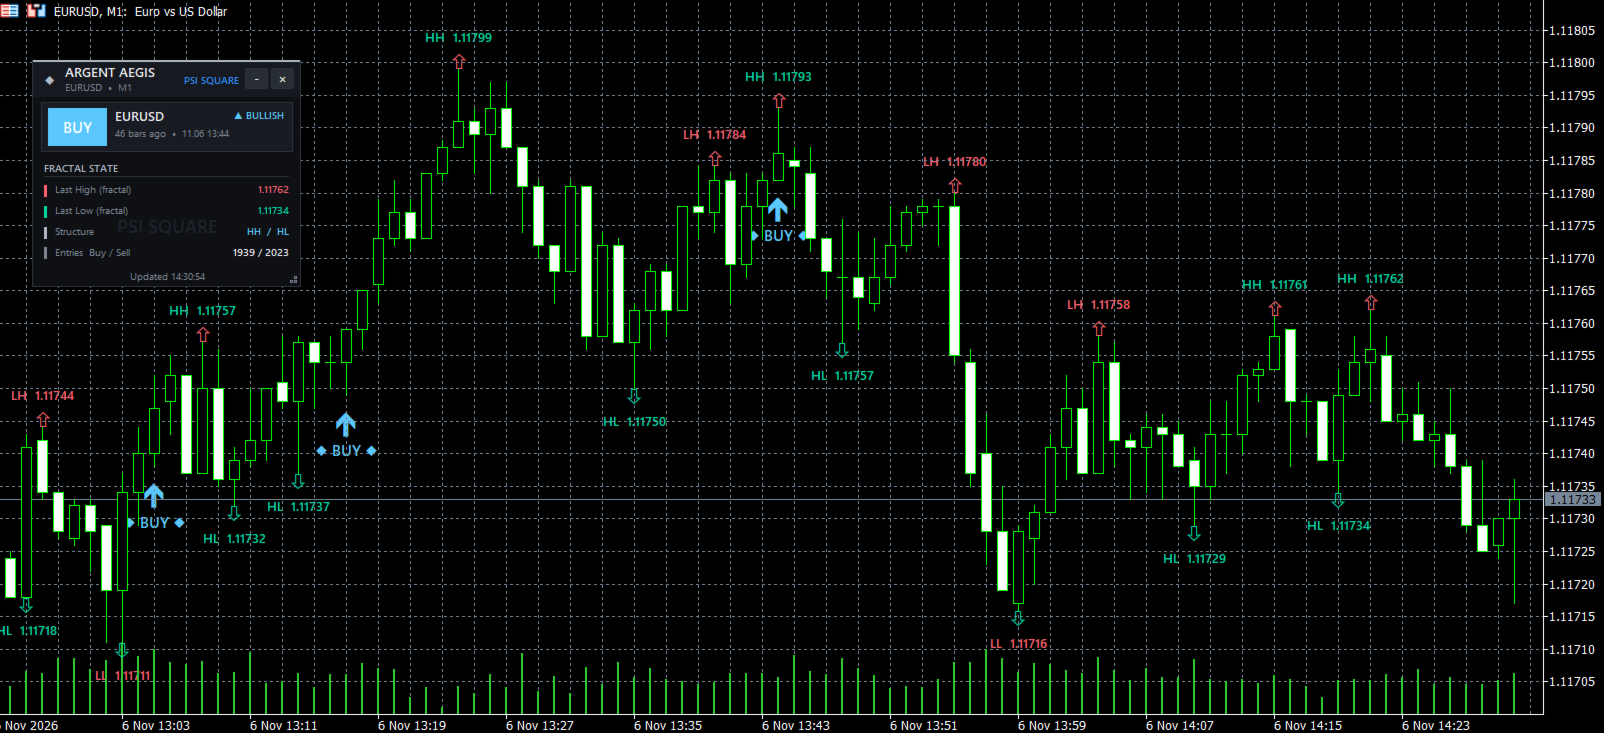
Introducing Argent Aegis, a market-structure and fractal breakout indicator that combines confirmed fractal levels with HH, HL, LH and LL analysis to identify potential BUY/SELL opportunities.

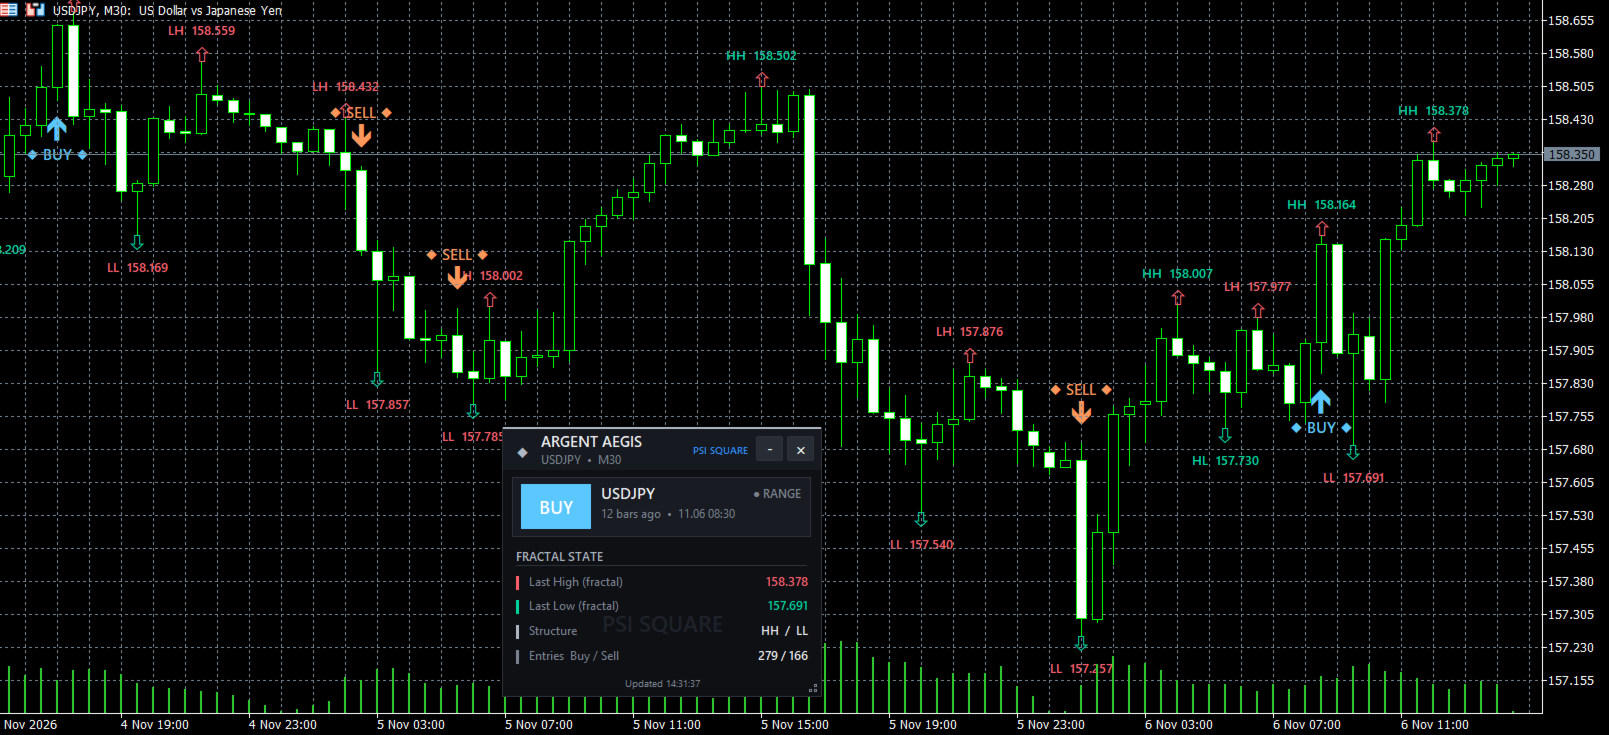
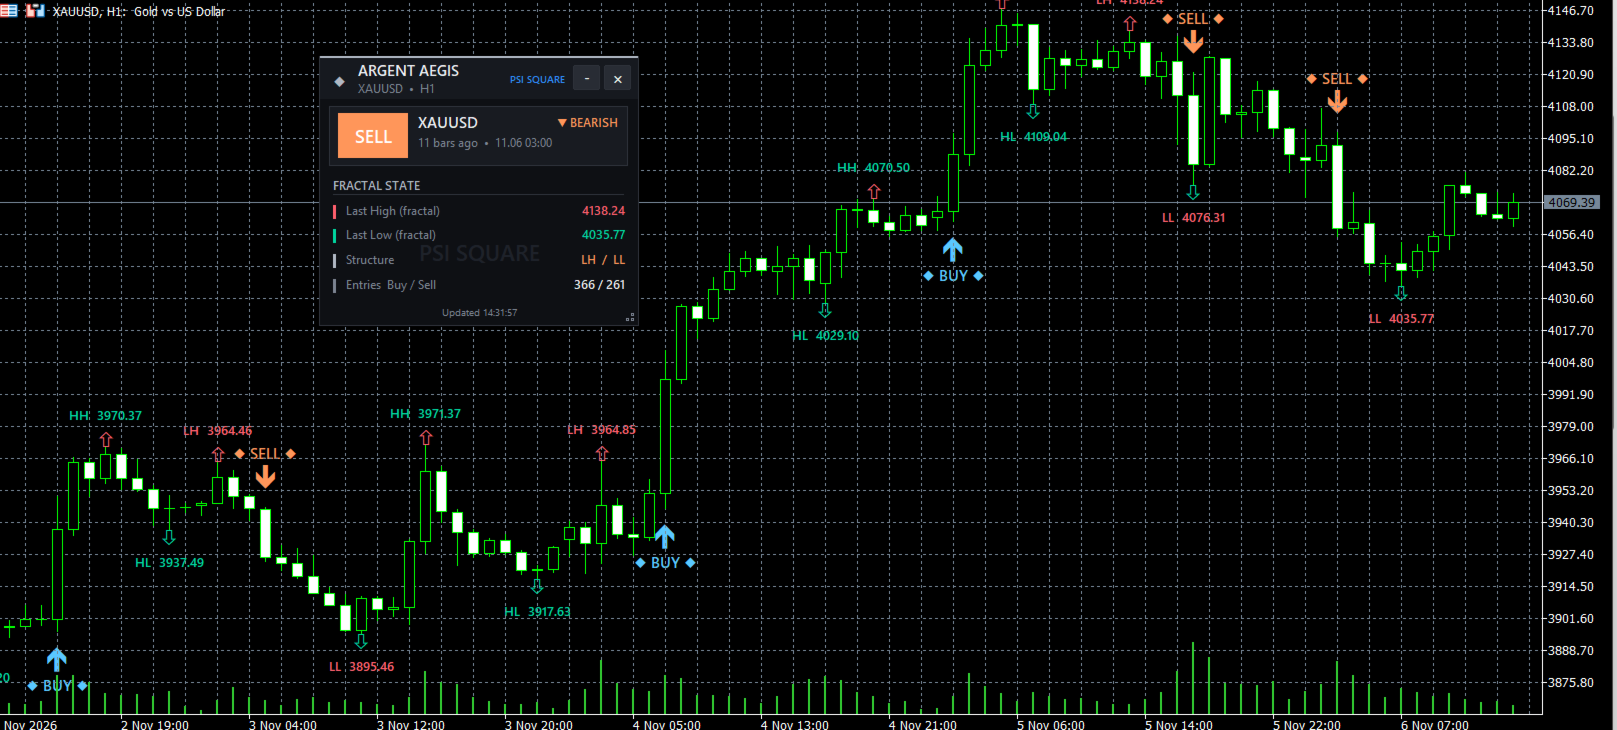
Argent Aegis identifies confirmed swing highs and lows, analyzes market structure and generates BUY signals when price closes above the latest upper fractal with higher-low confirmation, and SELL signals when price closes below the latest lower fractal with lower-high confirmation. It combines breakout confirmation, visual signals and market-structure analysis in one tool.

Key Features:

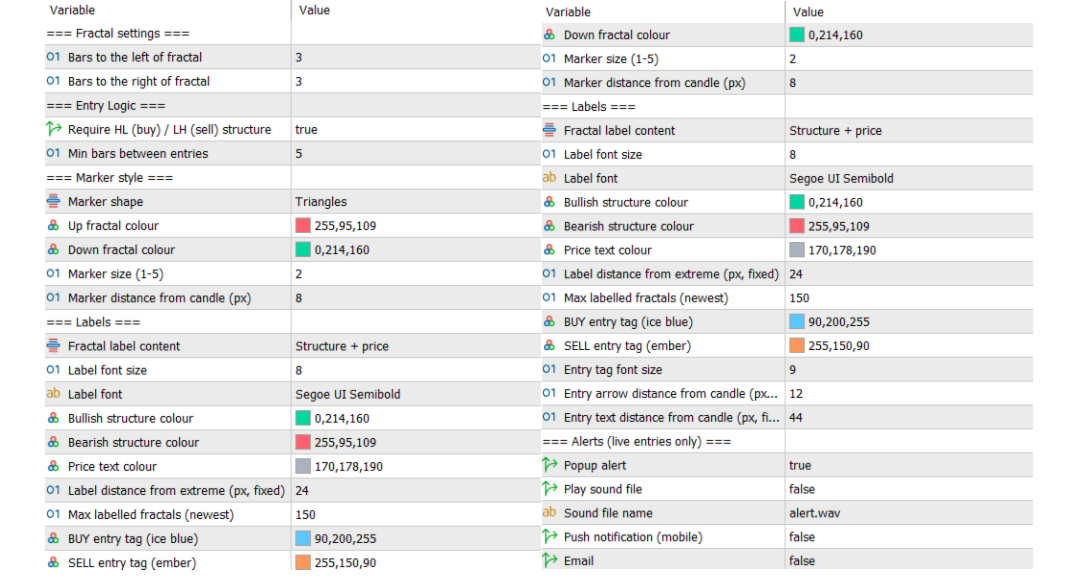
  • Confirmed Fractal Detection: Identifies swing highs and lows using configurable left-side and right-side periods.
  • Market Structure Analysis: Classifies price swings into Higher Highs (HH), Higher Lows (HL), Lower Highs (LH) and Lower Lows (LL).
  • Fractal Breakout Signals: Generates BUY/SELL signals on confirmed fractal breakouts with directional structure confirmation.
  • Structure Filter: Optionally requires higher-low confirmation for BUY entries and lower-high confirmation for SELL entries.
  • Entry Cooldown: Controls signal frequency through a configurable minimum bar interval.
  • Customizable Markers and Labels: Offers five fractal marker styles, adjustable colors, sizes, distances and structure/price labels.
  • Live Dashboard: Displays market direction, latest entries, confirmed fractal levels, market structure and BUY/SELL counts. Draggable, resizable and minimizable.
  • Customizable Alerts: Supports popup, sound, email and mobile push notifications.
  • EA Integration: Provides entry-direction, buy-price and sell-price buffers for Expert Advisor access through iCustom and CopyBuffer.

Specifications:

  • Confirmed fractal detection with configurable periods. HH, HL, LH and LL market-structure classification. Breakout-based BUY/SELL signals with optional structure filtering and entry cooldown. Customizable markers, labels, dashboard and alerts. Closed-candle signal calculations to avoid signals on the forming candle. EA-compatible signal and price buffers.
  • Argent Aegis combines fractal analysis and market-structure confirmation into one tool for identifying potential price-action trading opportunities.

Trading involves risk. Always test on a demo account first.

Contact

For questions or assistance, contact me via Private Message.


Altri dall’autore
Meridian Signal
Muhammad Okasha Razaq
Introducing Meridian Signal, a trend-following signal indicator that turns every trend reversal into a clear, ready-to-use trade plan. Meridian tracks the market's direction with an adaptive trend line built from price channels, short moving averages, and ATR volatility. When the trend reverses, it marks the signal on your chart and instantly calculates your Entry, Stop Loss, and Take Profit. Everything you need to plan a trade is in one place, helping you spend less time analyzing and more tim
Obsidian Trend
Muhammad Okasha Razaq
Obsidian Trend: Trend Reversal Signals with a Live Dashboard Obsidian Trend is a trend-following indicator that displays the market's direction as a single step-style trend line. When the trend reverses, it marks the change with an arrow and a BUY/SELL tag displaying the signal price. A live dashboard panel on the chart shows the current trend, the latest signal, and how price has moved since the signal appeared. The trend line follows the market using recent highs and lows over an adjustable A
Helix Ribbon
Muhammad Okasha Razaq
Introducing Helix Ribbon, a trend-following ribbon indicator that turns every trend crossover into a clear, ready-to-read signal. Helix tracks the market's direction with two moving averages: a fast Triple Exponential Moving Average (TEMA) and a slow Hull Moving Average. The space between them is drawn as a flowing, color-shifting ribbon with thin strands inside it. When the fast line crosses the slow line, the ribbon twists and Helix marks the new trend on your chart with an arrow and a BUY/SEL
Vantage Bands
Muhammad Okasha Razaq
Introducing Vantage Bands, a multi-layer trend indicator that combines a Natural Moving Average, an anchored VWAP, a Bollinger cloud and a Kalman-smoothed Hull crossover into one clean chart overlay. Vantage reads the market in layers. The Natural Moving Average (NMA) shows the main trend and changes color with its slope. The anchored VWAP shows where the session's volume-weighted price sits. The Bollinger cloud shows how stretched price is. Two Kalman-filtered Hull lines, a Hull Trend line and
Zygos TDI
Muhammad Okasha Razaq
Introducing Zygos TDI, a Traders Dynamic Index indicator that turns RSI momentum, volatility and trend into one clear, ready-to-read window. Zygos builds on the classic TDI idea. It smooths the RSI into a fast price line and a slower signal line, then wraps them in volatility bands and a colour-changing baseline. When the price line crosses the signal line, Zygos marks the exact bar with an arrow. The bands show how stretched the market is, the baseline shows which way momentum is leaning, and t
Themis SMC
Muhammad Okasha Razaq
Introducing Themis SMC, a Smart Money Concepts indicator that puts market structure, order blocks, liquidity, fair value gaps, premium and discount zones and rule-based entry signals on one clean chart overlay. Themis reads the market in layers. Internal and swing structure show every Break of Structure (BOS) and Change of Character (CHoCH). Order blocks mark the zones where price is likely to react. Equal highs and lows show resting liquidity. Fair value gaps show imbalance. The premium and di
Nova Exhaustion
Muhammad Okasha Razaq
Introducing Nova Exhaustion , a trend exhaustion indicator that finds the bar where a move runs out of steam. It combines a 9-count setup, a filled SuperTrend and automatic support and resistance levels, all on one clean chart overlay. Nova Exhaustion counts consecutive closes against the close four bars earlier. Nine closes in a row below it mark selling exhaustion and a BUY. Nine closes in a row above it mark buying exhaustion and a SELL. The counts at 7 and 8 warn you early that a 9 is close.
Vortex Anchor
Muhammad Okasha Razaq
Introducing Vortex Anchor , a multi-level market structure and Anchored VWAP indicator that brings swing analysis, trend bias, key price levels and entry signals together in one chart. Vortex Anchor tracks market structure through four independent ZigZag swing levels, each designed to highlight a different degree of price movement. From small local swings to major structural turning points, every level has its own marker, making it easier to distinguish short-term movements from broader market d
Axiom RSI
Muhammad Okasha Razaq
Introducing Axiom RSI , a momentum and trend analysis indicator that combines advanced RSI calculations, moving-average trend detection, a color-coded histogram and rule-based BUY/SELL signals in one integrated indicator. Axiom RSI combines RSI momentum with fast and slow moving-average channels to identify bullish, bearish and neutral market conditions. It offers multiple RSI calculation methods and customizable trend filters to adapt the analysis to different trading approaches. When the sele
Trinity Nexus
Muhammad Okasha Razaq
Introducing Trinity Nexus , a multi-indicator trend analysis tool that combines Flux, Core Trend, Pulse, and Anchor to identify market direction and generate aligned BUY/SELL signals. Trinity Nexus evaluates the selected indicators together, generating signals when all enabled components agree on market direction. It also offers configurable signal modes, trend-strength analysis, and an interactive dashboard for monitoring market conditions. Key Features: Four Indicator Components: Combines Flu
Lumen Trend
Muhammad Okasha Razaq
Introducing Lumen Trend , a multi-component trend analysis indicator that combines MACD momentum, RSI conditions, Wave Trend confirmation, and moving-average trend detection to identify potential BUY and SELL opportunities. Lumen Trend uses three configurable trend meters alongside two additional moving-average trend bars to assess market direction. When all three primary meters align, the indicator generates a potential BUY or SELL signal, with optional Wave Trend crossover confirmation to refi
Helios Flux
Muhammad Okasha Razaq
Introducing Helios Flux , a SuperTrend-based trend analysis and trading signal indicator that combines ATR bands, EMA bias, RSI momentum and candle confirmation to identify potential trend reversals and pullback opportunities. Helios Flux detects trend changes using an ATR-based SuperTrend engine and applies optional EMA, RSI and candle filters to validate entries. It also supports pullback re-entry signals, BUY/SELL markers, trade plan previews, customizable alerts and an interactive dashboard.
Kestrel Trail
Muhammad Okasha Razaq
Introducing Kestrel Trail , a SuperTrend-based trend-following indicator that combines ATR trailing levels with optional RSI, ADX and EMA filters to identify potential BUY/SELL opportunities. Kestrel Trail uses ATR-based calculations to establish dynamic trailing levels and detects trend reversals when price crosses the trail. Optional confirmation filters help validate entries through momentum, trend strength and EMA direction, providing a structured approach to trend analysis. Key Features: Dy
Halcyon Channel
Muhammad Okasha Razaq
Introducing Halcyon Channel , a Keltner Channel-based trend and trading signal indicator that combines EMA, ATR bands and optional RSI confirmation to identify potential BUY/SELL opportunities. Halcyon Channel builds dynamic price channels using an EMA basis and ATR-based upper and lower bands. It offers three entry modes: Breakout, Basis Cross and Band Re-entry, with optional RSI confirmation to validate signals. A trend-coloured basis, chart markers, live dashboard and customizable alerts prov
Eclipse Valkyrie
Muhammad Okasha Razaq
Introducing Eclipse Valkyrie , a relative volume and momentum-based trading indicator that combines RVOL analysis, EMA trend confirmation and price breakouts to identify potential BUY/SELL opportunities. Eclipse Valkyrie compares current volume against historical averages to classify market activity as Surge, Normal or Dormant. It combines EMA alignment, candle strength, breakout confirmation and minimum relative volume requirements to identify potential entries, supported by clear chart signal
Ambrosia Pulse
Muhammad Okasha Razaq
Introducing Ambrosia Pulse , a momentum-based trading indicator that combines momentum strength and PPO confirmation to identify potential BUY/SELL opportunities. Ambrosia Pulse analyzes market momentum using a configurable momentum oscillator and PPO histogram, generating signals when both align and momentum strengthens. With clear chart labels, a live dashboard and customizable alerts, it provides a structured approach to identifying potential market entries. Key Features: Momentum Analysis:  
Moira Threads
Muhammad Okasha Razaq
Introducing Moira Threads, a multi-factor trend analysis indicator that combines multiple market indicators to identify market direction, measure trend strength and detect potential trading opportunities. Moira evaluates market conditions using RSI, multi-timeframe EMA alignment, Bollinger Bands and relative strength against a configurable benchmark. These components contribute to a weighted score ranging from -100 to +100, which is used to determine the current trend state and generate trading
Filtro:
Nessuna recensione
Rispondi alla recensione