Divergence Scanner MT5
- 指标
- 版本: 1.0
- 激活: 5

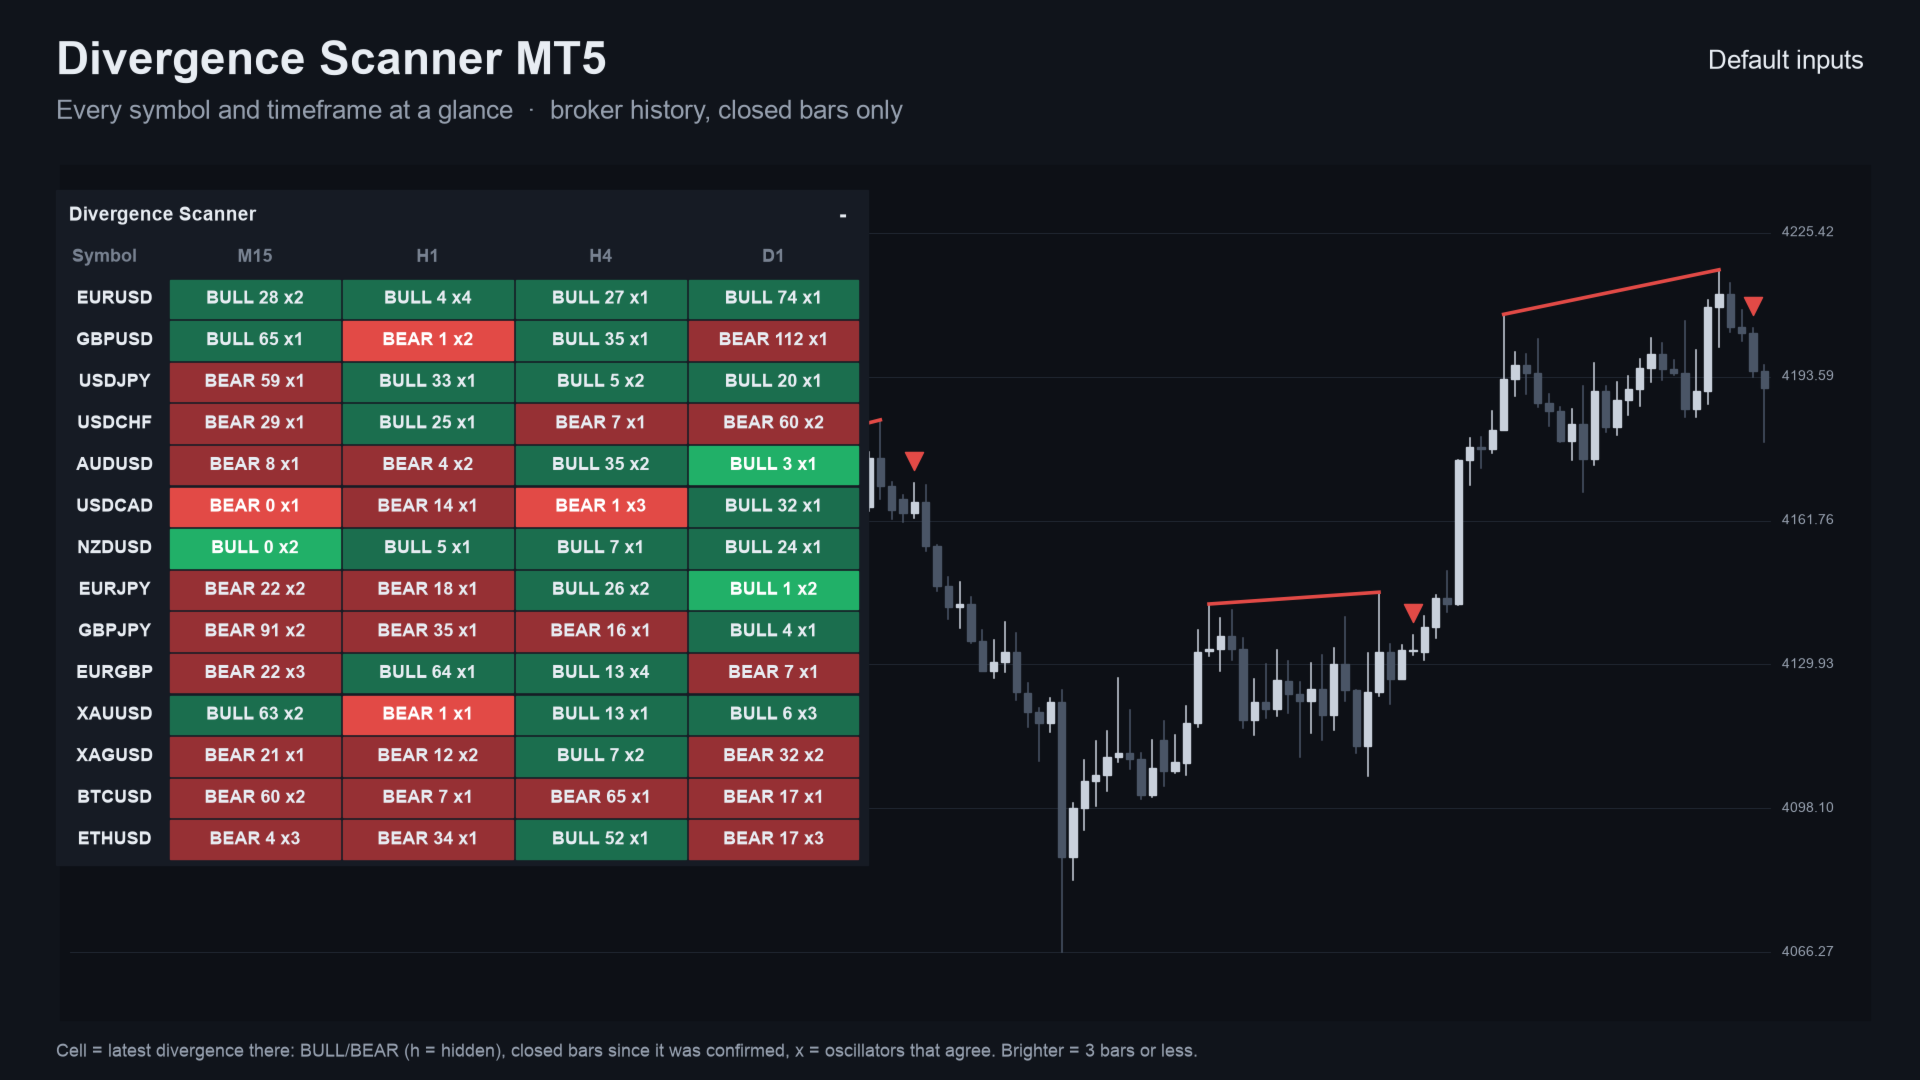
Divergence Scanner MT5 is a scanner indicator for MetaTrader 5. One panel shows the latest RSI, MACD, Stochastic, CCI and OBV divergence on many symbols and timeframes. It shows how long ago each was confirmed and how many oscillators agree, and it sends an alert when a new one appears.
It runs the same divergence engine as the free Divergence Signal Alerts indicator, for a whole list of charts at once. It adds three more oscillators and a count of how many agree.
It places no orders. Cells use closed bars only, so a cell does not change after its bar has closed.
Quick start
- Attach the indicator to one chart. The panel lists your Market Watch symbols (up to 30) by M15, H1, H4 and D1.
- In the inputs, choose Market Watch or your own list of symbols, the timeframes and the oscillators (all five are on by default).
- Set how many oscillators must agree. A divergence is shown from 1 (default) and an alert is sent from 2 (default).
- Keep the pop-up alert on (default) or add sound, push notification or e-mail. Click a cell to open that chart.
Standalone: everything is built in. You do not need to buy or install any other product named on this page.
What you see on the chart
- A panel with symbols as rows and timeframes as columns.
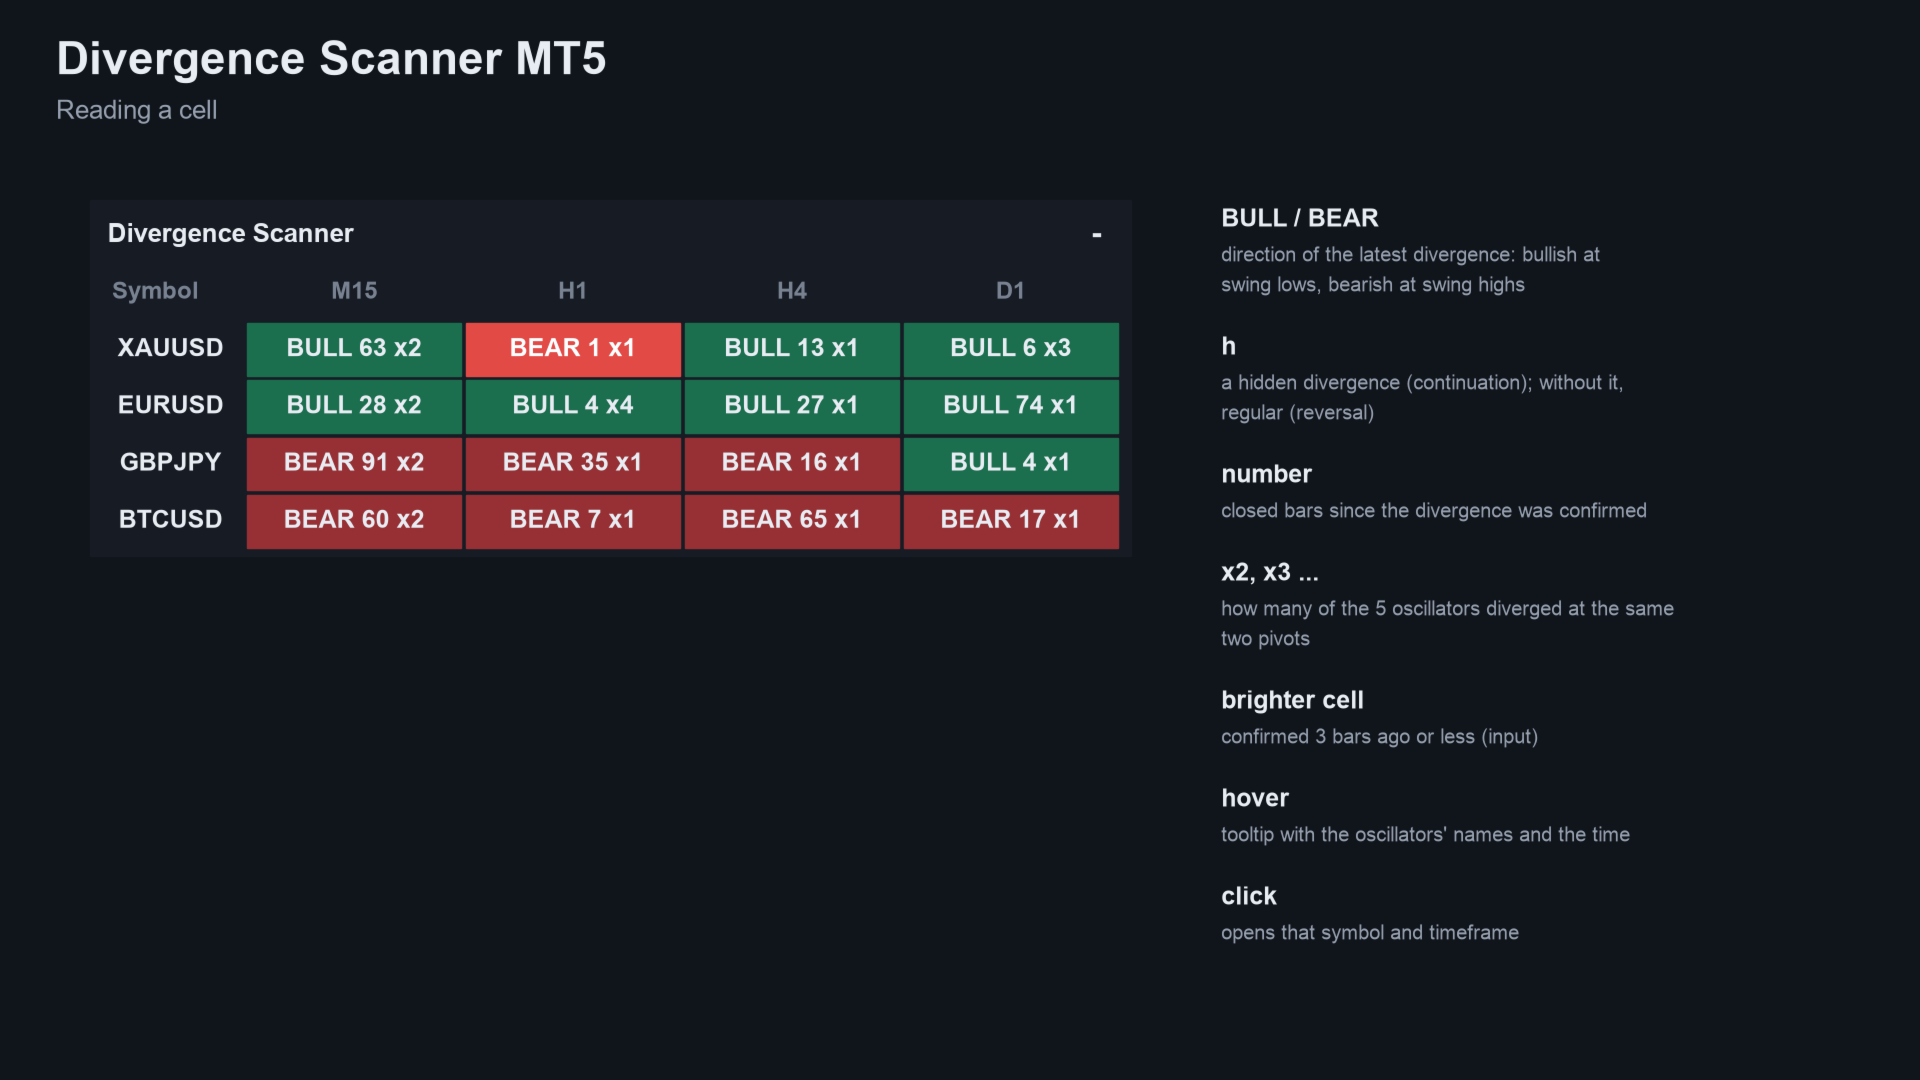
- In each cell: BULL or BEAR (h = hidden), the closed bars since it was confirmed, and x1, x2, x3 ... for the oscillators that agree, for example "BULL 3 x3".
- A brighter cell when the divergence is recent (you set how many bars count as fresh).
- A tooltip with the oscillators' names and the time. Click a cell to open that symbol and timeframe.
How a divergence is found
- Pivots on price: a swing low has 5 higher lows before it and 3 bars after it that are not lower. Both numbers are adjustable. Swing highs mirror it.
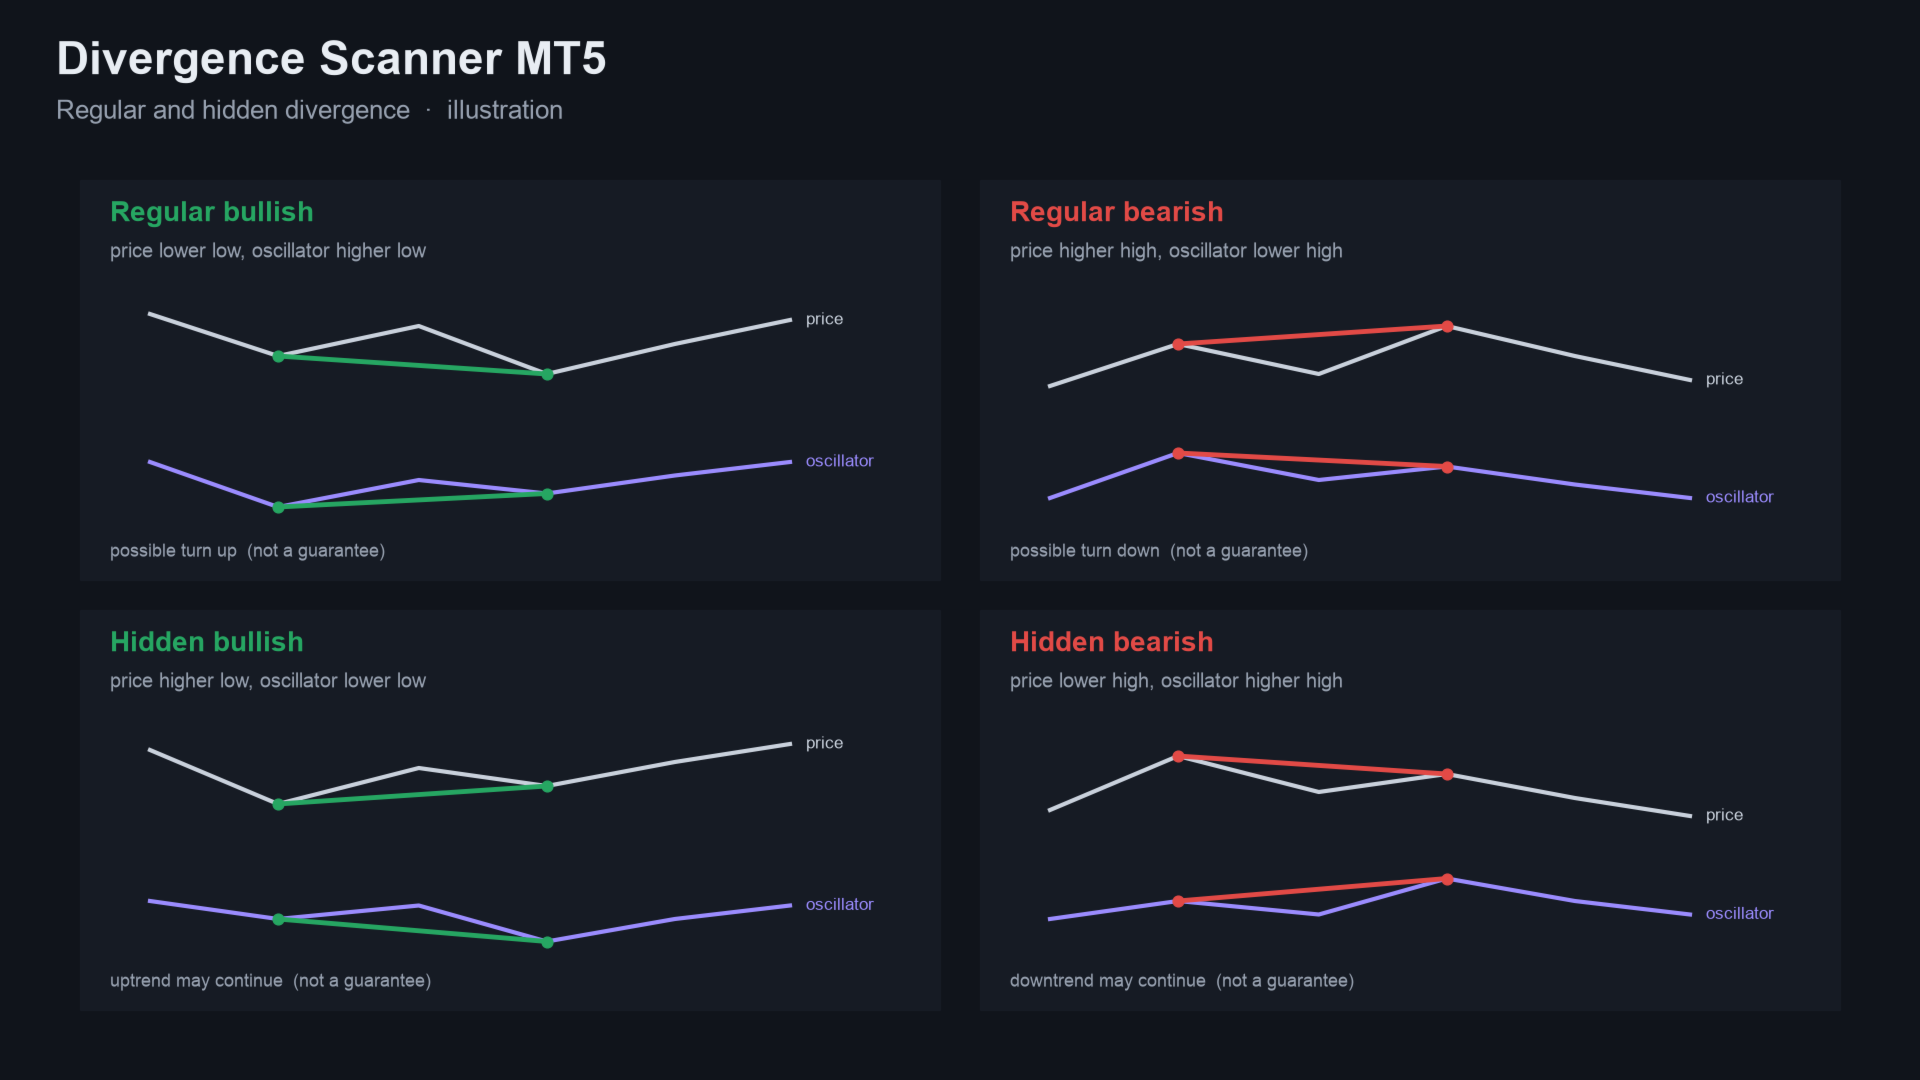
- Regular: price makes a lower low (or higher high) while the oscillator does the opposite. Hidden (optional): price makes a higher low (or lower high) while the oscillator makes a lower low (or higher high).
- The two pivots must be 5 to 60 bars apart. With clean lines on, no bar between them may cross the line on price or on the oscillator.
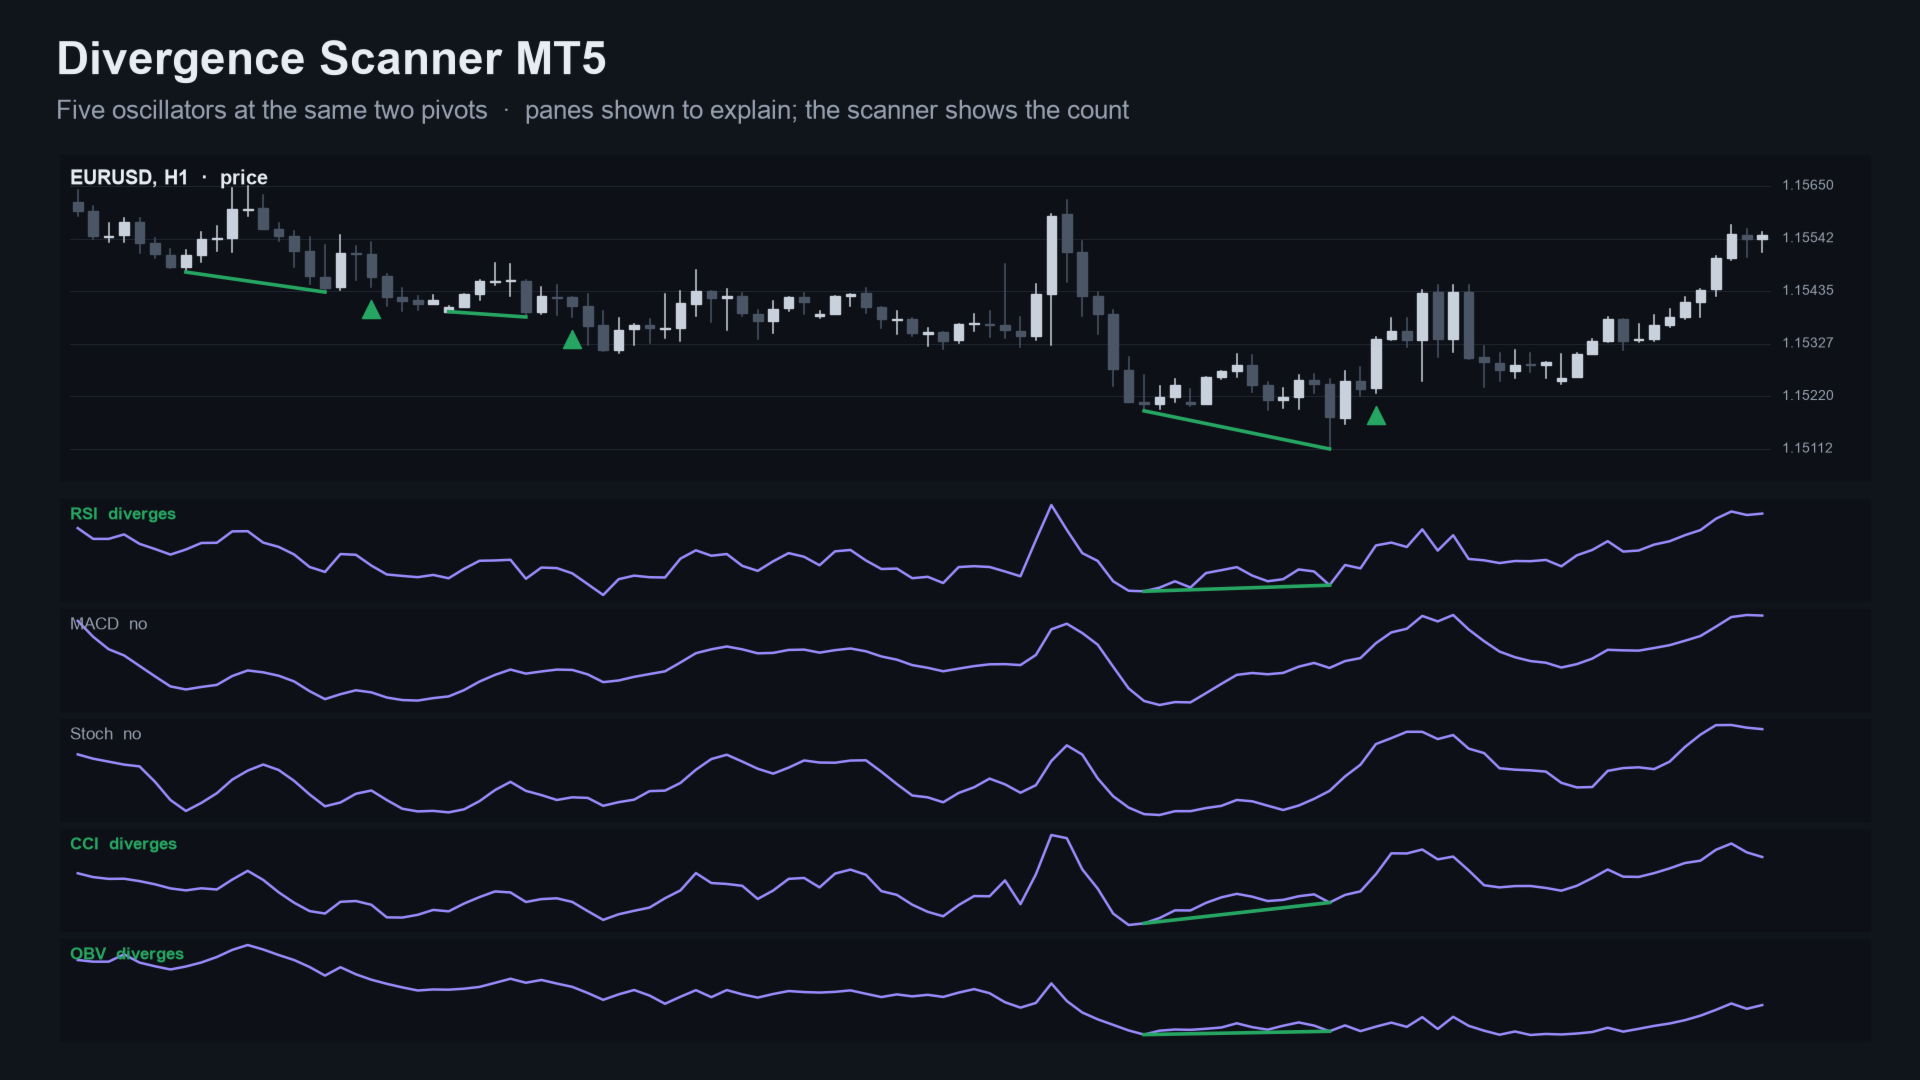
- Each of the five oscillators is checked at the same two pivots. The cell shows how many diverged.
- The forming bar is never used, so a cell does not change after its bar has closed.
Who it is for
It is for traders who use divergence on several symbols or timeframes. If you watch one chart with RSI and MACD, the free indicator is enough.
Inputs
| Input | Default |
|---|---|
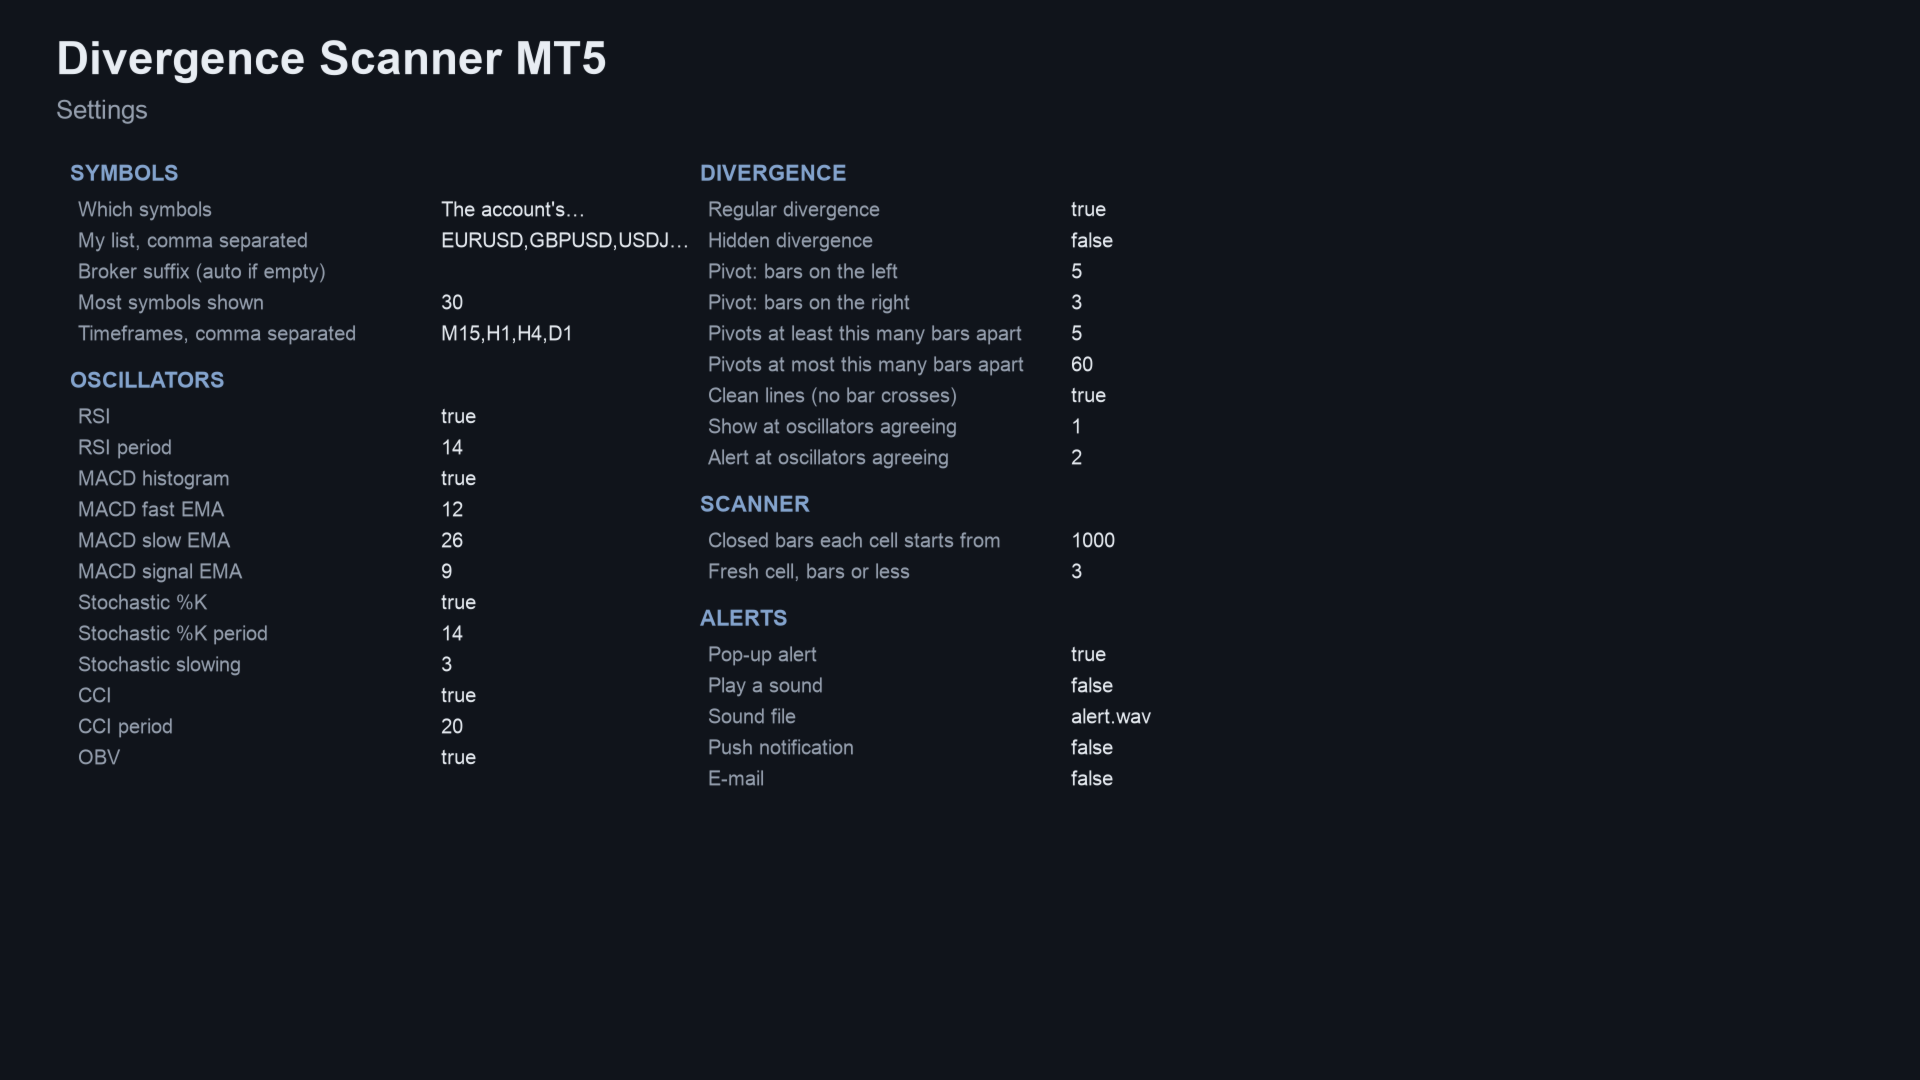
| Which symbols | Market Watch - Market Watch or your own list (broker suffixes are found automatically) |
| Most symbols shown | 30; timeframes - M15,H1,H4,D1 |
| Oscillators | RSI 14, MACD 12/26/9, Stochastic 14/3, CCI 20, OBV - each can be switched off |
| Regular / hidden | on / off; pivot bars left / right - 5 / 3; pivots 5 to 60 bars apart; clean lines - on |
| Show a divergence when at least | 1 oscillator; alert when at least - 2 |
| Closed bars each cell starts from | 1000; fresh cell - 3 bars or less |
| Panel corner, font size, colours; clicking a cell opens the chart (optional template) | - |
| Alerts: pop-up (on), sound, push notification, e-mail | - |
Starting settings
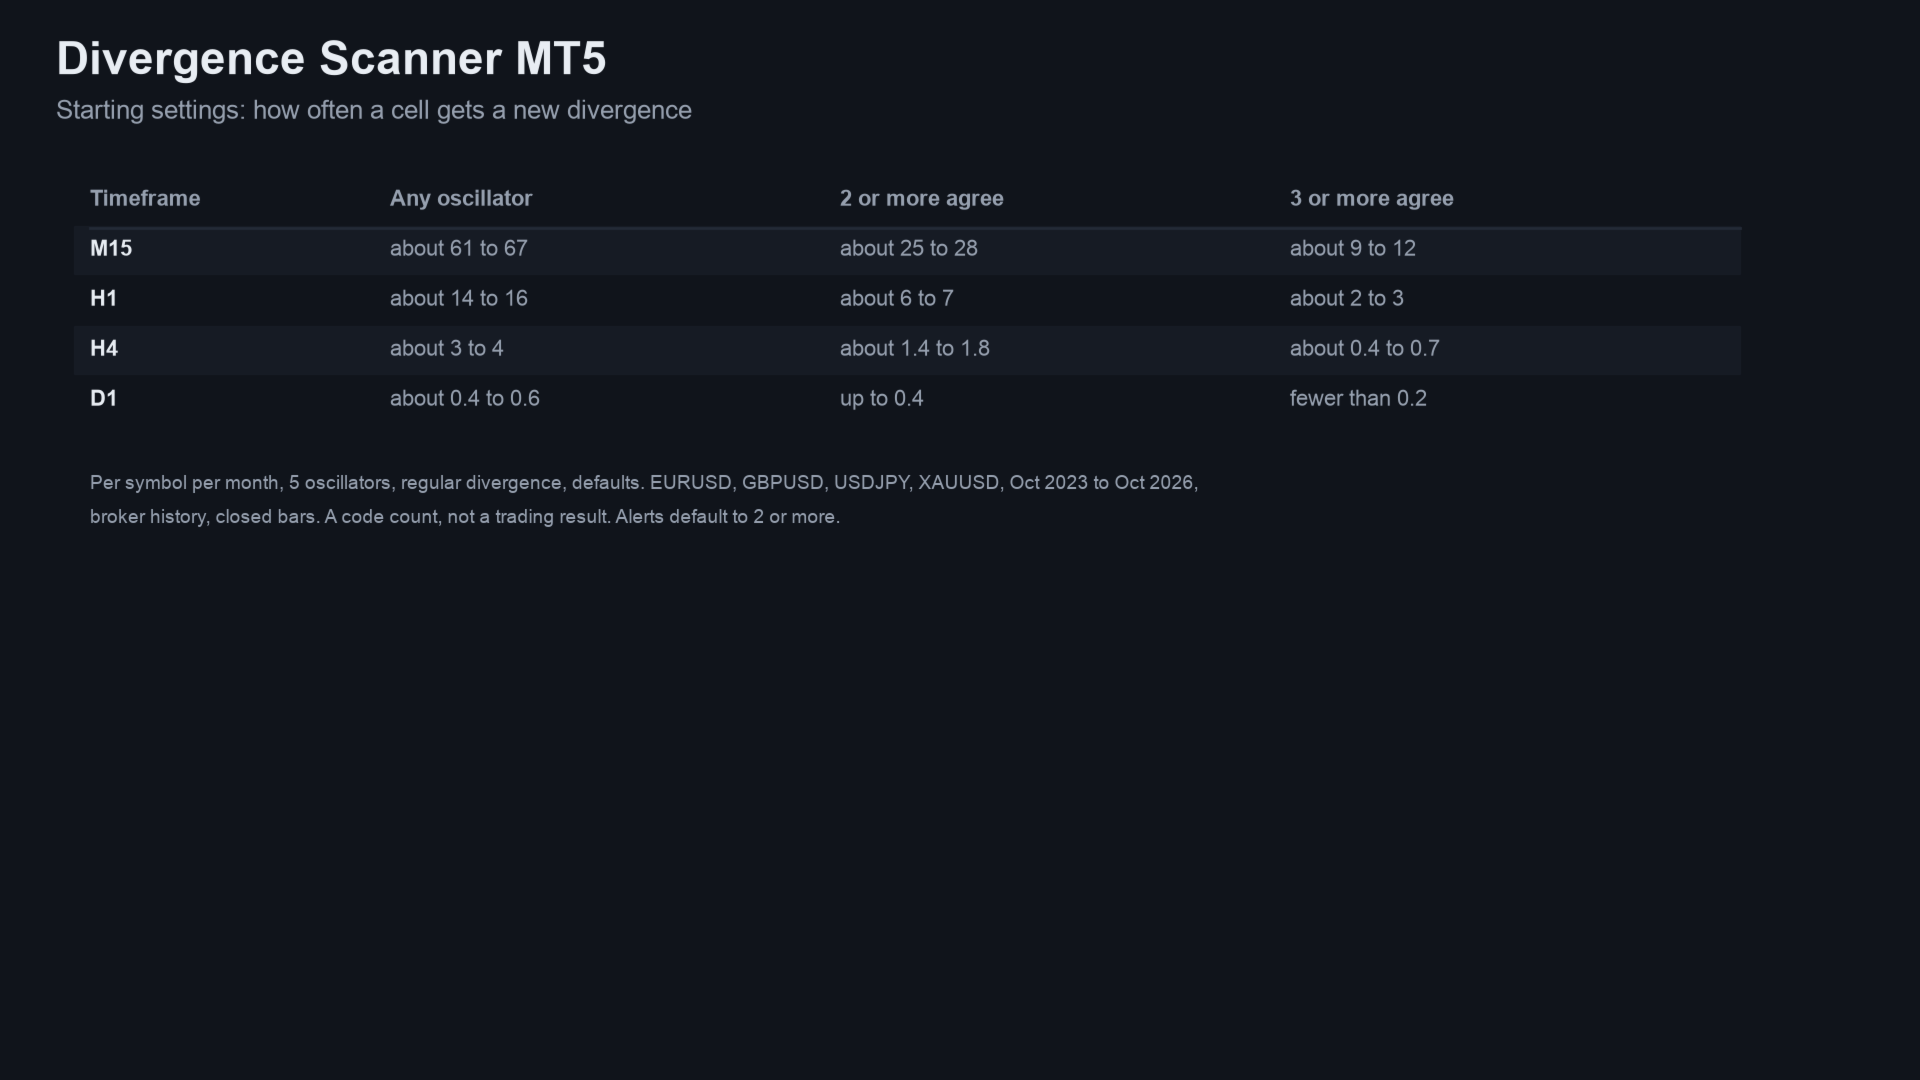
The table shows how often a cell gets a new divergence, per symbol per month, on EURUSD, GBPUSD, USDJPY and XAUUSD, October 2023 to October 2026. It uses closed bars and the defaults. It is a code count, not a trading result.
| Timeframe | Any oscillator | 2 or more agree | 3 or more agree |
|---|---|---|---|
| M15 | about 61 to 67 | about 25 to 28 | about 9 to 12 |
| H1 | about 14 to 16 | about 6 to 7 | about 2 to 3 |
| H4 | about 3 to 4 | about 1.4 to 1.8 | about 0.4 to 0.7 |
| D1 | about 0.4 to 0.6 | up to 0.4 | fewer than 0.2 |
Alerts default to 2 or more oscillators. Raise it for fewer signals. Agreement is not a promise of a turn.
How it was checked
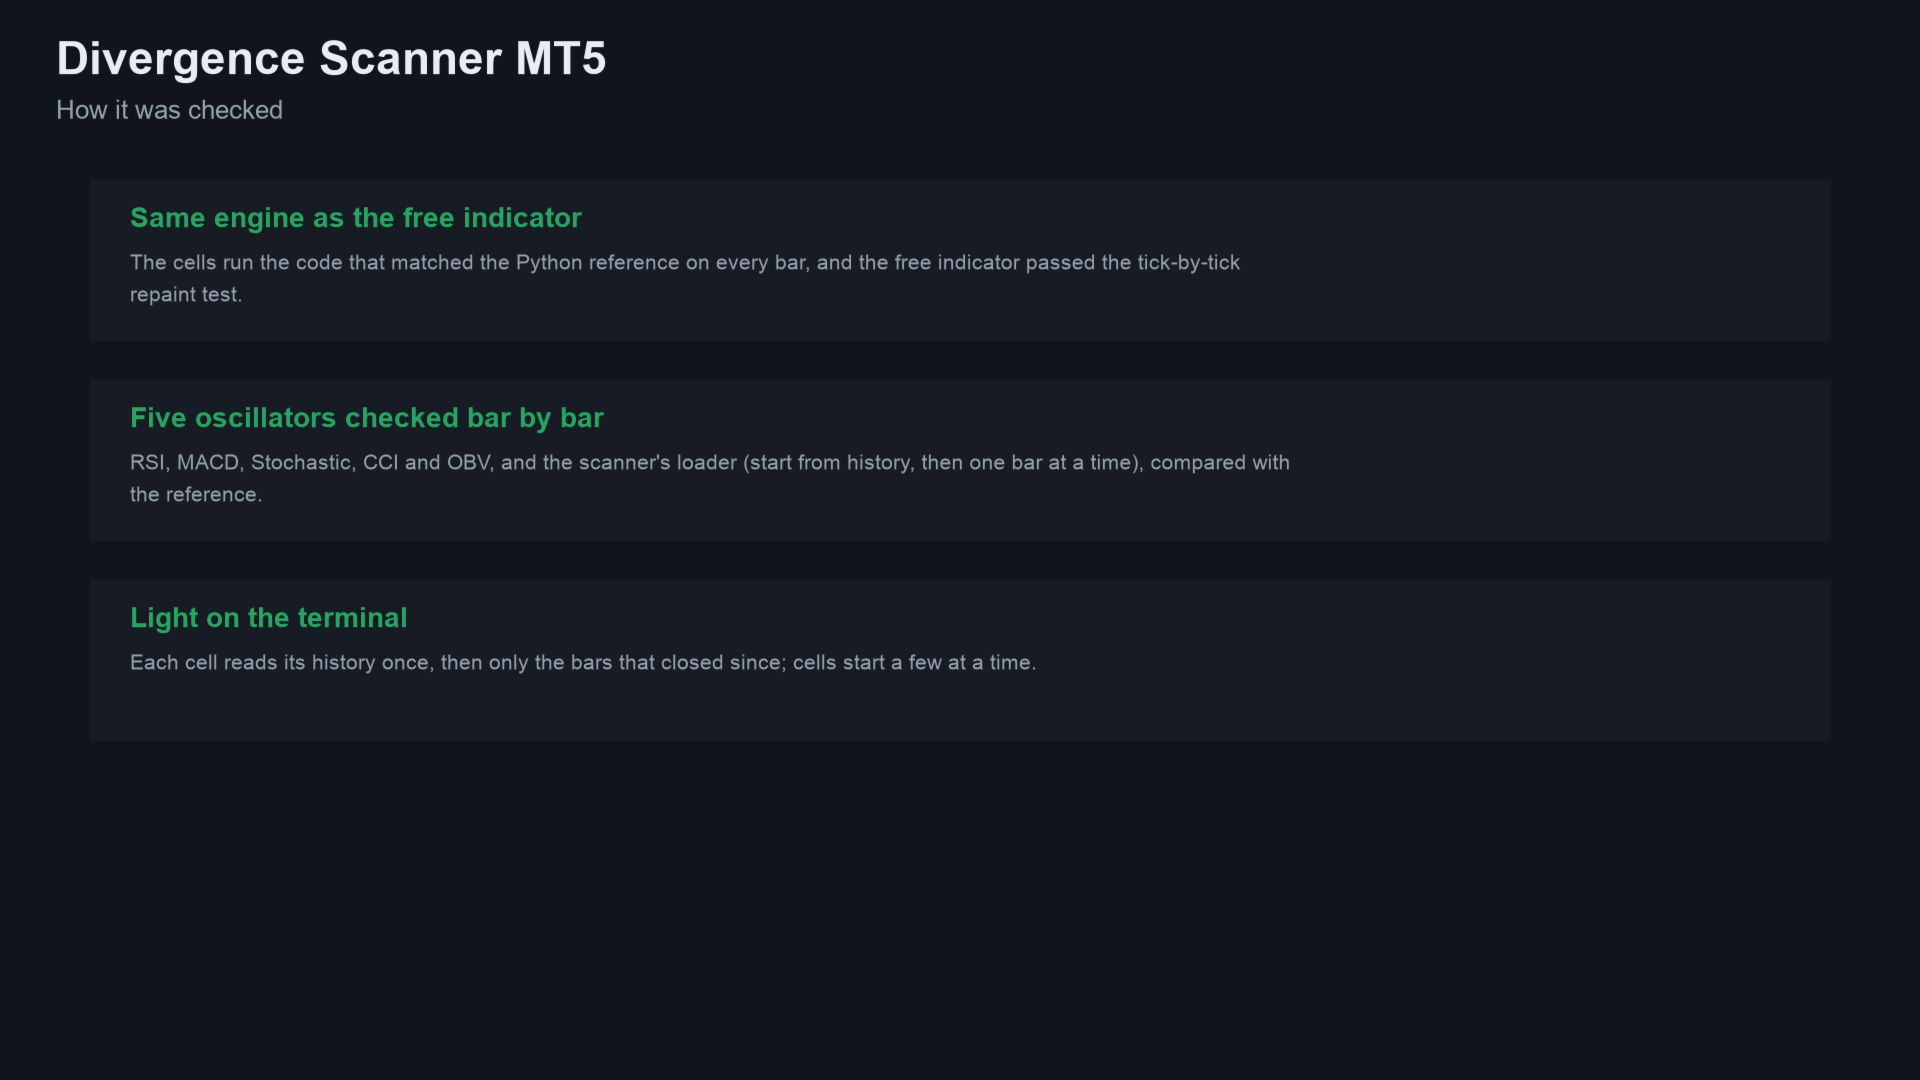
- The divergence engine is the one in the free indicator. It matched an independent Python calculation on every bar. It also passed a tick-by-tick repaint test in the Strategy Tester (XAUUSD H1, 91 million ticks, 0 changed signals).
- Stochastic, CCI, OBV and the scanner's loader (starting a cell from history, then one bar at a time) were compared with the same Python calculation.
- The frequency table comes from that calculation on broker history. No trading results are claimed.
Alerts and Expert Advisors
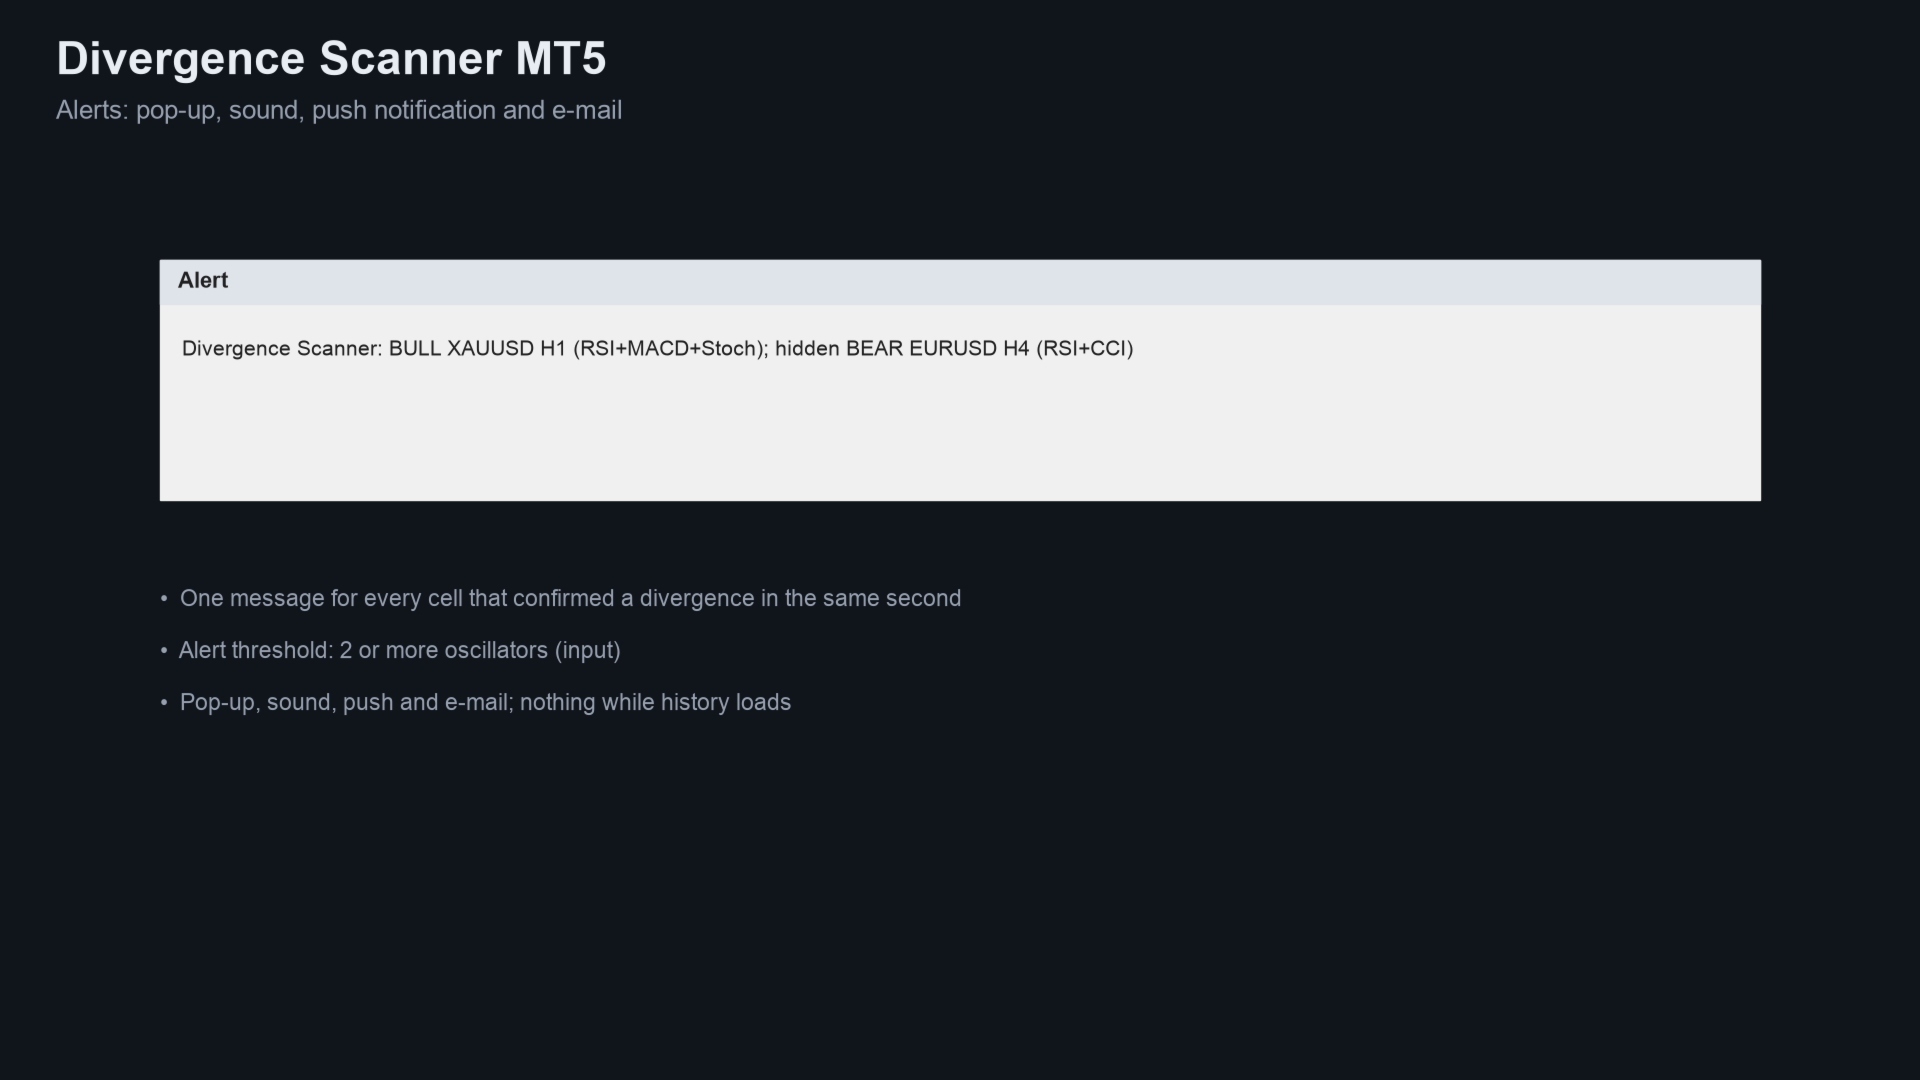
Alerts: pop-up (on), sound, push notification and e-mail, each switched separately. Cells that confirm a divergence in the same second are sent as one message. Nothing is sent while history loads. Nothing is sent twice for the same cell and bar, or in the Strategy Tester.
Buffer 0 holds the number of fresh bullish cells, buffer 1 the number of fresh bearish cells, on the newest bar.
Related products
- Divergence Signal Alerts - the free indicator. It draws RSI and MACD divergences on one chart, using the same engine.
- Candlestick Scanner MT5 - another scanner panel with symbols by timeframes, closed bars only and click-to-open, for candlestick patterns.
- All my products on MQL5
Questions
- Does it repaint? No. Cells use closed bars only.
- Why does a cell say "BULL 3"? The divergence was confirmed 3 closed bars ago. The pivot itself formed 3 bars before that (the right-side pivot bars).
- Does it work on gold and crypto? Yes, on any symbol with history. OBV uses tick volume.
- Alerts on my phone? Yes, with push set up in the terminal. The terminal must be running.
- How is it different from the free indicator? It uses the same engine. The free indicator draws RSI and MACD divergences on one chart. The scanner covers many symbols and timeframes, with five oscillators and a count of how many agree.
If you find it useful, a short review on this page helps other traders find it.
Questions: use the comments on this page or send me a message on MQL5.
Trading involves risk. The scanner shows a technical pattern; it does not predict the market, and past signals may not repeat.