UT Bot Scanner MT5
- 指标
- 版本: 1.0
- 激活: 5

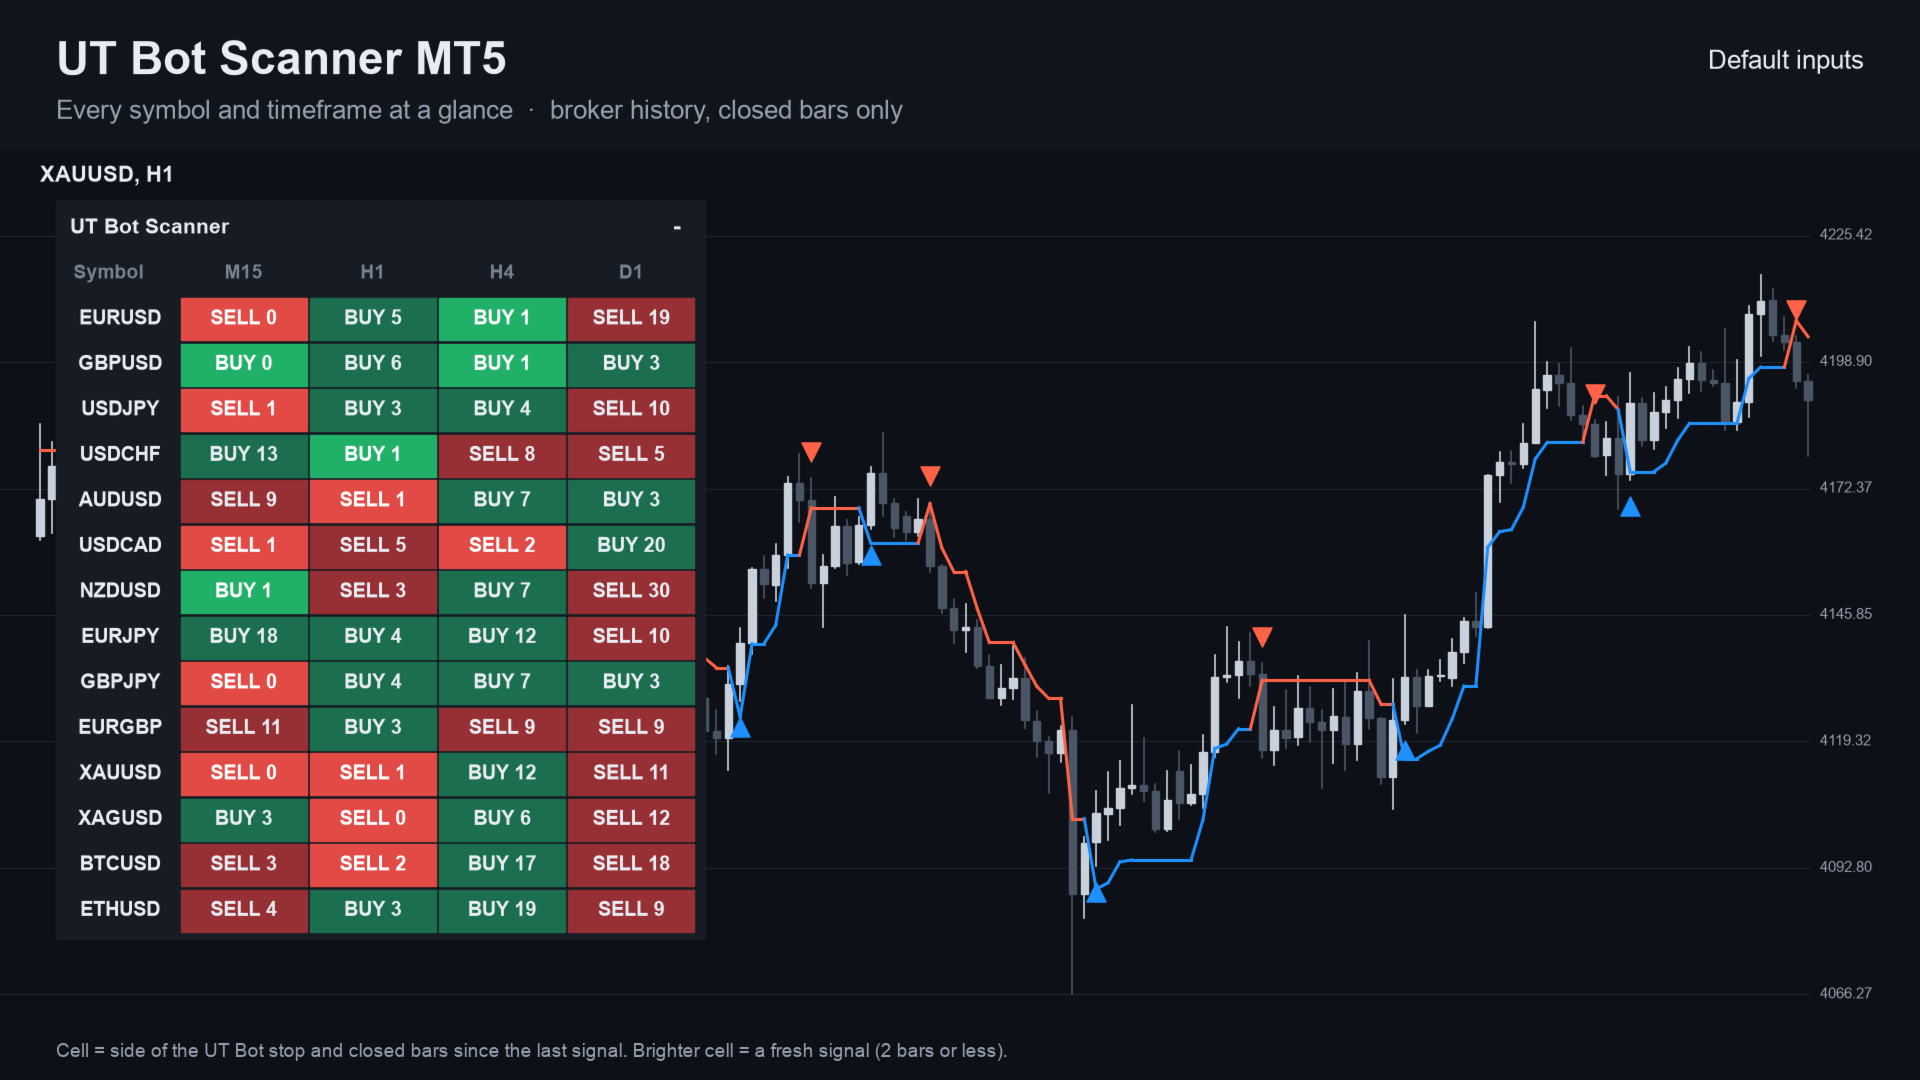
UT Bot Scanner MT5 is a scanner indicator for MetaTrader 5. One panel shows the UT Bot buy or sell side of many symbols and timeframes, and sends an alert when a new signal appears.
The calculation is the same as in the free UT Bot Signal Alerts indicator, which covers one chart. The scanner runs it for a whole list, so you need not flip through charts.
What you see on the chart
- A panel with symbols as rows and timeframes as columns
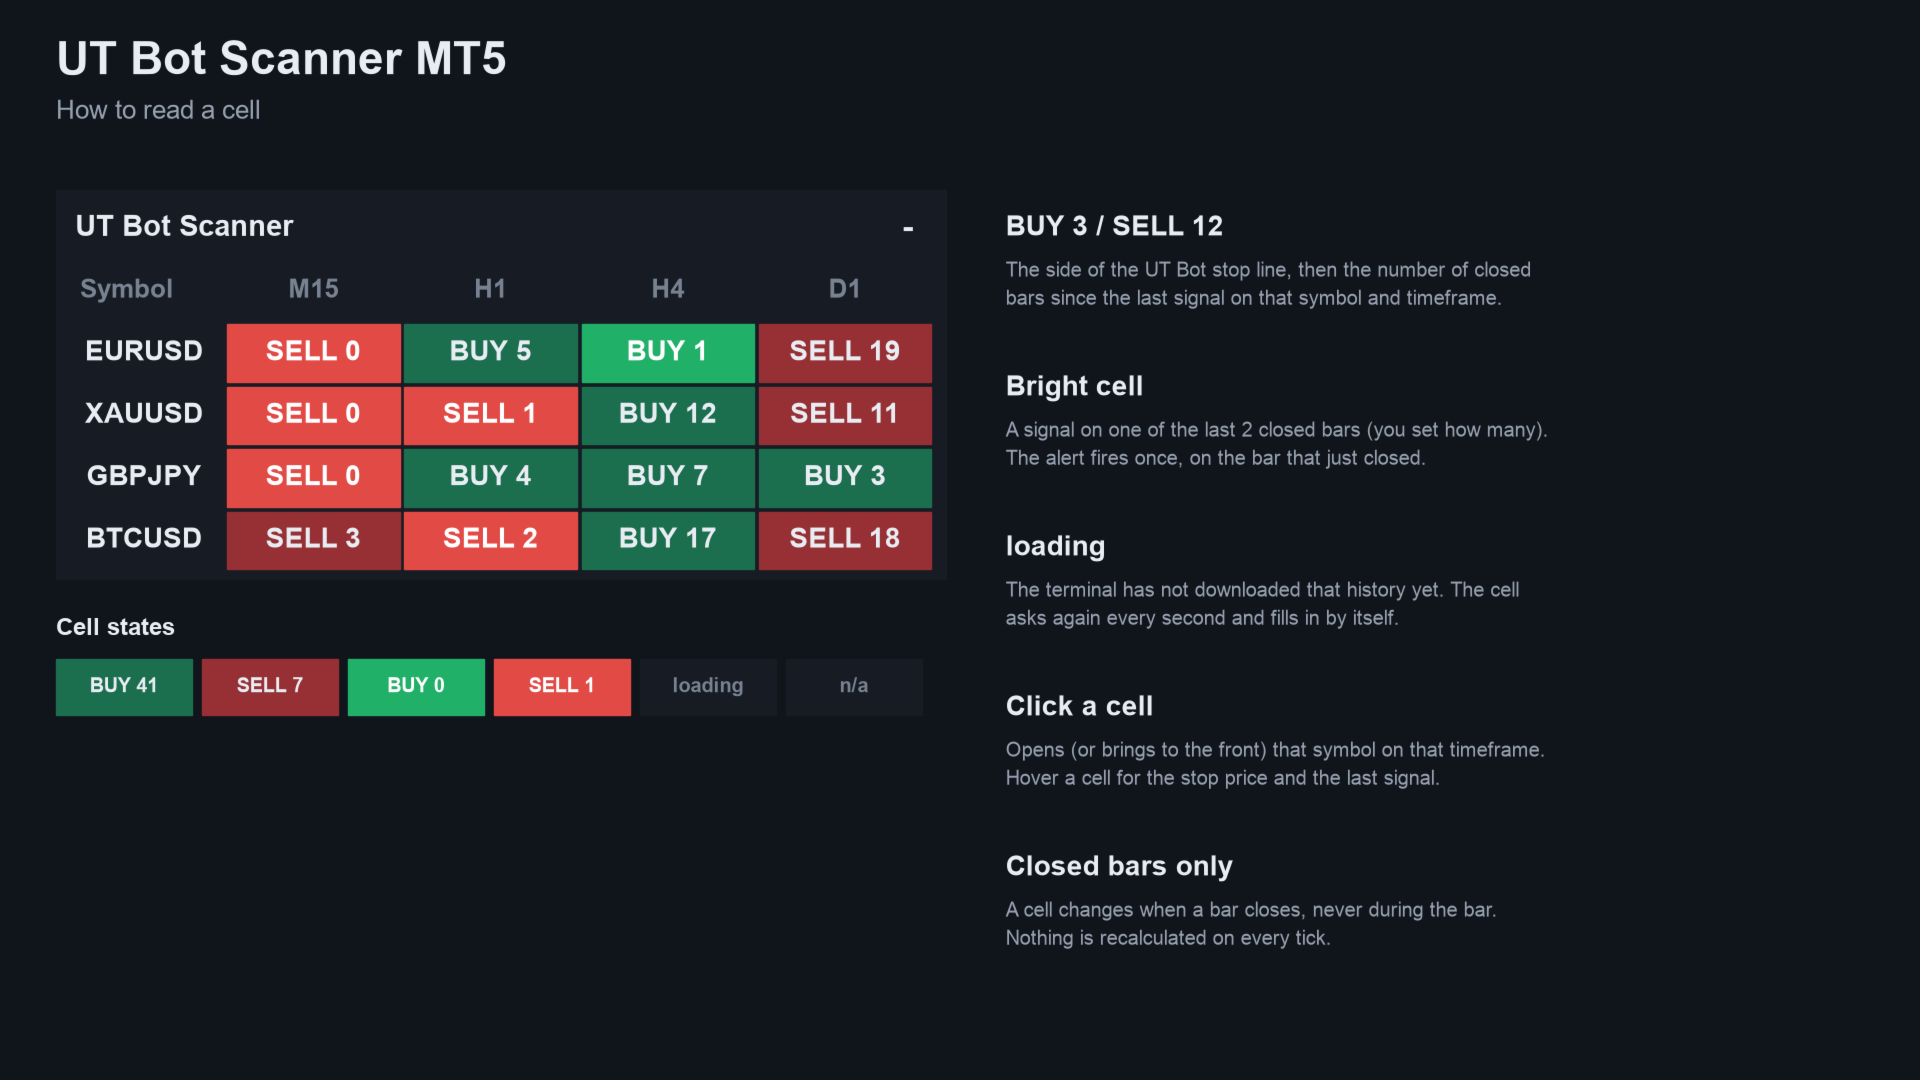
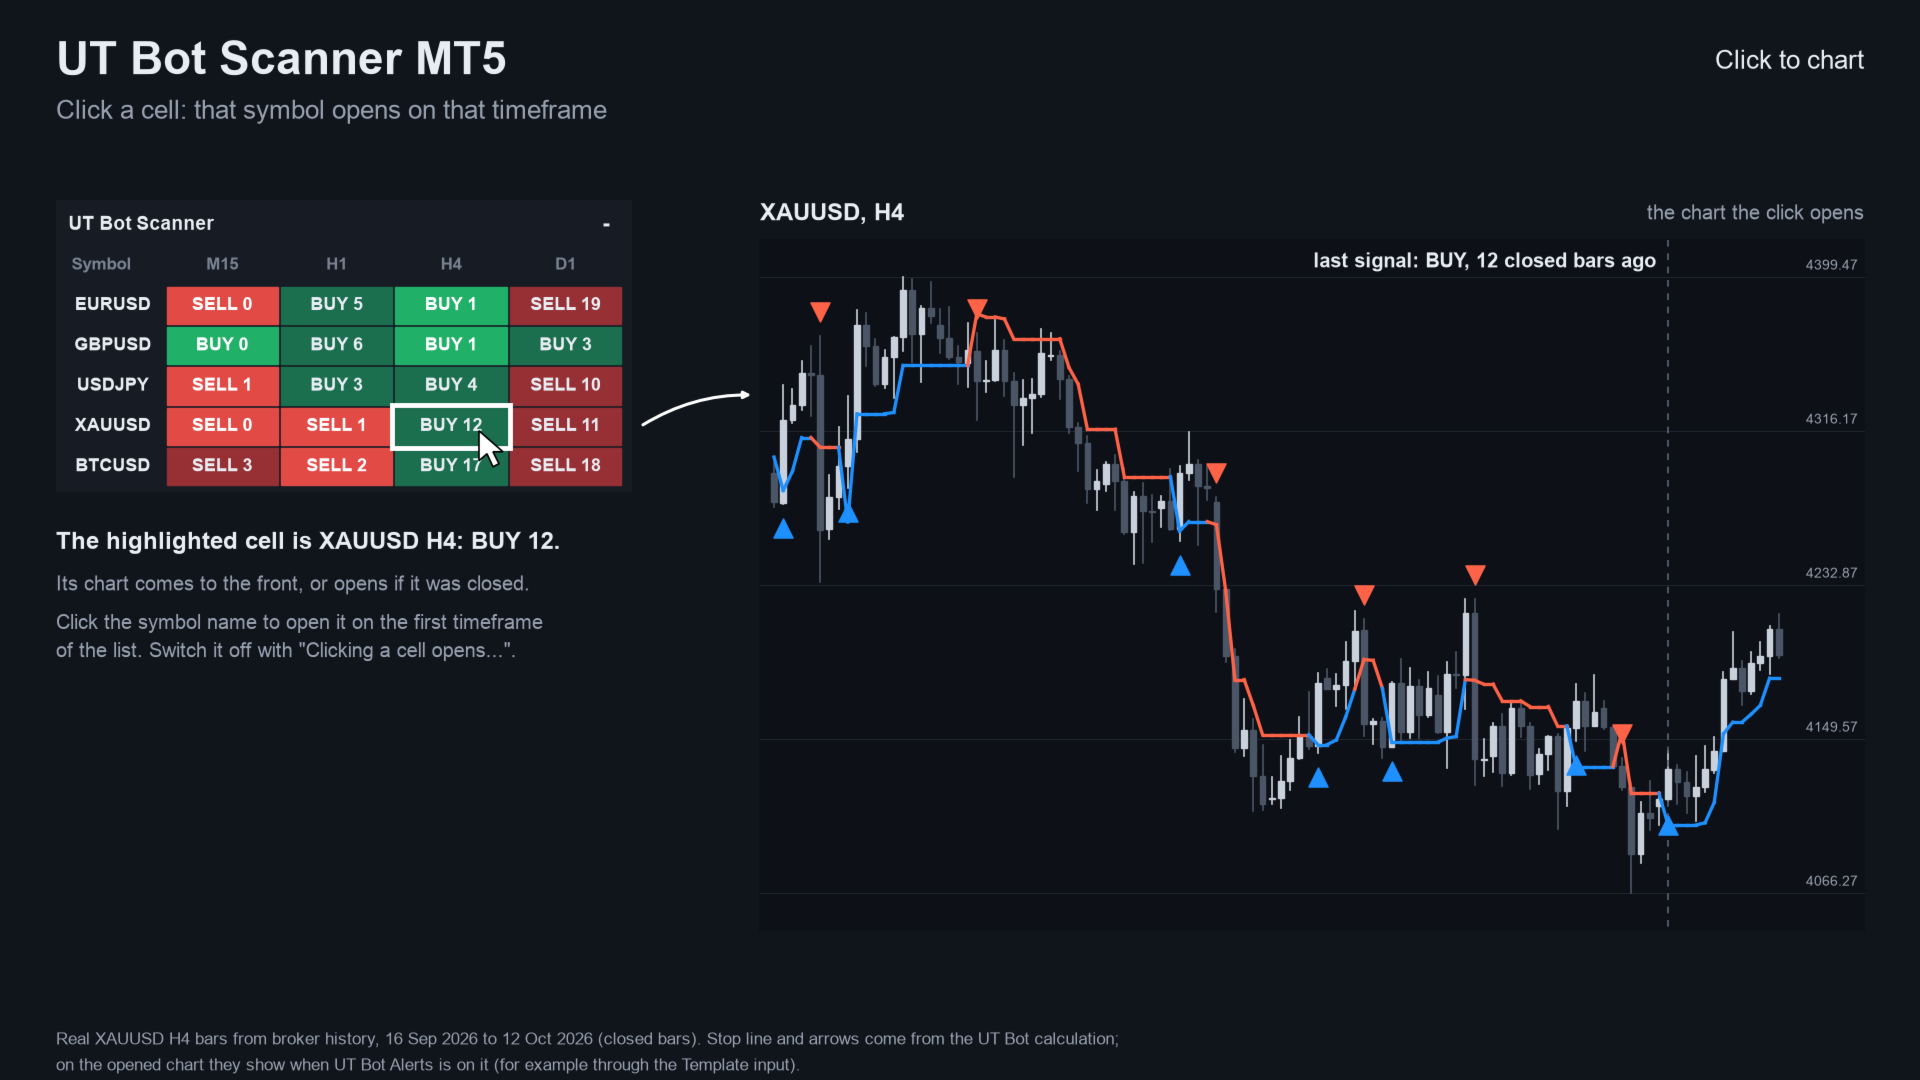
- In each cell: BUY or SELL, and how many closed bars ago the last signal came, for example "BUY 3"
- A brighter cell when the last signal is recent (you set how many bars count as fresh)
- Click a cell to open that symbol and timeframe
How a signal is built
- The stop line is the close minus key value times ATR while price is above it, and plus while price is below it. It only moves with the trend.
- A buy signal is a close above the stop line, a sell signal is a close below it.
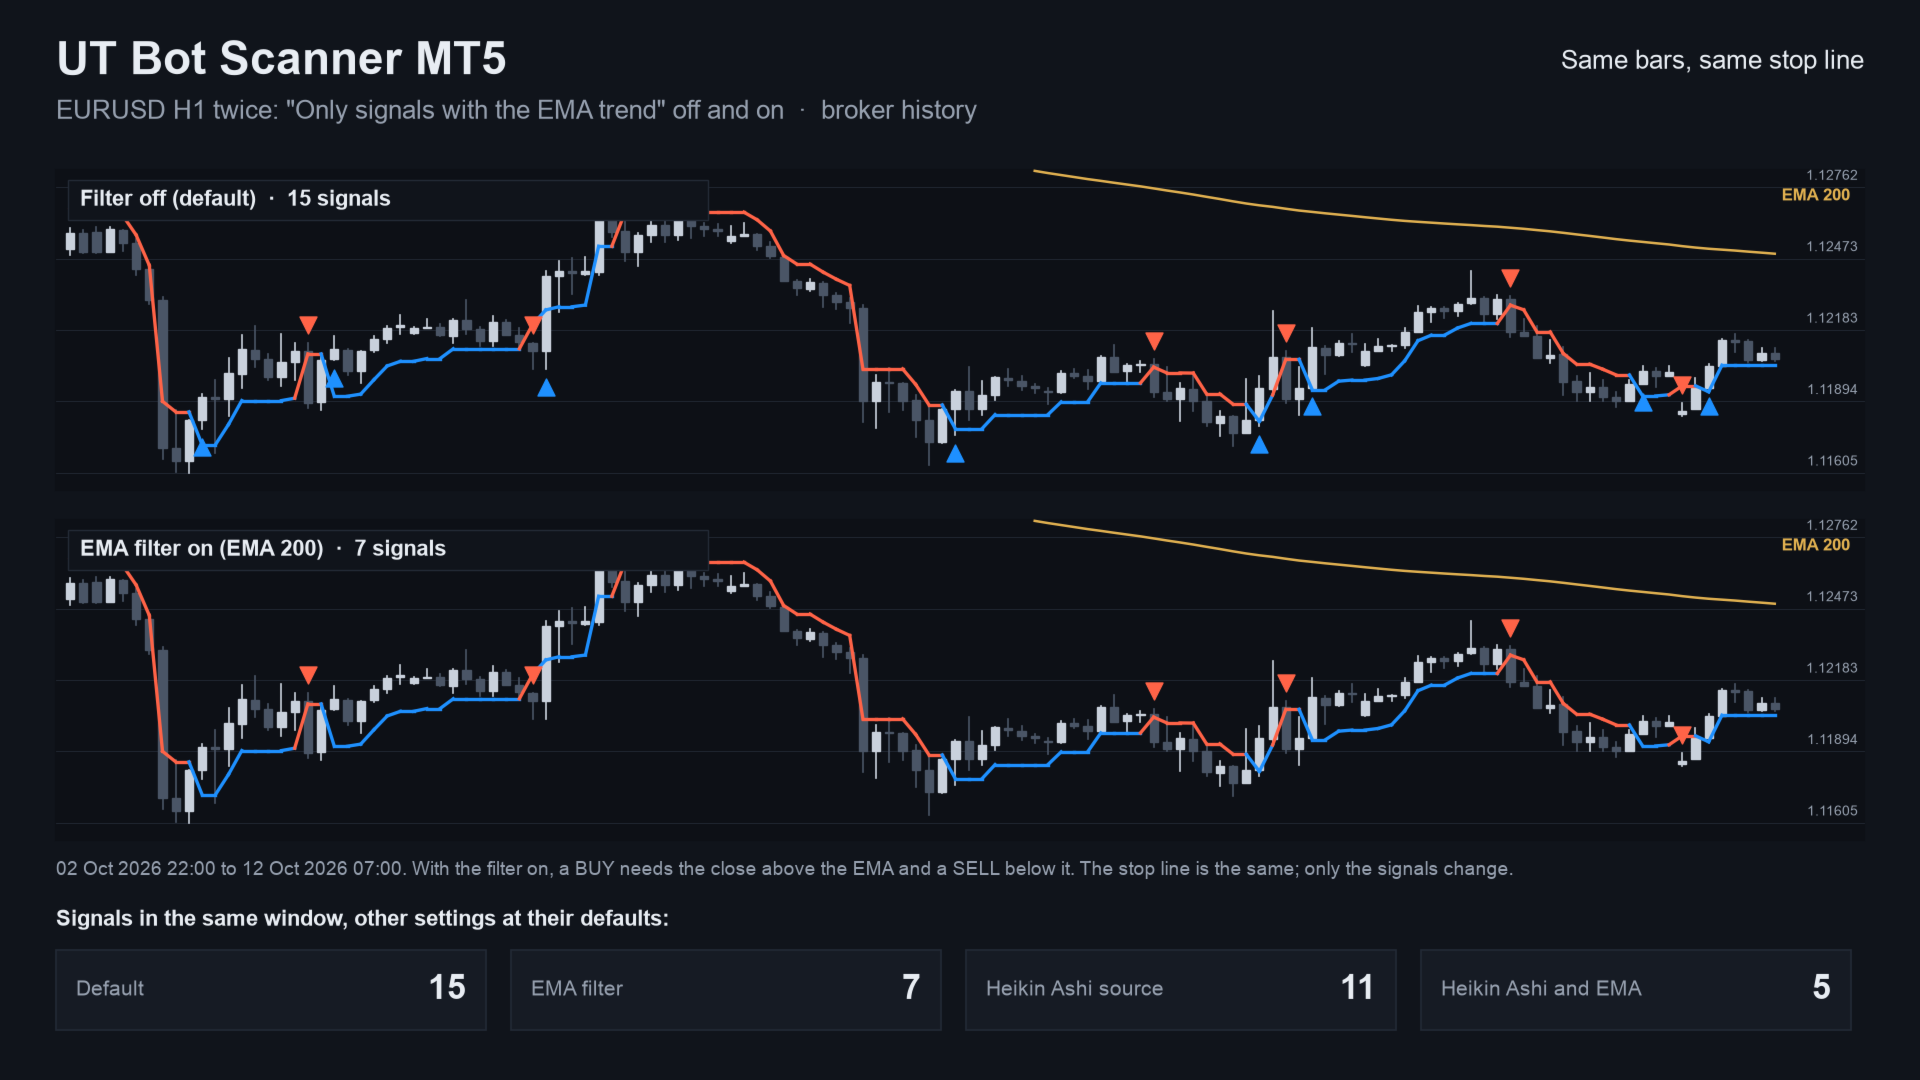
- The ATR is Wilder's, as on TradingView. Options: Heikin Ashi source, and an EMA filter.
- The forming bar is never used, so a cell does not change after its bar has closed.
Who it is for
For traders who use the UT Bot rule on several symbols. If you watch one chart, the free UT Bot Signal Alerts is enough. It places no orders.
Inputs
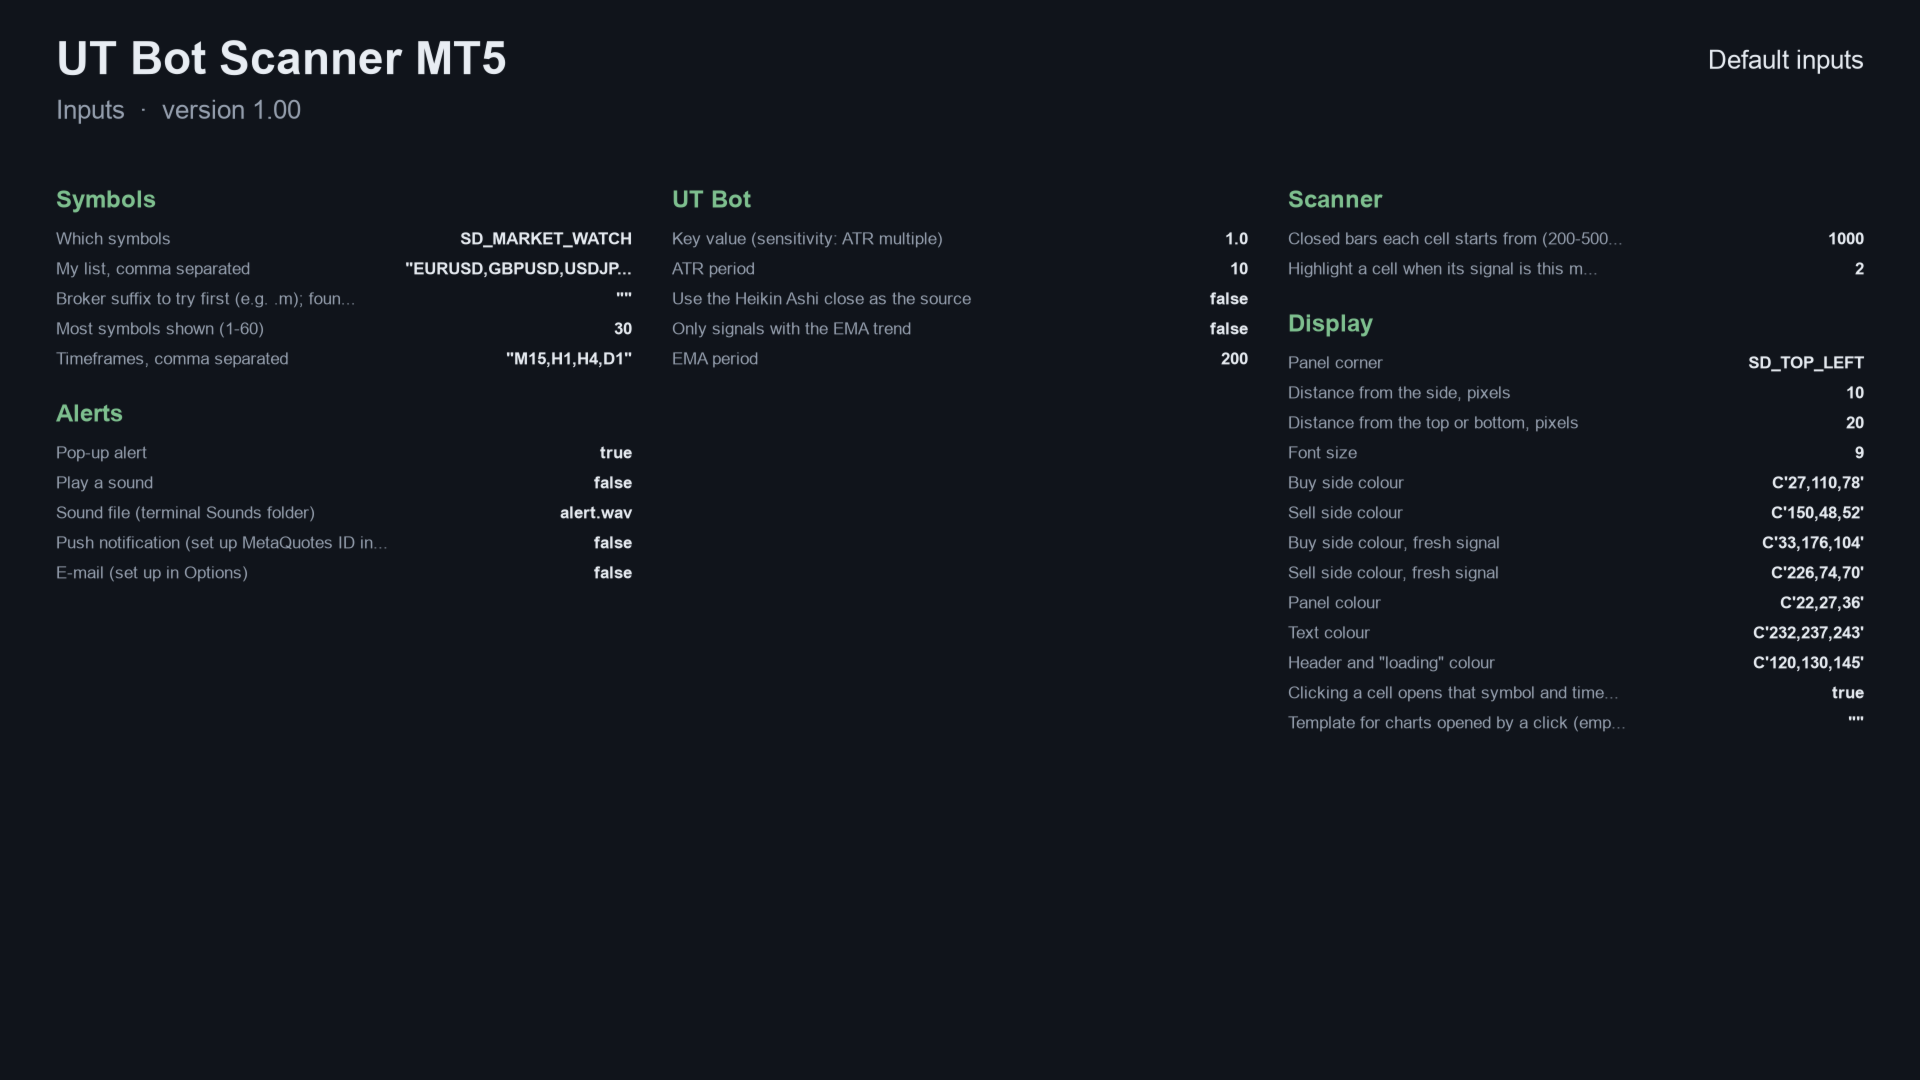
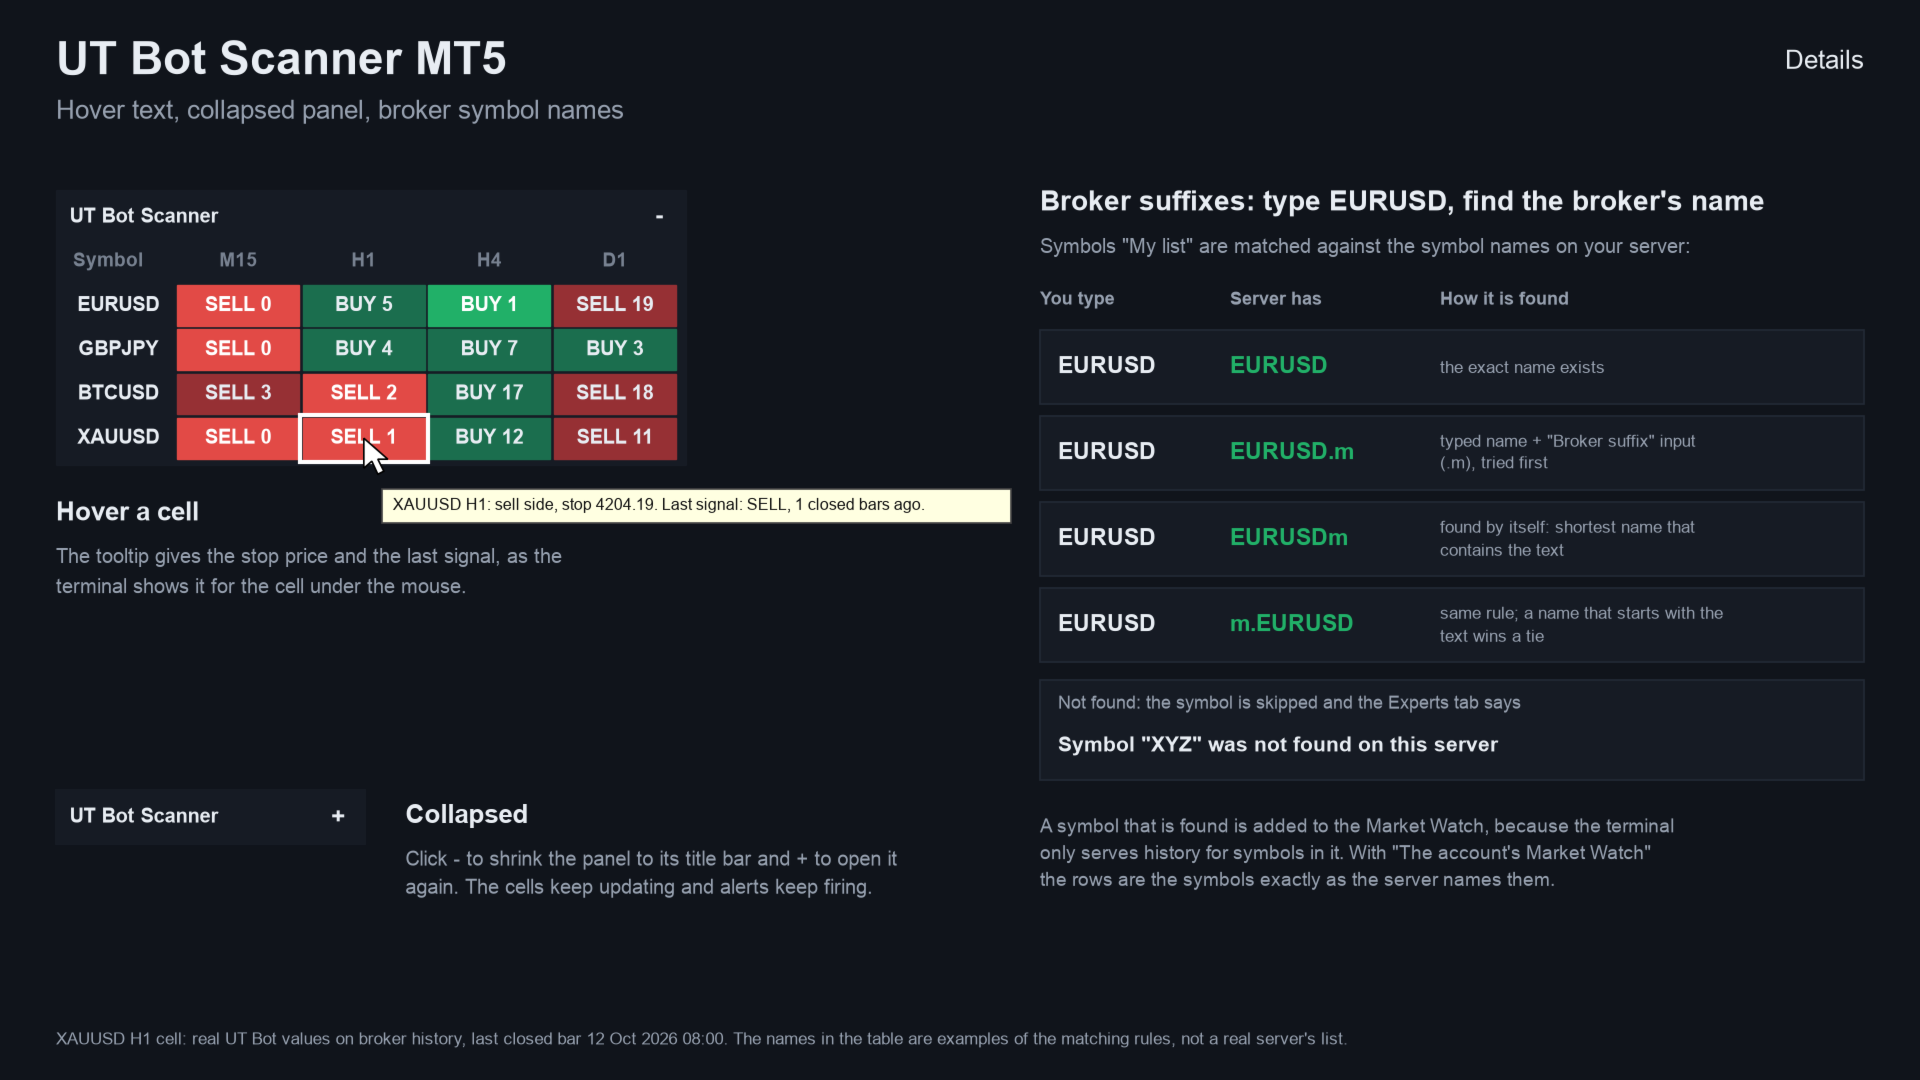
- Which symbols - Market Watch - Market Watch or your own list
- My list - EURUSD,GBPUSD,USDJPY,XAUUSD,BTCUSD - used when "My list" is chosen
- Most symbols shown - 30 - from 1 to 60
- Timeframes - M15,H1,H4,D1 - columns of the panel, comma separated
- Key value - 1.0 - ATR multiple; higher gives fewer signals
- ATR period - 10 - length of the ATR
- Heikin Ashi source - off - use the Heikin Ashi close
- EMA filter / EMA period - off / 200 - only signals on the side of the EMA
- Closed bars each cell starts from - 1000 - history read once, then updated
- Highlight a signal up to this many bars old - 2 - brighter cell
Alerts and Expert Advisors
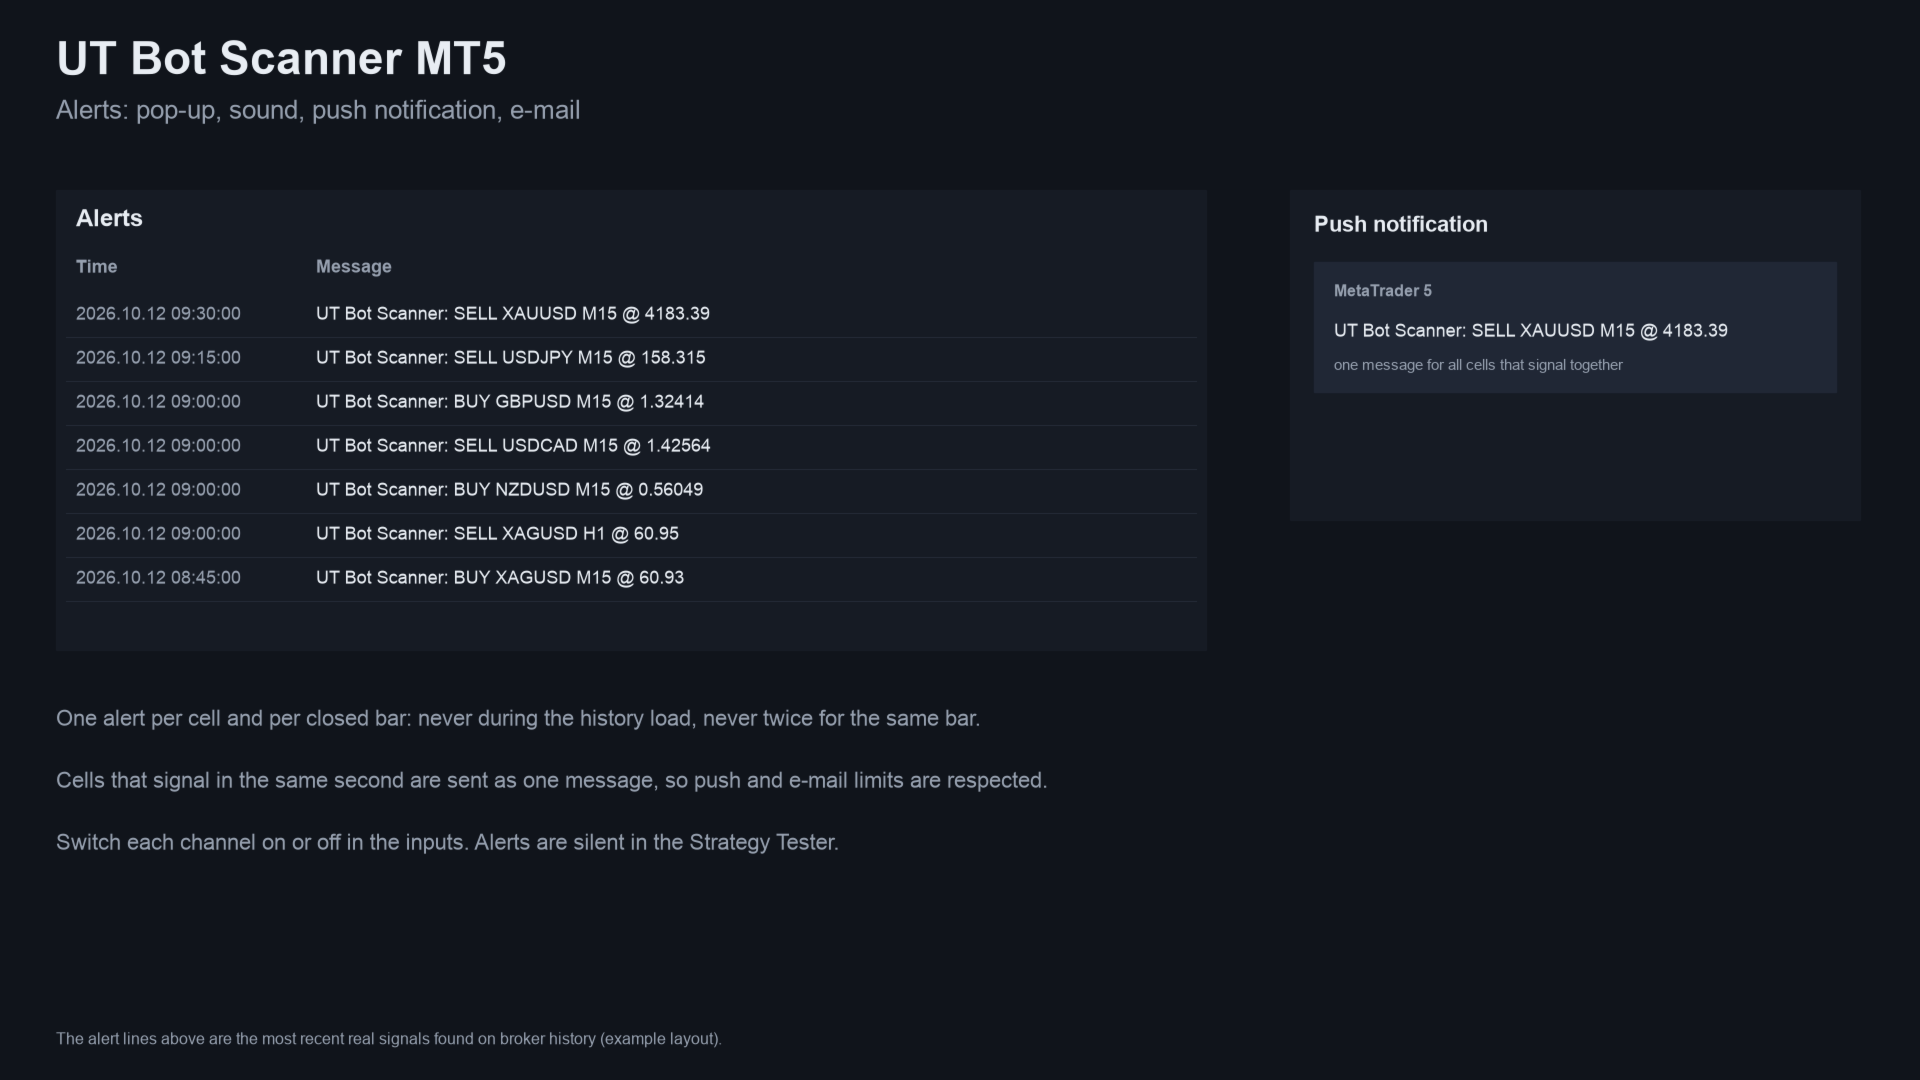
Alerts: pop-up (on), sound, push notification and e-mail, each switched separately. Nothing is sent while history loads, never twice for the same cell and bar, and not in the Strategy Tester.
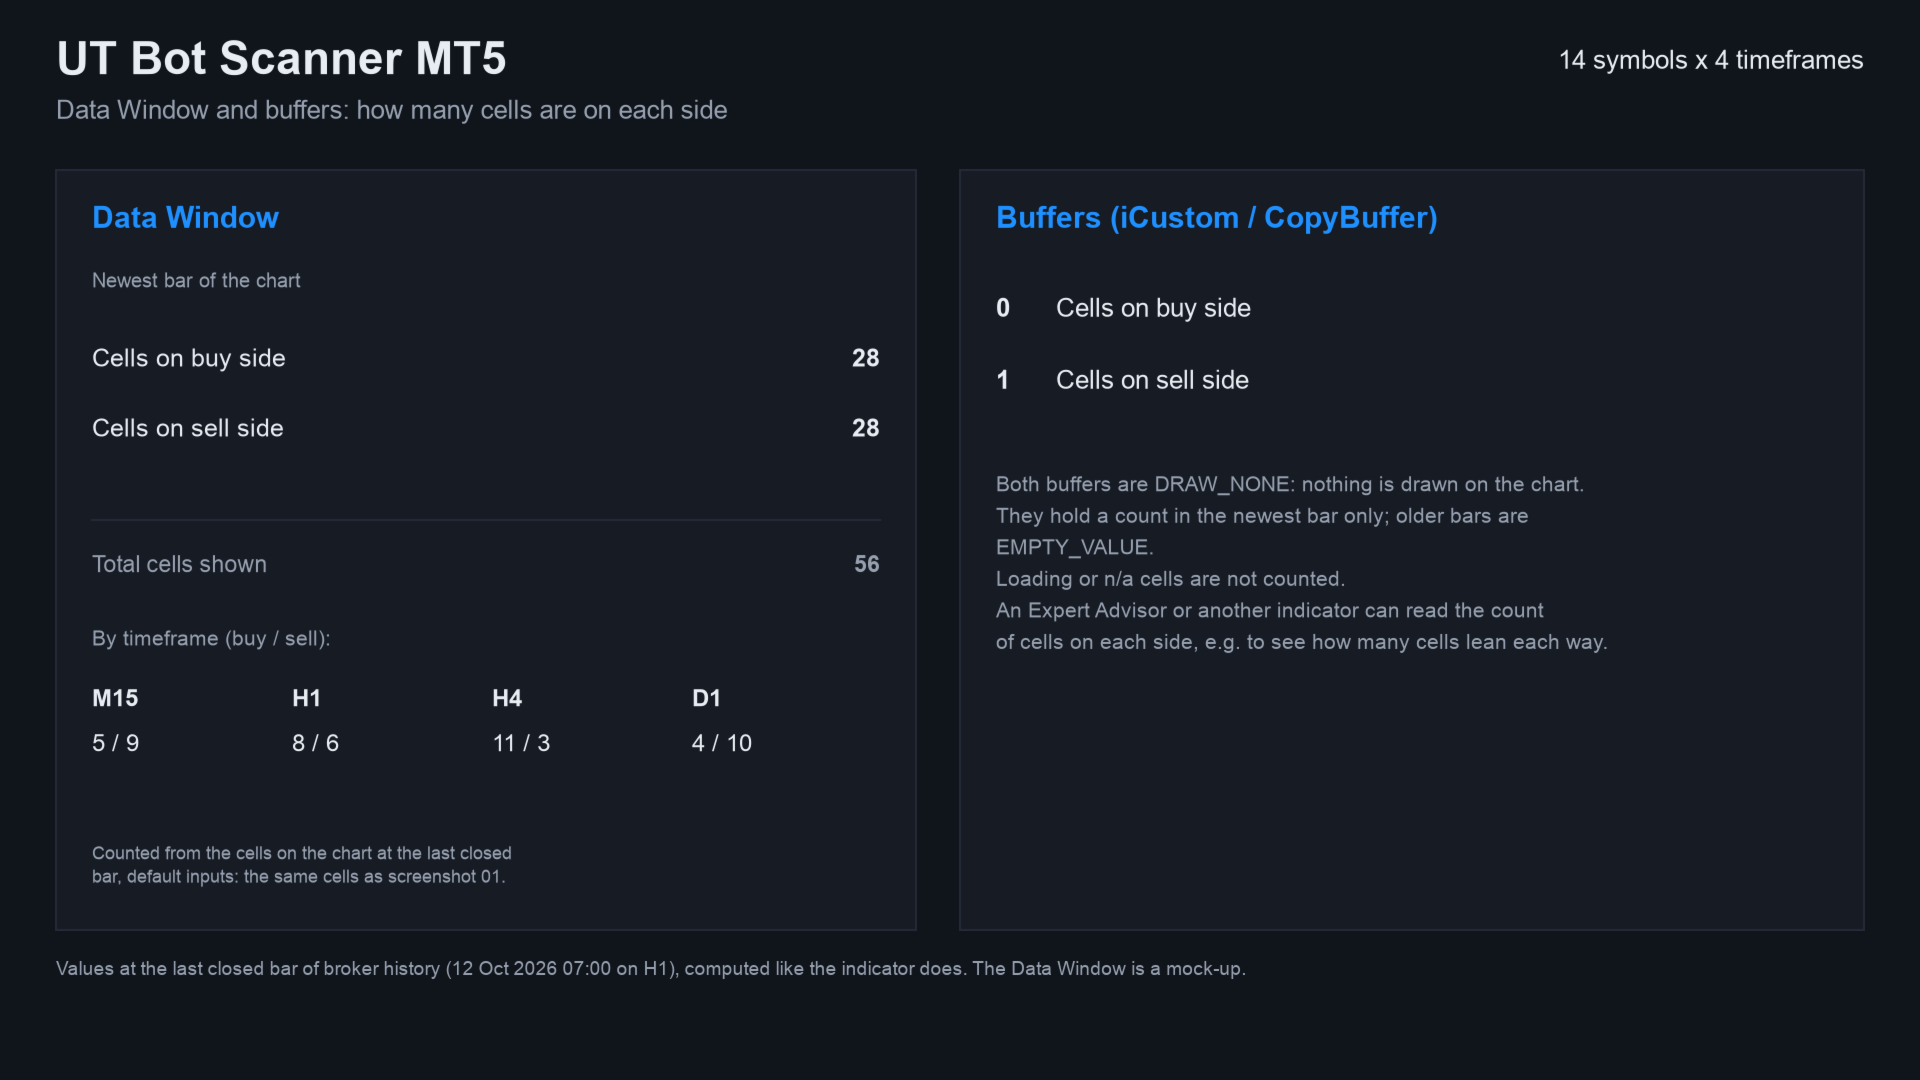
Buffer 0 holds the number of cells on the buy side, buffer 1 the number on the sell side, on the newest bar.
Starting settings
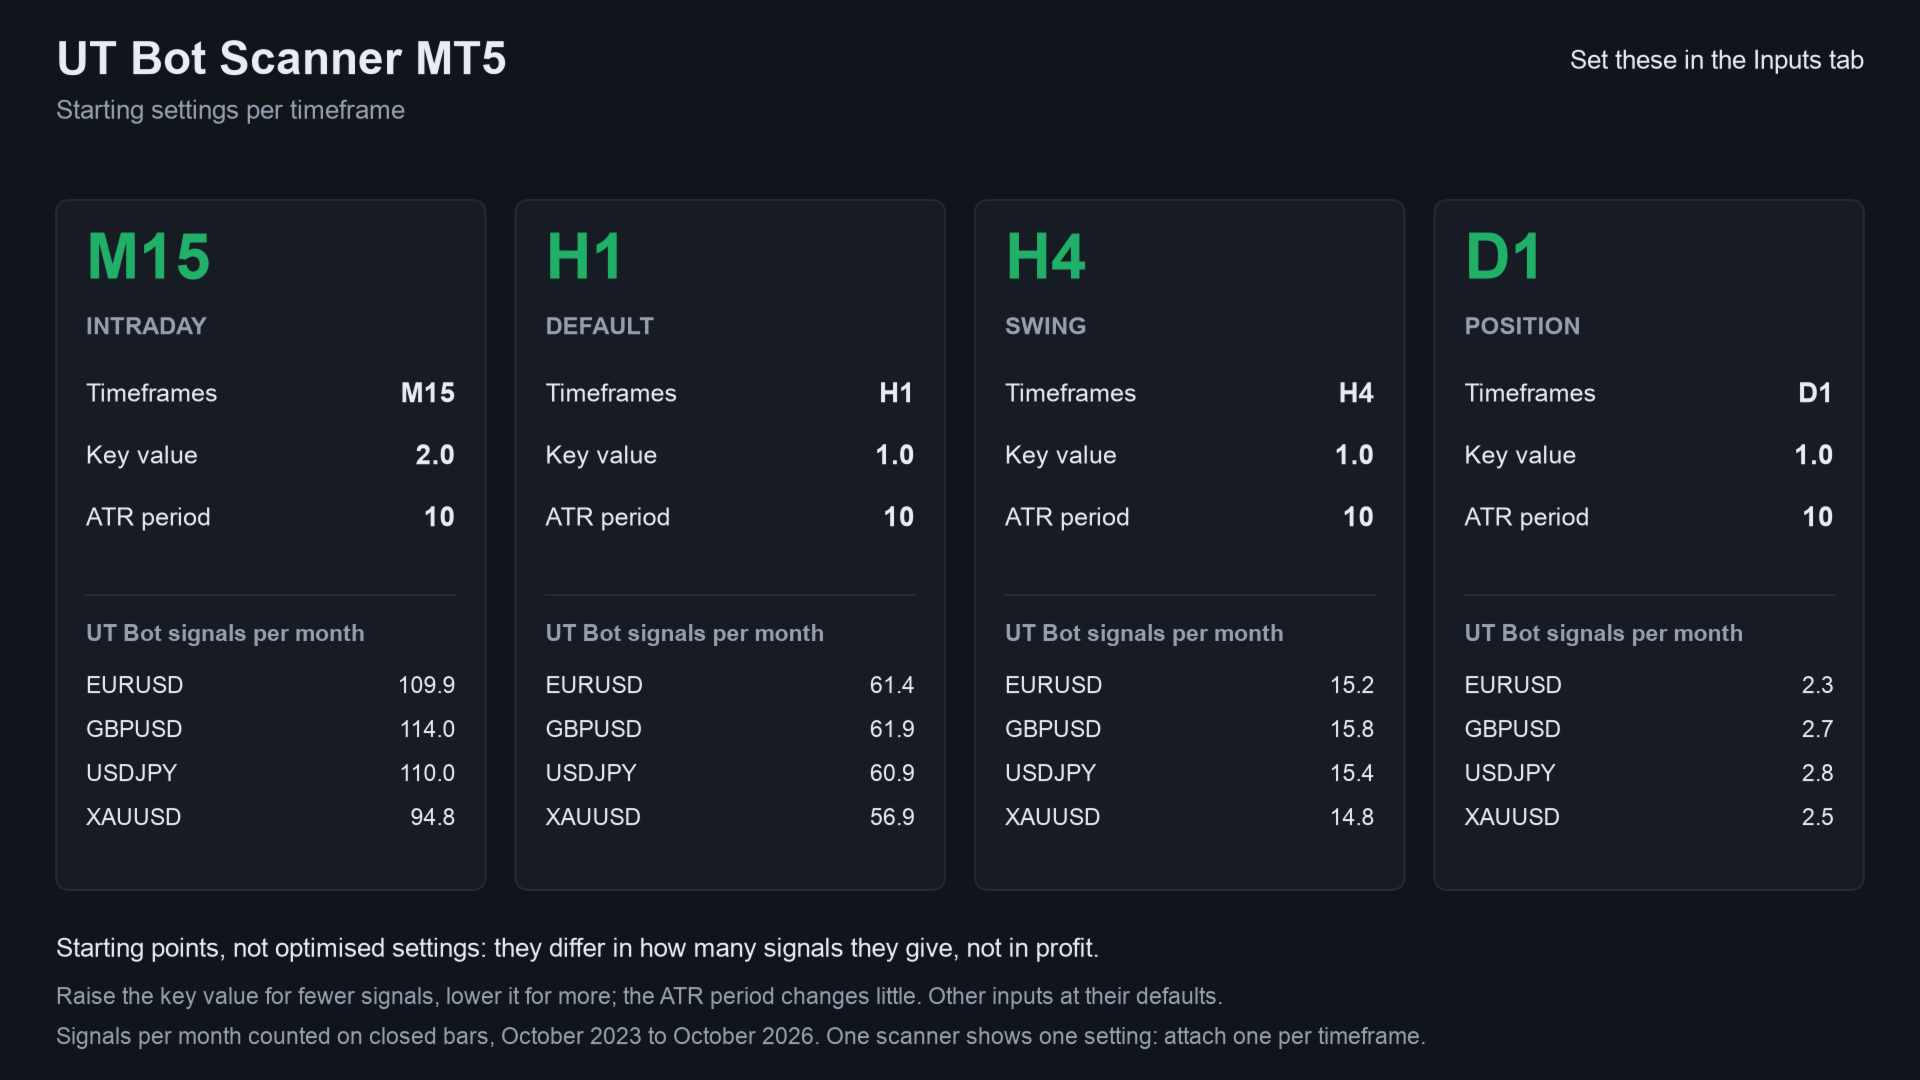
Four starting points. They differ in how many signals they give, not in profit, and none is optimised. UT Bot signals per month on EURUSD, GBPUSD, USDJPY and XAUUSD, October 2023 to October 2026, closed bars (a code calculation, not a trading result):
| Timeframe | Key value | ATR period | Signals per month |
| M15 | 2.0 | 10 | about 95 to 115 |
| H1 | 1.0 (default) | 10 | about 57 to 62 |
| H4 | 1.0 | 10 | about 15 |
| D1 | 1.0 | 10 | about 2 to 3 |
A higher key value gives fewer signals; the ATR period changes little. For different values, attach one scanner per timeframe.
How it was checked
- Code check: every cell value was compared bar by bar with an independent Python calculation, on several symbols and timeframes.
- The frequency table comes from the same calculation on broker history. No trading results are claimed.
Questions
- Does it repaint? No. Cells use closed bars only.
- Can I try it first? The Strategy Tester demo shows the panel in visual mode.
- Does it work on gold and crypto? Yes, on any symbol with history.
- Alerts on my phone? Yes, with push set up in the terminal; the terminal must be running.
- How is it different from UT Bot Signal Alerts? Same calculation: UT Bot Signal Alerts draws arrows on one chart, the scanner covers many symbols and timeframes in one panel.
Questions: use the comments on this page or send me a message on MQL5.
Trading involves risk. The scanner shows the state of a technical rule; it does not predict the market, and past signals do not guarantee future results.