Titan ZScore Pro MT4

Titan Z-Score Pro v3.2 Sürüm Notları:

  • Kurumsal UI/UX Yeniden Tasarımı: Performans kokpitleri ve MTF matrisleri ana harita köşelerine taşındı, böylece tertemiz, dağınıklıktan arındırılmış bir alt pencere görünümü sağlandı.

  • Canlı Kazanma Oranı ve Geri Dönüş Kokpiti: Ortalama geri dönüş başarı oranının ve kazanılan ortalama piplerin gerçek zamanlı takibi eklendi.

  • Çok Zaman Dilimi Z-Puan Matrisi: Ana tabloya doğrudan görsel olarak 5 zaman dilimli (M5'ten D1'e) bir durum ızgarası entegre edildi.

  • Yeniden Boyanmayan Güçlendirilmiş Uygulama: Optimize edilmiş V-reversal ok tetikleyicileri ve dinamik ortalama-hedef projeksiyon çizgileri.


Titan Z-Score Pro

Titan Z-Score Pro, MetaTrader 4 için tasarlanmış profesyonel düzeyde bir istatistiksel göstergedir. Bu, mevcut fiyatın tarihsel ortalama değerinden kaç standart sapma uzaklaştığını kesin olarak hesaplar. İstatistiksel varyans kullanarak, gösterge yatırımcıların duygusal önyargıdan ziyade matematiksel olasılıklara dayalı aşırı yayılmış piyasa koşullarını ve yüksek olasılıklı ortalama geri dönüş bölgelerini belirlemesine yardımcı olur.

Temel Özellikler:

  • Akıllı V-Reversal Mantığı: Gösterge, fiyatın kullanıcı tarafından tanımlanan aşırı seviyelere (örneğin, +2.5 veya -2.5 Sigma) ulaştığında izler. Ana grafikte sadece yapısal pivot noktası doğrulandıktan sonra tersine sinyal üretir ve yüksek volatilite sırasında yanlış kırılmaların etkisini azaltır.

  • 4 Renkli Momentum Histogramı: Trend hızını ve momentum değişimlerini gerçek zamanlı görselleştiren renk kodlu alt pencere histogramına sahiptir.

  • Baş üstü Ekran (HUD) gösterge paneli: Gösterge penceresinin içine doğrudan gömülü temiz bir görsel panel, gerçek zamanlı Z-Score değerini ve mevcut piyasa durumunu (örneğin, Aşırı Satın Alınan/Aşırı Satılmış uç noktalar) gösterir.

  • Özelleştirilebilir Sinyal Tetikleyicileri: Sinyal frekansı üzerinde tam kontrol sağlar. Kullanıcılar sapma eşiklerini ayarlayabilir (örneğin, düşük frekanslı, yüksek frekanslı, yüksek güvenilirlikli keskin nişancı kurulumları için 3.0 Sigma'ya ayarlayarak).

  • Yeniden Boyanmayan Hesaplama: Sinyaller mum kapandığında kalıcı olarak kilitlenir, böylece manuel geriye test ve doğru uyarı sistemleri için tutarlı geçmiş veriler sağlanır.

Ticaret Uygulaması ve Stratejisi:

  • Ortalama Geri Dönüş: Z-Puanı istatistiksel uçlara ulaştığında, varlığın aşırı uzatıldığını gösterir. Kurumsal algoritmalar genellikle fiyatın bu seviyelerden tarihsel ortalamaya geri dönmesini arar.

  • İvme Onayı: Karşı trend girişleri yapmadan önce yön momentumunun tükenip tükenmediğini doğrulamak için alt pencere histogramını kullanın.

Önerilen Konfigürasyonlar:

  • Desteklenen Varlıklar: Ortalama geri dönen para birimi çiftleri (FX Majors), Gold (XAUUSD) ve büyük kripto paralar için optimize edilmiştir.

  • Zaman Dilimleri: Daha düşük zaman dilimindeki piyasa gürültüsünü filtrelemek için M15, H1 ve H4 grafiklerinde şiddetle tavsiye edilir.

  • Özelleştirme: Z-Score periyotları, sinyal hatları, görünürlük anahtarları ve bireysel grafik şablonlarına uyacak renk paletleri üzerinde tam kontrol.


推荐产品
Time Bubble
Ahmed Mohamed
Time Bubble ***Specialized for GBPJPY 1H time frame*** (tested for two years with success rates about 82%) Time Circle's smart algorithm detects the price circles with time . give strong signals at the right time as result of combine the price and time. our team spent months to develop this indicator specially for GBPJPY ..with high success rates about 82% win trades over two years .tested from December 2016 to November 2018. *** in last two years total signals 1012 with 829 Wins and 183 Lo
MR Volume Profile 4
Sergey Khramchenkov
The "MR Volume Profile 4" indicator is a charting tool that displays trading volume at different price levels rather than time intervals. A key concept in volume profile is the point of control (POC)—the price level with the highest volume traded during the session or time range. While tools like VWAP or OBV provide volume trends, the "MR Volume Profile 4" indicator offers granular detail about where the most market activity occurs at specific price levels. This makes it a more precise tool for
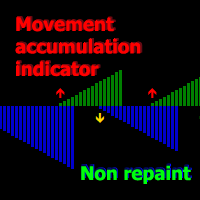
A technical indicator that calculates its readings on trading volumes. In the form of a histogram, it shows the accumulation of the strength of the movement of the trading instrument. It has independent calculation systems for bullish and bearish directions. Works on any trading instruments and time frames. Can complement any trading system. The indicator does not redraw its values, the signals appear on the current candle. It is easy to use and does not load the chart, does not require addition
Volume Profile Sniper v11.1是一款全面的市场分析工具 专业的交易方法 Volume Profile Sniper v11.1在一个指标中结合了超过15个关键过滤器,根据对市场情况的全面评估提供清晰的信号。 主要特点 成交量不平衡分析-该算法计算每个蜡烛中买家和卖家的份额,表明其中一方的优势(可配置阈值从50%到90%)。 多级信号滤波-指标考虑到: 趋势指标(EMA9/21) Rsi不包括超买/超卖区域 蜡烛图案(针杆,吸收,锤子) 支持/阻力水平(自动检测) 音量峰值,以确定主要参与者的活动 经典和放大的RSI分歧 波动率评估的ATR 用于确定趋势强度的ADX 价格行动(内部和外部酒吧) 多时间帧确认 市场结构(高点/低点) 会话过滤器(亚洲,伦敦,纽约会话) 防止新闻排放 灵活的配置系统-MinFiltersRequired参数允许您设置生成信号所需的最小数量的滤波器。 这使得可以使指标适应任何交易策略,从激进到保守。 可视化设置-您可以通过将指示器集成到图形样式中来更改箭头的大小和颜色(ArrowSize,BuyArr
EARLY REMINDER: The Starting price is 65 price will rise soon up to 365$ and then 750$ after first 10 copies of sales. Grab this offer now! Introduction Hello, traders! Welcome to the demonstration of the Forex Beast Indicator , a comprehensive tool designed to assist aspiring traders in navigating the complexities of the forex market. This indicator incorporates seven essential components to provide a well-rounded trading experience: Moving Averages Colored Zones Support and Resistance Levels
First and foremost, the Insight Flow Indicator stands out as a Non-Repainting, Non-Redrawing, and Non-Lagging tool. This makes it a prime choice for both manual and algorithmic trading, ensuring reliable and consistent signals. User Manual: Settings, Inputs, and Strategy The Insight Flow Indicator leverages price action, strength, and momentum to provide a clear edge in the market. Equipped with advanced filters, it eliminates noise and false signals, enhancing trading potential. By using multip

Blahtech Market Profile
Blahtech Limited
4.53 (15)
Was: $249  Now: $99   Market Profile defines a number of day types that can help the trader to determine market behaviour. A key feature is the Value Area, representing the range of price action where 70% of trading took place. Understanding the Value Area can give traders valuable insight into market direction and establish the higher odds trade. It is an excellent addition to any system you may be using. Blahtech Limited presents their Market Profile indicator for the MetaTrader community. Ins
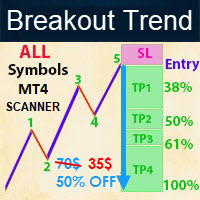
-  Real price is 70$ - 50% Discount (It is 35$ now) Please contact me by temporarily account for more info: https://www.mql5.com/en/users/temp_elif_kaya/ messages Contact me for instruction, any questions! - New Update - Lifetime update free - Non-repaint - I just sell my products in Elif Kaya Profile, any other websites are stolen old versions, So no any new updates or support. Introduction Breakout Trend Scanner indicator works based on the Elliott Wave in technical analysis describes price m
Master Volume profile
Israr Hussain Shah
Money Flow Profile MT5 HERE   Here   our more valuable tools SMC Trend Trading   ,  Easy SMC Trading  ,  Institutional SMC Architect Volume Analysis Tools  ,  Volume flow Profile  ,  Market volume profile  , FVG with Volume  , Liquidity Heatmap Profile  ,  Volume Spread Analysis This Master Edition is engineered for clarity and speed, featuring a unique Auto-Theme Sync system that instantly beautifies your chart layout upon loading. Key Features: True Money Flow Calculation: Goes beyond stand
Market voleum profile
Israr Hussain Shah
Here   our more valuable tools SMC Trend Trading   ,  Easy SMC Trading  ,  Institutional SMC Architect Volume Analysis Tools  ,  Volume flow Profile  ,  Market volume profile  , FVG with Volume  , Liquidity Heatmap Profile  ,  Volume Spread Analysis The Market Profile & Volume Profile Indicator is a powerful technical analysis tool designed to visualize market activity and price distribution over specific timeframes. Unlike standard technical indicators that focus solely on price over time, th
Binary Option Signal
Yaroslav Varankin
Indicator for binary options arrow is easy to use and does not require configuration works on all currency pairs, cryptocurrencies buy signal blue up arrow sell signal red down arrow tips do not trade during news and 15-30 minutes before their release, as the market is too volatile and there is a lot of noise it is worth entering trades one or two candles from the current period (recommended for 1 candle) timeframe up to m 15 recommended money management fixed lot or fixed percentage of the depo
VWAP Volume Price Customized Cycle FX-AIEA —— 多周期锚定VWAP指标(技术特性与参数讨论) 概述 本指标在传统VWAP(成交量加权平均价)的基础上引入了多周期锚定与自定义会话重置机制,旨在提供动态的“公允价值”参考区域。指标通过三重标准差通道(±1σ/±2σ/±3σ)构建对称的波动边界,可作为动态支撑阻力的参考。 核心算法特性 智能多时间框架锚定 :指标可根据当前图表周期自动附加更高维度的VWAP(例如:H4及以上→月线VWAP;H1→周线VWAP;M30及以下→日线VWAP),也支持手动指定任意周期(MN1/W1/D1/H4等)。 自定义基础周期模式 :开放周期自定义开关,可在参数面板中自由选择计算周期。 会话锚定(多重置点) :支持输入任意多个每日重置时间点(如   00:00,08:00,16:00 ),使VWAP在每天这些时刻重置,对应不同交易时段。 三重标准差通道 :基于实际成交量加权计算的标准差形成六条对称通道线,可用于观察价格偏离程度。标准差倍数可独立调整(默认1、2、3)。 显示周期数量控制 :可自由设定VWAP显示的历史
Night ghost
Dmitriy Kashevich
Night Ghost - Arrow indicator for binary options. This is a reliable assistant to you in the future! - No redrawing on the chart -Works great on EUR/USD currency pairs! -Indicator accuracy up to 90% (Especially at night) -No long setup required (Perfectly set up for Binary Options) - Not late signals - The appearance of a signal on the current candle -Perfect for M1 period (No More!) - Eye-friendly candle color (Red and Blue) -Installed Alert Working with it: - Blue arrow shows signa
Max Volume
Maksim Slovakov
Подкрашивает аномально большие тиковые объёмы в красный цвет. Имеет следующие настройки: "Процент" по умолчанию "70"  (Процент на который аномальный объём должен быть больше предыдущего) "Уровень" по умолчанию "500" (Количество тиков, больше которого будем брать во внимание аномальный объём) Внимание! Данный индикатор был разработан для мелких таймфреймов M1,M5,M15. Идея в том, что на таких Таймфреймах увеличение количества тиков говорит об увеличении количество сделок, увеличения интереса к цен
加密货币外汇指标“MFI 横盘探测器”是一款高效的交易辅助工具!无重绘。 我推荐您使用这款适用于 MT4 的出色指标来升级您的交易方法。 - 该指标会在图表上显示价格横盘区域。它具有“横盘灵敏度”参数,用于检测横盘区域。 - “MFI 横盘探测器”对于背离检测非常有用,并且与价格行为指标结合使用效果更佳。 - 您可以将其用于趋势跟踪系统,以检测横盘区域并避免在这些区域进行交易。 - 您可以将其用于反转剥头皮交易,以在横盘边界处进行反转交易。 - “MFI 横盘探测器”有很多可以替代标准 MFI 震荡指标的机会。 - 资金流量指数 (MFI) 本身是一个技术震荡指标,它使用价格和成交量数据来识别超卖和超买区域。 - 当 MFI 高于 80 时,超买区域是理想的卖出入场点;当 MFI 低于 20 时,超卖区域是理想的买入入场点。 点击这里查看高质量的交易机器人和指标! 这是仅在 MQL5 网站上提供的原创产品。
Adjustable Consecutive Fractals  looks for 2 or more fractals in one direction and sends out a on screen alert, sound alert and push notification, for strong reversal points . Adjustable Consecutive Fractals, shows the fractals on chart along with a color changing text for buy and sell signals when one or more fractals appear on one side of price. Adjustable Consecutive Fractals is based Bill Williams Fractals . The standard Bill Williams fractals are set at a non adjustable 5 bars, BUT withe th
ADX Shark Scalper
Maxwell Ndzoyiya
ADX Shark Scalper – The Ultimate Hybrid Indicator for Precision Scalping Dive into the markets with the ADX Shark Scalper , a powerful and versatile tool designed for traders who seek precision in every trade. This cutting-edge indicator seamlessly combines multiple advanced technical signals into one streamlined system, allowing you to spot good buy and sell opportunities with ease. At its core, the ADX Shark Scalper leverages the power of trend and momentum detection through the integration of
EZZ Zig Zag MT4
Paulo Rocha
5 (1)
EZZ Elite Zig Zag is an indicator for the MetaTrader 4 terminal. This indicator traces the peak of the trend based on the market reversal, thus showing various opportunities in the financial market. EZZ Elite Zig Zag is a visual tool, intuitive, and easy to understand and use.  Test it Yourself by Downloading it for Free. Author Paulo Rocha all rights reserved
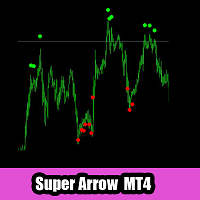
The Super Arrow Indicator provides non-repainting buy and sell signals with exceptional accuracy. Key Features No repainting – confirmed signals remain fixed Clear visual arrows: green for buy, red for sell Real-time alerts via pop-up, sound, and optional email Clean chart view with no unnecessary clutter Works on all markets: Forex, gold, oil, indices, crypto Adjustable Parameters TimeFrame Default: "current time frame" Function: Sets the time frame for indicator calculation Options: Can be set
PipTick VSA MT4
Michal Jurnik
1 (2)
The   Volume Spread Analysis indicator   is based on the original Volume Spread Analysis method. It was designed for quick and easy recognition of VSA patterns. Even though this indicator looks very simple, it is the most sophisticated tool we've ever made. It is a really powerful analytical tool that generates very reliable trading signals. Because it is very user-friendly and understandable, it is suitable for every type of trader, regardless of his experience. What is VSA? VSA - Volume Spre
TPO Profile MT4
Kyra Nickaline Watson-gordon
5 (1)
Definition : TPO is a Time Price Opportunity. Instead of using bars or candles with an Open, High, Low, and Close price, each "bar" in a Market Profile is represented by horizontal bars against the price It is called Market Profile terminology. In other words time-price-opportunity (TPO) profiles are histograms of how much time was spent at each price within the span of the profile. By using a TPO chart, you are able to analyze the amount of trading activity, based on time, for each price level
GND Tail Candle
Nguyen Dang Giang
A tall upper shadow occurs when the price moves during the period, but goes back down, which is a bearish signal. A tall lower shadow forms when bears push the price down, but bulls pull it back up, which leaves a long line or shadow. This is considered a bullish signal. Some technical analysts believe a tall or long shadow means the stock will turn or reverse. Some believe a short or lower shadow means a price rise is coming. In other words, a tall upper shadow means a downturn is coming, while
StructureMap Pro — Market Structure Labels (HH / HL / LH / LL) for MT4 StructureMap Pro automatically marks market structure on your chart. Every confirmed swing high and swing low is labeled as Higher High (HH), Higher Low (HL), Lower High (LH) or Lower Low (LL), and consecutive pivots are connected with dotted lines, so the "staircase" of the trend is visible at a glance. No more drawing swing points by hand — the indicator does it consistently on any symbol and any timeframe. How to read the
Paid release: Delta Volume Profile Zones MT4 is a paid MetaCoderStore indicator. Use the product comments for setup questions, feature requests, and feedback for future updates. Delta Volume Profile Zones is a compact volume-profile indicator for traders who want price-level context without turning the chart into a crowded footprint screen. It builds a rolling profile from recent candles and marks the key zones traders usually watch: Point of Control, Value Area High, Value Area Low, high-volume
这是一个预测蜡烛收盘价的指标。 该指标主要用于 D1 图表。 该指标适用于传统外汇交易和二元期权交易。 该指标可以用作独立的交易系统,也可以作为您现有交易系统的补充。 该指标分析当前蜡烛,计算蜡烛本身内部的某些强度因素,以及前一根蜡烛的参数。 因此,该指标预测市场走势的进一步方向和当前蜡烛的收盘价。 由于这种方法,该指标既适用于短期盘中交易,也适用于中长期交易。 该指标允许您设置指标在分析市场情况期间将产生的潜在信号的数量。 在指标设置中有一个特殊的参数。 此外,该指标可以通过图表上的消息、电子邮件以及推送通知的形式通知新信号。感谢您的关注!交易愉快! 购买后一定要写信给我! 我会给你我的交易指标的建议! 还可以获得奖金!
Candle Liquidity Detector
Mohammadhossein Yoosefiizad
Smart Liquidity Levels Indicator (Multi-Timeframe) Identify Untouched Liquidity Zones with Precision The Smart Liquidity Levels Indicator is a professional trading tool designed to help traders visualize untouched liquidity highs and lows from higher timeframes directly on the chart. This indicator automatically scans historical candles on a selected higher timeframe (HTF) and plots liquidity levels that have NOT yet been taken by price , allowing traders to anticipate high-probability rea
Volume Compair
Thiago Pereira Pinho
5 (1)
专业累计德尔塔与成交量中位线指标 通过这款强大的成交量分析工具,追踪 真实的买卖压力 。 成交量比较指标 (Volume Compare Indicator) 结合了 累计德尔塔 (Cumulative Delta) 和 成交量中位线 (Volume Medians) ,帮助您识别机构活动、失衡以及潜在的反转。  主要特点:  累计德尔塔直方图 – 实时可视化净买入成交量与净卖出成交量。  买入/卖出成交量中位线 – 显示平均买入和卖出成交量水平的水平线。  智能成交量分类 – 分隔: 强劲买入(绿色) – 看涨压力。 强劲卖出(红色) – 看跌压力。 买入成交量中位线(蓝色线) – 典型买入量的参考。 卖出成交量中位线(橙色线) – 典型卖出量的参考。  可自定义参数 – 调整 CDIPeriod 和 CDIRange 以设置敏感度。  EMA 平滑成交量 – 减少噪音,使信号更清晰。  如何帮助交易者: 发现机构活动 – 异常的成交量尖峰指示大玩家进场。 确认突破/反转 – 强烈的德尔塔背离警告假动作。 基于成交量的支撑/阻力 – 中位线充当动态参考水平。 日内交
Check My Other Products Contact me to discover all my services  This indicator is very useful to have a better understanding of the current trend. With the integration of a trend color cloud it makes it easy to see the price trend immediately on the eye and this allows the trader to make more accurate assessments. I have been using this indicator for years and I must say that it greatly limits chart errors and trades against the trend
-  Real price is 200$ - Discount (one purchase is 39$ now) Please contact me by temporarily account for more info: https://www.mql5.com/en/users/temp_elif_kaya/ messages - Lifetime update free - Non-repaint - I just sell my products in Elif Kaya Profile, any other websites are stolen old versions, So no any new updates or support. DESCRIPTION Most supply and demand indicators just draw boxes. Supply and Demand Smart Trading tells you what to do with them. It grades every zone in real time and
Title : Market Bias Indicator - Oscillator-Based Trading Tool Introduction : Discover the potential of the "Market Bias Indicator," a revolutionary oscillator-based trading tool designed for precise market analysis. If you're in search of a robust alternative to traditional bias indicators, your quest ends here. Market Bias Indicator offers unparalleled accuracy in identifying market sentiment and is your gateway to confident trading decisions. Recommended Trading Pairs : Market Bias Indicator i
该产品的买家也购买
Super Signal – Skyblade Edition 專業級無重繪 / 無延遲趨勢信號系統,擁有卓越勝率 | 適用於 MT4 / MT5 在較低的時間週期上效果最佳,例如 1 分鐘、5 分鐘與 15 分鐘圖表。 核心特色: Super Signal – Skyblade Edition 是一套專為趨勢交易設計的智能信號系統。 其採用多重濾波邏輯,僅篩選出具有明確方向性、動能強勁且波動結構健康的走勢進場點。 本系統 不預測高點或低點 ,只有在同時滿足以下三項條件時才會觸發交易信號: 趨勢方向明確 動能持續增強 波動率結構穩定 此外,系統還結合市場流動性分析,以進一步提升信號的準確性與觸發時機。 信號特性: 所有箭頭信號皆為 100% 無重繪,無延遲 信號一旦出現即固定於圖表,不會閃爍或消失 提供圖表箭頭、資訊面板、彈出通知、聲音提示及推播訊息 支援 EA 呼叫(Buffer 輸出),可整合至自動化交易或信號跟單系統 提供預設參數模板,免調整即可使用,適合新手快速上手 總結: Super Signal – Skyblade Edition 是一款邏輯清晰、穩定高效的專業趨勢型
Gold Channel XAUUSD
Paulo Rocha
5 (4)
Gold Channel is a volatility-based indicator, developed with a specific timing algorithm for the XAUUSD pair, which consists of finding possible corrections in the market. This indicator shows two outer lines, an inner line (retracement line) and an arrow sign, where the theory of the channel is to help identify overbought and oversold conditions in the market. The market price will generally fall between the boundaries of the channel. If prices touch or move outside the channel it is a tradi
Liked the logic of this tool? Explore the full ecosystem of professional indicators and utilities created by a trader for traders: All products by the author on MQL5 Market: https://www.mql5.com/en/users/musa1994/seller Details and trading philosophy: https://developer-mql4-mql5.netlify.app/ Professional Delta Volume MTF v2.0 is a professional indicator for MetaTrader 4 that shows the difference between buy and sell volume (Delta Volume) and Cumulative Delta. Version 2.0 introduces f
Quant Direction
Georgios Kalomoiropoulos
Quant Direction 是一款三维市场分析工具。它通过同时计算多个维度上的精确百分比偏差,提供完全客观的、基于算法的市场分析视角。该算法采用先进的人工智能建模工具开发,并经过全面测试,旨在以独特的精准度解读市场。它可以分析您平台上的任何货币对或金融工具。 无论您是短线 交易者、日内 交易者还是波段交易者,Quant Direction 都是您的理想之选。 交易者的真正优势 Quant Direction 的真正优势在于彻底消除情绪、屏幕疲劳和过度思考。它无需手动点击十几个图表来寻找方向并反复质疑自己的偏好,引擎即可在几毫秒内即时处理 8 个时间周期(从 5 个月到月线)。它能准确告诉你任何时刻谁在掌控市场,确保你始终朝着概率最高的方向进行交易。 市场分析的三个维度 该算法将市场分为三个不同的交易维度,为您提供完整的宏观和微观视角: 超短线交易分析: 捕捉即时、快速的动量变化和较低时间框架的执行点。 日内分析: 识别真实的、潜在的每日方向性偏差。 波动分析: 专注于宏观趋势,确保您不会与大盘机构的走势背道而驰。 独家评分引擎 Quant Direction 的底层采用了一套
Neuro Poseidon MT4
Daria Rezueva
4.74 (46)
Neuro Poseidon is a new indicator by Daria Rezueva. It combines precise trading signals with adaptive TP/SL levels - creating best possible trades as a result! Message me and get  Neuro Poseidon Assistant  as a gift to automize your trading process! What makes it stand out? 1. Proven profitability on all assets and timeframes 2. Only confirmed BUY and SELL signals present on the chart 3. Adaptive TP & SL levels generated by the software for each trade 4. Easy to understand - suitable for all
Miraculous Indicator Binary & Forex v3 StrategySafe Miraculous Indicator Binary & Forex v3 StrategySafe 是一款专业交易指标,适合希望获得清晰信号、强大确认工具以及结构化交易方式的 Binary 和 Forex 交易者。 v3 版本加入了 MIR Dashboard、Miraculous Confirmation Dashboard、GANN Law、Square of 9 水平线、GANN 角度以及更强的 Forex 分析模式。 核心功能 同时支持 Binary 和 Forex 交易模式。 MIR Dashboard 可快速读取市场状态。 Miraculous Confirmation Dashboard 用于确认交易机会。 GANN Law drawing lines 用于 Forex 市场结构分析。 Square of 9 线条、方向和关键价格水平。 1x1 GANN Angle 用于判断趋势压力。 Entry Information TP 帮助寻找合理止盈区域。 Strateg
Dinapoli Package MT4
Samil Bozuyuk
5 (1)
All in One package includes the  Oscillator Predictor ,  MACD Predictor ,  Thrust Scanner  and  Advanced Fibonacci  indicators which are mandatory for applying  Dinapoli  trade plans.  Please visit below links for detailed explanations of indicators. Advanced Fibonacci Indicator =>  https://www.mql5.com/en/market/product/52834 Thrust Scanner Indicator => https://www.mql5.com/en/market/product/52830 Overbought /Oversold Predictor indicator => https://www.mql5.com/en/market/product/52621 Macd P
GoldRush Trend Arrow Signal
Kirk Lee Holloway
5 (2)
GoldRush 趨勢箭頭信號 GoldRush 趨勢箭頭信號 指標為 XAU/USD 中的高速、短期短線交易者提供精確、實時的趨勢分析。 專為1分鐘時間框架設計,此工具顯示方向箭頭以明確顯示入場點,使短線交易者能在波動市場中自信操作。 該指標包含主要和次要警示箭頭。主要信號為白色和黑色方向箭頭,用於指示趨勢方向的轉變;次要信號為藍色和紅色箭頭,用於確認主要箭頭指示的方向並提示潛在交易入場點。 注意:當趨勢方向發生變化後僅出現一個主要警報箭頭時,請注意可能會出現多個次要藍/紅箭頭。次要信號將在滿足信號標準的任何蠟燭圖後出現,因此在長期趨勢移動中,螢幕上將顯示大量次要箭頭(如附帶的截圖所示)。您可在設置中開啟或關閉任一箭頭類型。 以下是我使用此指標進行交易的方式: - 對於買入入場,我會耐心等待白箭頭在蠟燭收盤時出現,並在下一根可用蠟燭收盤時出現藍箭頭時進行買入交易。 - 對於賣出入場,我會耐心等待黑箭頭在蠟燭收盤時出現,並在下一根可用蠟燭收盤時出現紅箭頭時進行賣出交易。 - 獲利了結/止損設置由使用者自行負責,但我個人使用最低R:R為1:2,並發現這在倫敦/紐約開盤等
Dynamic Forex28 Navigator
Bernhard Schweigert
4.43 (7)
Dynamic Forex28 Navigator - 下一代外汇交易工具。 当前 49% 折扣。 Dynamic Forex28 Navigator 是我们长期流行的指标的演变,将三种功能合二为一: 高级货币强度 28 指标 (695 条评论)+ 高级货币 IMPULSE 带警报 (520 条评论)+ CS28 组合信号(奖励)。 有关指标的详细信息 https://www.mql5.com/en/blogs/post/758844 下一代强度指标提供什么? 您喜欢的原始指标的一切,现在通过新功能和更高的精度进行了增强。 主要特点: 专有货币强度公式。  所有时间范围内的平滑和准确的强度线。 非常适合识别趋势和精确进入。 动态市场斐波那契水平(市场斐波那契)。  此指标独有的独特功能。 斐波那契应用于货币强度,而不是价格图表。 适应实时市场活动以获得准确的反转区域。 实时市场动量。  第 9 行显示市场是活跃还是被动。 对于定时交易至关重要。 全面的警报和显示。  每种货币最强的买入和卖出动量。 ​​28 对的双重动量买入和卖出。 超买/超卖警告外部范围和止损。 反转
IQ Gold Gann Levels
INTRAQUOTES
5 (5)
Presenting one-of-a-kind Gann Indicator for XAUUSD IQ Gold Gann Levels is a non-repainting, precision tool designed exclusively for XAUUSD intraday trading. It uses W.D. Gann’s square root method to plot real-time support and resistance levels, helping traders spot high-probability entries with confidence and clarity. William Delbert Gann (W.D. Gann) was an exceptional market analyst whose trading technique was based on a complex blend of mathematics, geometry, astrology, and ancient calculation
OrderFlow Absorption – 專業級MT4買賣差與吸收訊號指標 釋放真正訂單流分析的力量,OrderFlow Absorption 是MetaTrader 4上最強大的買賣差(Delta)直方圖與吸收訊號指標。專為想看清每一個價格波動背後真相的交易者設計,這個工具揭示了隱藏的買賣壓力與推動市場的吸收事件。 功能特色 買賣差直方圖視覺化:   以清晰的色彩直方圖即時顯示買方與賣方壓力。 吸收訊號偵測:   先進邏輯自動辨識多空吸收事件,及早預警潛在反轉。 圖表標記:   吸收訊號直接標示於主圖表,方便視覺辨識。 彈出式警報:   新吸收訊號出現時即時通知。 自訂門檻:   過濾弱訊號,專注高勝率機會。 資源管理:   高效運算,適用於大型圖表也能流暢運行。 全品種兼容:   適用於任何商品與週期,包括外匯、指數、商品等。 簡易整合:   參數簡單,快速上手與調整。 OrderFlow Absorption 的邏輯說明 OrderFlow Absorption 採用專利演算法,能在沒有完整Tick數據的情況下,估算每根K棒的買賣壓力(Delta)。它分析成交量、價格行為、K
PTS Precision Index Oscillator V2
PrecisionTradingSystems
5 (1)
精密指数振荡器(Pi-Osc)由Precision Trading Systems的Roger Medcalf开发 版本2经过精心重新编码,以在您的图表上加载速度非常快,还加入了一些其他技术改进,以提高体验。 Pi-Osc旨在提供准确的交易定时信号,旨在找到极端的耗尽点,这些点是市场被迫去触及,以清理每个人的止损单。 该产品解决了一个古老的问题,即知道极端点在哪里,这使得交易员的生活变得更加简单。 这是一个高度复杂的共识指标,与行业标准的振荡器相比,具有一些强大的区别。 它使用的一些特征包括需求指数、资金流动、RSI、随机指标、模式识别、成交量分析、标准偏差极端点以及不同长度上述各种变化的分歧。 乍一看,对于未经培训的人来说,它似乎与任何其他振荡器没有什么不同,但当与其他振荡器(如RSI或动量等)相对比时,这个指标的真正威力开始显现。 据我所知,没有其他振荡器可以频繁地精确指出顶部和底部,具有相同的定期效率。 精密指数振荡器由许多不同的数学方程组成,用于测量多个时间框架采样中的价格和成交量变动,从而高度准确地预测趋势可能发生转折的位置。 PTS Pi-Osc V2非
Beast Super Signal
Florian Zuercher
4.73 (90)
正在寻找可以帮助您轻松识别有利可图的交易机会的强大外汇交易指标? Beast Super Signal 就是您的不二之选。 这个易于使用的基于趋势的指标持续监控市场状况,寻找新的发展趋势或跳入现有趋势。当所有内部策略一致且彼此 100% 融合时,Beast Super Signal 会发出买入或卖出信号,无需额外确认。当您收到信号箭头警报时,只需买入或卖出。 购买后给我留言,让我加入我的私人 VIP 群组! (仅限购买完整产品)。 购买后给我发消息以获取最新的优化设置文件。 此处提供 MT5 版本。 在此处 获取 Beast Super Signal EA。 查看评论部分以查看最新结果! Beast Super Signal 根据您偏好的 1:1、1:2 或 1:3 风险回报率建议入场价、止损和获利水平,让您放心交易。这个 Beast Super Signal 是 100% 不可重新绘制的,这意味着它永远不会重新计算或重新绘制,每次都能为您提供可靠的信号。 Beast Super Signal 指标适用于所有时间范围,包括货币对、指数、商品和加密货币对。 Beast Su
Introduction Excessive Momentum Indicator is the momentum indicator to measure the excessive momentum directly from raw price series. Hence, this is an extended price action and pattern trading. Excessive Momentum Indicator was originally developed by Young Ho Seo. This indicator demonstrates the concept of Equilibrium Fractal Wave and Practical Application at the same time. Excessive Momentum detects the market anomaly. Excessive momentum will give us a lot of clue about potential reversal and
Elliott Wave Trend MT4
Young Ho Seo
4 (7)
Elliott Wave Trend was designed for the scientific wave counting. This tool focuses to get rid of the vagueness of the classic Elliott Wave Counting using the guideline from the template and pattern approach. In doing so, firstly Elliott Wave Trend offers the template for your wave counting. Secondly, it offers Wave Structural Score to assist to identify accurate wave formation. It offers both impulse wave Structural Score and corrective wave Structure Score. Structural Score is the rating to sh
Congestioni
Stefano Frisetti
5 (1)
This indicator is very usefull to TRADE Trading Ranges and helps identify the following TREND. Every Trader knows that any market stay 80% of the time in trading ranges and only 20% of the time in TREND; this indicator has been built to help traders trade trading ranges. Now instead of waiting for the next TREND, You can SWING TRADE on trading ranges with this simple yet very effective indicator. TRADING with CONGESTIONI INDICATOR: The CONGESTIONI Indicator identify a new trading range and ale
I have been trading for some time now and always find it a difficulty remembering the timing of the various market opening hours at the other part of the world (especially, when it comes to daylight saving), but could not find any decent indicator online that could help. And it is for this reason that gives birth to this indicator, which I have spent much time, effort and thinking. As many already know that opening of a certain marketplace, depending on which currency pair, has an impact on the
IQ FX Gann Levels
INTRAQUOTES
5 (3)
IQ FX Gann Levels a precision trading indicator based on W.D. Gann’s square root methods . It plots real-time, non-repainting support and resistance levels to help traders confidently spot intraday and scalping opportunities with high accuracy. William Delbert Gann (W.D. Gann) was an exceptional market analyst, whose trading technique was based on a complex blend of mathematics, geometry, astrology, and ancient mathematics which proved to be extremely accurate. We don't offer free or bonus indic
ORB Seeker
Marcela Goncalves De Oliveira
4 (1)
特价促销,限量供应,保持产品稀缺性! 仅售 599 美元! 购买后请联系我以获取奖励的 ORB Seeker EA 和个人优化设置文件。 自信地捕捉干净利落的比赛片段! ORB Seeker 是一款专业的开盘区间突破 (ORB) 指标,专为追求准确性、简洁性、灵活性和清晰图表结构的交易者而设计。 它能自动绘制任何交易品种的盘前或自定义交易时段区间,然后给出清晰的突破信号,包括入场点、止损点、止盈点以及可选的50%部分止盈位。所有数据均实时计算并直接显示在图表上。 您可以选择交易伦敦开盘、纽约交易时段、亚洲交易时段,或者您自定义的交易时段。ORB Seeker 会根据您选择的交易时段自动调整,让您精准掌握市场波动范围、突破位和交易位的位置。 每次购买均免费赠送 ORB Seeker EA 智能交易系统。该 EA 系统读取指标的突破信号并可自动下单,您可以选择手动交易,也可以让 EA 系统根据指标的信号逻辑自动处理入场。   为什么选择 ORB Seeker 支持多个交易时段 - 您可以自行设置伦敦、纽约、亚洲或自定义交易时段的盘前交易时间和交易时段。 完整的突破视觉效果 - 交易最高
ECM Elite Channel is a volatility-based indicator, developed with a specific time algorithm, which consists of finding possible corrections in the market. This indicator shows two outer lines, an inner line (retracement line) and an arrow sign, where the channel theory is to help identify overbought and oversold conditions in the market. The market price will generally fall between the boundaries of the channel. If prices touch or move outside the channel, it's a trading opportunity. The ind
本指标是实践实战交易完善的波浪自动分析的指标 !  案例... 注: 波浪分级用西方叫法不习惯,因受到缠论(缠中说禅)命名方式习惯的影响,我是将基础波浪命名为 笔 ,将二级波段命名为 段 ,同时具有趋势方向的段命名为 主趋段 (以后笔记中都是这种命名方式,先告知大家),但是算法上和缠论关系不大切勿混淆.反映的是本人分析盘面总结的 千变万化纷繁复杂的运行规律 . 对波段进行了标准化定义,不再是不同人不同的浪  ,    对人为干扰的画法进行了排除,在严格分析进场起到了关键的作用 . 使用这个指标,等于将交易界面提升美感,抛弃最原始的K线交易带你进入新的交易层次.如果不是为了交易,在宣传上也将使客户观感提升层次. 指标内容: 1. 基础波浪 (笔) : 首先我们找出了价格波动过程中的基础波动拐点,当然他的有序性低,为下一步的计算提供基础. 2. 二级波段( 段 ) :在基础波浪的基础上,通过算法分析得到层级更明显的二级波段,二级波段为波浪提供了分析基础 3. 波浪( 浪 ): 有着更清晰的趋势,更清晰直观的方向.分析一个波浪是否延续,需要看二级波段的形态,分析二级的构成,可以得出波浪
Introducing the POWER TRADE Indicator Created by a small group of experienced traders with years of profitable experience in the financial markets, the Power Trade Indicator is a plug-and-play trading tool designed to help traders spot high-quality setups with ease and confidence. What It Does: It provides powerful entry signals, profit-taking zones, and rebound areas — giving you a complete view of where price action is most likely to move next. The indicator reacts in real time, al
Meravith
Ivan Stefanov
5 (3)
做市商工具。 Meravith 将: 分析所有时间周期并显示当前正在运行的趋势。 标注流动性区域(成交量均衡区),即多头与空头成交量相等的位置。 在您的图表上直接显示来自不同时间周期的所有流动性水平。 生成并展示基于文本的市场分析供您参考。 根据当前趋势计算目标位、支撑位和止损位。 计算交易的风险回报比。 根据您的账户余额计算仓位大小,并估算潜在利润。 在市场出现重大变化时,Meravith 还会发出警告。 指标的主要线条: 多头/空头成交量衰竭线 —— 作为目标位使用。 趋势线 —— 指示市场趋势方向。根据市场是多头还是空头而改变颜色,并作为趋势支撑。其颜色主要反映市场情绪。 成交量均衡线(Eq)—— Eq(Volume Equilibrium)是系统的核心。它表示买卖双方成交量的平衡点,即市场流动性所在位置。向上突破 Eq 表示多头倾向,向下突破 Eq 表示空头倾向。突破后,应等待回调——当价格回到相反趋势的偏离线或衰竭线附近时。 使用方法:只需将其添加到图表中。 Meravith 可以分析一切——趋势和回调。 趋势线与某条成交量衰竭线之间的距离越大,说明该方向的成交量越高。 趋
Linear Trend Predictor — 结合切入点和方向支撑线的趋势指标。按照突破高/低价通道的原理运作。该指标算法过滤市场噪音,考虑波动性和市场动态。 指示器功能  使用平滑方法,显示市场趋势和开立买入或卖出订单的切入点。  适合通过分析任何时间范围内的图表来确定短期和长期的市场走势。  输入参数可适应任何市场和时间范围,允许交易者独立定制指标。  设定的指示信号不会消失,也不会重新绘制——它是在蜡烛收盘时确定的。  几种类型的通知以箭头组合。  该指标既可以作为独立的交易系统使用,也可以作为其他交易系统的补充。  可供任何经验水平的交易者使用。 主要参数 Volatility Smoothing Level - 指标的主要参数,允许您配置指标以实现舒适的操作。 它的数字范围是 1 到 100,从而增加了您可以获得更长趋势运动的平滑度。 通过少量的数字,您可以获得短期走势并快速退出交易。 使用指标进行交易的时刻:  红线和箭头表示下降趋势和卖出开盘信号。止损应根据前一个上分形来设置。  黄线和箭头表示上升趋势和买入开盘信号。止损应根据前一个下分形来设置。
JSL Orderflow Footprint turns every candle into a price ladder that shows how much volume traded on the bid and on the ask at each price level. It highlights diagonal imbalances, stacked imbalance zones, absorption at candle extremes, cumulative delta (CVD), delta divergence and the daily session volume profile, then combines five of these order-flow conditions into a 0–100 confluence score. A signal is only issued on bar close when the score is high, clearly one-sided and confirmed by the candl
Binary Booster
Yaroslav Varankin
5 (1)
Binary Options Trading Indicator: A Reliable Tool for Your Trades This indicator is specifically designed for binary options trading and has proven its high quality, reliability, and adequate accuracy, depending on the dynamics of the chart. Key Points: Signal Interpretation: When a blue cross signal appears, it indicates a potential entry into a trade, though it is considered a weak signal on its own. However, if the blue cross is accompanied by an arrow, it is considered a more reliable buy s
Signal From Level
Yaroslav Varankin
Binary Options Support Resistance Indicator This indicator is designed for binary options trading and effectively shows retracements from support and resistance levels. Signals appear on the current candle. A red arrow pointing downwards indicates a potential selling opportunity, while a blue arrow pointing upwards suggests buying opportunities. All that needs adjustment is the color of the signal arrows. It is recommended to use it on the M1-M5 timeframes as signals are frequent on these timef
NAM Order Blocks
NAM TECH GROUP, CORP.
3.67 (3)
MT4多時限訂單塊檢測指示器。 特徵 -在圖表控制面板上完全可自定義,提供完整的交互。 -隨時隨地隱藏和顯示控制面板。 -在多個時間範圍內檢測OB。 -選擇要顯示的OB數量。 -不同的OB用戶界面。 -OB上的不同過濾器。 -OB接近警報。 -ADR高低線。 -通知服務(屏幕警報|推送通知)。 概括 訂單塊是一種市場行為,它指示從金融機構和銀行收取訂單。著名的金融機構和中央銀行帶動了外匯市場。因此,交易者必須知道他們在市場上正在做什麼。當市場建立訂單塊時,它會像發生大多數投資決策的範圍一樣移動。 訂單建立完成後,市場將朝著上升和縮小的方向發展。訂單大宗交易策略的關鍵術語是它包括機構交易者正在做的事情。由於它們是主要的價格驅動因素,因此包括機構交易在內的任何策略都可以。 您將在任何時間範圍內實時看到訂單塊,使用我們的控制面板,您將能夠在所選的歷史記錄週期內檢測常規,拒收和未大寫的訂單塊。 現在您可以接收到訂單塊接近警報,我們在MT4上顯示屏幕通知,並將通知推送到您的手機!
Enigmera
Ivan Stefanov
5 (9)
ENIGMERA: 市场的核心 重要提示:MQL5.com 演示版本在策略测试器中运行,可能无法完全反映 Enigmera 的功能。请查看描述、截图和视频了解详细信息。如有任何问题,请随时联系我! 该指标的代码已完全重写。版本 3.0 增加了新功能并修复了自指标发布以来积累的错误。 简介 这个指标和交易系统是金融市场的一种独特方法。ENIGMERA 使用分形周期来精确计算支撑和阻力水平。它展示了真实的积累阶段,并提供了方向和目标。无论是在趋势中还是在修正中,这个系统都能工作。 它是如何工作的 指标的大部分功能通过图表左侧的按钮控制,使得能够快速响应不同的市场情况。 按钮 ON/OFF – 显示或隐藏整个指标。 Channel – 激活支撑通道,显示可接受的偏差范围。 Dev1 (第一偏差) – 指示价格在支撑偏差内的波动,信号表示市场正在整合或积累力量。 Dev2 (第二偏差) – 显示价格在偏差之间的波动,表示趋势形成和方向。 Dev3 (第三偏差) – 表示趋势的显著加速和高波动性。 45deg (45度) – 显示市场的节奏和相对于 45 度线的运动稳定性。 Tgt1/2
First time on MetaTrader, introducing IQ Star Lines - an original Vedic Astrology based indicator. "Millionaires don't use astrology, billionaires do" . - J.P. Morgan, Legendary American financier and banker. We don't offer free or bonus indicators in exchange of reviews from you. You won't need any free products with this indicator to make it work. ;) Enjoy! Welcome to  the new and updated  IQ Star Lines , the ultimate fusion of ancient planetary harmonic cycles and modern quantitative trading.
作者的更多信息
Titan AstroCycle & Gann Time Utility is a 100% FREE educational and analytical time-cycle tool for MetaTrader 5, inspired by William D. Gann's harmonic time principles and quantitative lunar/solar cycle research. While 95% of technical indicators focus exclusively on PRICE (where the market is), institutional cycle analysis focuses on TIME (when volatility inflection points and trend exhaustion windows are statistically likely to occur). Titan AstroCycle maps both macro Synodic Lunar Phases an
FREE
Titan Prop-Firm Shield & Lot HUD is a 100% FREE institutional risk-management and position-sizing cockpit designed specifically for Prop-Firm traders (FTMO, FundedNext, The5ers, etc.) and disciplined retail traders on MetaTrader 5. Over 90% of prop-firm challenges fail due to accidental Daily Drawdown breaches or miscalculated lot sizes during high volatility. Titan Prop-Firm Shield eliminates human error by tracking your real-time Daily Drawdown, Overall Drawdown, Remaining Loss Buffer ($), a
FREE
=== TITAN NADARAYA REVERSION EA — VERSION 3.00 (MAJOR INSTITUTIONAL UPDATE) === Version 3.0 represents a complete architectural overhaul, upgrading the EA to the institutional Titan Pro standard with universal multi-asset scaling, on-chart non-repainting regression channels, and an interactive HUD cockpit. [NEW] Universal Multi-Asset Risk & Target Engine (Gold, Forex, Crypto, Indices): - Added 3 selectable SL/TP calculation modes: Dynamic ATR Multiplier, Fixed Points, and Dynamic Kernel Mean-L
FREE
Titan Oturum Öldürme Bölgeleri Smart Money Concepts (SMC) veya Market Profile yöntemlerini kullanan her profesyonel yatırımcı, zamanlamanın fiyat teslimatında kritik bir unsur olduğunu bilir. Asya birikimi, Londra manipülasyonu ve New York dağılımı algoritmik gün içi fiyat hareketinin temel sütunlarını oluşturur. Titan Session Killzones, bu kritik işlem pencerelerini temiz, profesyonel ve müdahaleci olmayan bir görsel düzen kullanarak doğrudan grafiğinize yansıtır. Temel Özellikler: Gelişmiş Oto
FREE
Titan Mini Bilgi Paneli Temiz bir grafik ortamı sağlamak, yapısal odaklanma ve doğru piyasa analizi için gereklidir. Çoğu ticaret paneli ekranı aşırı ve tekrarlayıcı metriklerle doldurur. Titan Mini Bilgi Paneli, kritik verilerin fiyat hareketi analizinizi engellemeden her zaman erişilebilir olmasını sağlayan son derece optimize edilmiş, hafif ve zarif tasarımlı bir Heads-Up Display (HUD) olup, temel piyasa istatistiklerini doğrudan grafiğinizin seçilen herhangi bir köşesine sunar. Temel Özellik
FREE
Titan NPC Pro v2.0 — Institutional Neural Edition Sürüm Notları: - Sağ Üst-Sağ Sinir Performans Kokpiti: Gerçek zamanlı kurumsal HUD eklendi; geçmişi Kazanma Oranı (%), Kazanılan Ortalama Pip, Smart Shield ADX filtre durumu (GÜVENLI vs. ENGELLENEN) ve kanal uzatma yüzdesi eklendi. - Çok Zaman Çerçevesi (MTF) Sinir Radar Matrisi: Sağ alttaki Sinir Radarı 5 zaman dilimli (M5'ten D1'e) ve seyahat matrisine yükseltildi. - Görsel Ortalama-Geri Dönüş Hedef Takibi: Sinyallerin başarıyla Rasyonel Quadr
[SÜRÜM 2.0 - KURUMSAL SÜRÜMDE YENI] * Çift Sinyal Mantığı (Geri Dönüş vs. Breakout): Ortalama Geri Dönüş modu (üst bant tükenmesini satmak, alt bant tüketimini satın almak) ile Momentum Breakout modu arasında doğrudan giriş menüsünden sorunsuz geçiş yapın. * Gerçek Zamanlı Kazanç Oranı Kokpiti: Grafikinizdeki tarihsel sinyalleri otomatik olarak değerlendirir; canlı Kazanma Oranı yüzdesi, toplam kazanma/toplam sinyaller, işlem başına ortalama pip ve görsel hedef isabet işaretleri gösterir. * Çok
Titan SMC Ultimate Suite v6.5 — Kurumsal Sürüm Çıkış Notları: - 4-Corner Institutional SMC Kokpit & MTF Radar: Kullanıcı tarafından sabitlenebilir (Üst-Sol, Üst-Sağ, Alt-Sol, Alt-Sol, Alt-Sağ) performans HUD eklendi; canlı Gerçek Sıçrama Kazanma Oranı (%), Ortalama Kar (Pips/Puan), İşlem Aralığı Premium/İndirim Oranı ve gömülü 5-Zaman Dilimi (M5-D1) BOS/CHoCH hizalama çubuğu eklendi. - Sıfır Çarpışma Bölgesi ve Likidite Etiketleme: Emir Blokları (BULL/BEAR OB), Adil Değer Boşlukları (FVG) ve BS
Titan Action HUD Pro v7.1 — Ultimate SMC Kurumsal Sürüm Çıkış Notları: - Genişletilmiş Matris Grid & Sıfır Metin Çarpışması: Ana MTF SMC Matrix panelini optimize edilmiş sütun aralığı ile 465px'e genişletti, metin örtüşmelerini (örneğin [ACTIVE]OPEN etiketleri) ortadan kaldırdı ve volatilite rozetlerinde sağ kenar dolgu taşmalarını düzeltti. - Kalıcı Çok Zaman Dilimli Yapı Motoru: BOS/CHoCH yapısal analiz algoritmasını tek çubuklu tetikleyicilerden kalıcı rejim takibine (örneğin, BULLISH BOS ↑,
Titan SuperTrend AI Standart trend takip göstergeleri, piyasa dalgalanmaları ani değişimler geçirdiğinde genellikle tutarlı performans göstermekte zorlanır. Titan SuperTrend AI, son fiyat hareketlerini sistematik olarak değerlendirmek için tasarlanmış dinamik bir dönem tarama mekanizması kullanarak bu zorluğu ele alıyor. Sabit, statik değişkenlere dayanmak yerine, algoritma grafik başlatma veya sembol değişikliklerinde tarihsel mumları analiz ederek belirli varlığın mevcut volatilite profiline u
Titan Tri-Filter EA Titan Tri-Filter EA, yapılandırılmış trend sömürü ve hassas risk azaltma için tasarlanmış gelişmiş bir algoritmik işlem sistemidir. Makro-yönlü trendleri kısa vadeli momentum sinyalleriyle sistematik olarak hizalayarak, algoritma gün içi piyasa gürültüsünü filtrelemeyi ve çok katmanlı teknik koşullar sağlandığında işlemleri yalnızca gerçekleştirmeyi amaçlar. Çekirdek Mimari (Üç Katmanlı Filtreleme Mantığı): Katman 1: Makro Trend Filtresi (Günlük Temel): Birincil piyasa yanlıl
[SÜRÜM 2.0 - KURUMSAL SÜRÜMDE YENI] * Çift Sinyal Mantığı (Geri Dönüş vs. Breakout): Ortalama Geri Dönüş modu (üst bant tükenmesini satmak, alt bant tüketimini satın almak) ile Momentum Breakout modu arasında doğrudan giriş menüsünden sorunsuz geçiş yapın. * Gerçek Zamanlı Kazanç Oranı Kokpiti: Grafikinizdeki tarihsel sinyalleri otomatik olarak değerlendirir; canlı Kazanma Oranı yüzdesi, toplam kazanma/toplam sinyaller, işlem başına ortalama pip ve görsel hedef isabet işaretleri gösterir. * Çok
Titan SuperTrend Pro (v3.0) is an institutional-grade trend-following and volatility-tracking system engineered for MetaTrader 5. While standard SuperTrend implementations rely on static parameters that often lag or generate whipsaws during regime shifts, Titan SuperTrend Pro integrates an internal AI Auto-Optimizer Engine, live target projections, and a multi-timeframe institutional cockpit to deliver objective, non-repainting trade execution. Built upon a robust Average True Range (ATR) archi
Titan Risk Master Pro Scalperlar ve günlük işlem yapanlar için, yüksek piyasa dalgalanma dönemlerinde uygulama hızı ve risk hassasiyeti kritik öneme sahiptir. Pozisyon büyüklüklerini, risk yüzdelerini ve stop-loss değerlerini manuel olarak hesaplamak, uygulama gecikmelerine ve hesaplama hatalarına yol açabilir. Titan Risk Master Pro, pozisyon boyutlandırma ve işlem yönetimi iş akışlarınızı tamamen otomatikleştirmek için tasarlanmış kapsamlı bir grafik üzerinde risk yönetimi ve işlem uygulama kon
Titan SMC Ultimate Suite v6.5 — Kurumsal Sürüm Çıkış Notları: - 4-Corner Institutional SMC Kokpit & MTF Radar: Kullanıcı tarafından sabitlenebilir (Üst-Sol, Üst-Sağ, Alt-Sol, Alt-Sol, Alt-Sağ) performans HUD eklendi; canlı Gerçek Sıçrama Kazanma Oranı (%), Ortalama Kar (Pips/Puan), İşlem Aralığı Premium/İndirim Oranı ve gömülü 5-Zaman Dilimi (M5-D1) BOS/CHoCH hizalama çubuğu eklendi. - Sıfır Çarpışma Bölgesi ve Likidite Etiketleme: Emir Blokları (BULL/BEAR OB), Adil Değer Boşlukları (FVG) ve BS
Titan Z-Score Pro v3.2 Sürüm Notları: Kurumsal UI/UX Yeniden Tasarımı: Performans kokpitleri ve MTF matrisleri ana harita köşelerine taşındı, böylece tertemiz, dağınıklıktan arındırılmış bir alt pencere görünümü sağlandı. Canlı Kazanma Oranı ve Geri Dönüş Kokpiti: Ortalama geri dönüş başarı oranının ve kazanılan ortalama piplerin gerçek zamanlı takibi eklendi. Çok Zaman Dilimi Z-Puan Matrisi: Ana tabloya doğrudan görsel olarak 5 zaman dilimli (M5'ten D1'e) bir durum ızgarası entegre edildi. Yen
Titan FX Power - Currency Strength Matrix for MetaTrader 5 Standard currency strength tools fill the chart with overlapping lines that are hard to read. Titan FX Power turns 8 major currencies (USD, EUR, GBP, JPY, CHF, AUD, CAD, NZD) into a clean, ranked, real-time leaderboard, so you can see who is strong and who is weak at a glance. FOUR ANALYTIC ENGINES IN ONE INDICATOR Choose the engine that fits your trading style: - RSI: directional momentum and structural trend strength. - Stochastic:
Titan Auto RSI Scalper Standart Göreli Güç Endeksi (RSI) algoritmaları, güçlü yönlü piyasa genişlemeleri sırasında genellikle erken karşı trend sinyalleri üretir. Titan Auto RSI Scalper, bu sınırlamayı kısa vadeli momentum anormalliklerini makro piyasa yönü ile uyumlu hale getirmek için tasarlanmış kurumsal düzeyde bir trend filtreleme modülü ekleyerek gideriyor. Uzman Danışman, yalnızca temel uzun vadeli trende göre işlemler yaparak, sahte kırılmalar ve yüksek volatiliteli piyasa gürültüsüyle i
=== TITAN APEX VOLATILITY PRO — VERSION 5.00 (MAJOR VISUAL & ALGORITHMIC UPGRADE) === [NEW] Multi-Color Dynamic Baseline MA & Volatility Bands: - Upgraded the center Baseline Moving Average to a dynamic color-changing trailing stop line (Green on Bullish Breakout, Red on Bearish Breakout, Gold during Consolidation). - Added high-visibility Upper and Lower Adaptive ATR Breakout envelopes. [YENI] Canlı TP1 / TP2 Hedef Projeksiyonları ve Takip Eden SL Etiketleri: - Gerçek zamanlı Giriş, TP1 (1.5x
Titan Pulse Oscillator Titan Pulse Oscillator is a momentum oscillator built on the WaveTrend calculation. It measures how far price (typical price: high, low, close) has moved from its smoothed average, normalised by recent volatility, and plots the result as two lines with a colour-coded histogram ribbon. Volume is not used in the calculation. On top of the oscillator core, the indicator adds an automatic divergence engine, filtered cross signals, live target lines, a multi-timeframe matrix
Ürün Tanımı Titan Likidite ve Boşluk Avcısı: Grafikinizde Kurumsal Sipariş Akışı Çoğu perakende tüccar fiyatı görür. Kurumlar likiditeyi görür. Titan Liquidity & Gap Hunter, Smart Money Concepts'te önemli olan üç şeyi (piyasa yapısı, Adil Değer Boşlukları ve likidite havuzları) haritalandırıyor ve bunları tek bir temiz, modern gösterge paneline topluyor. Ne yapar Piyasa Yapısı (BOS / CHOCH): Doğrulanmış salınım noktalarından trend devamlarını (Yapı Kırılması) ve tersine dönüşleri (Karakter Deği
Titan Action HUD Pro v7.1 — Ultimate SMC Kurumsal Sürüm Çıkış Notları: - Genişletilmiş Matris Grid & Sıfır Metin Çarpışması: Ana MTF SMC Matrix panelini optimize edilmiş sütun aralığı ile 465px'e genişletti, metin örtüşmelerini (örneğin [ACTIVE]OPEN etiketleri) ortadan kaldırdı ve volatilite rozetlerinde sağ kenar dolgu taşmalarını düzeltti. - Kalıcı Çok Zaman Dilimli Yapı Motoru: BOS/CHoCH yapısal analiz algoritmasını tek çubuklu tetikleyicilerden kalıcı rejim takibine (örneğin, BULLISH BOS ↑,
Titan AI Volume Cluster Sniper v2.1 — Kurumsal Sürüm Sürüm Notları: - Ergonomik Sol Taraf HUD Mimarisi: Kurumsal Performans Kokpiti (Üst-Sol) ve Çoklu Zaman Aralığı Hacim Matrisi (Alt-Sol) çalışma alanının sol tarafına taşındı, böylece sağ taraftaki K-Means ses profili çubuklarıyla görsel örtüşmeler sıfır sağlandı. - POC Keskin Nişancı Zıplama ve Reddetme Sinyalleri: Fiyat yüksek yoğunluklu Kontrol Noktası (POC) küme merkezlerine tepki verdiğinde, canlı Kazanma Oranı (%) ve Ortalama Pip takibi i
Titan Specter Cloud Pro v5.5 — Kurumsal Gradient ve Kokpit Sürüm Notları: - 4 Katmanlı Gradient Bulut Mimarisi: Envelope görsel motoru çift bölgeli (İç ATR200 Bulut + Dinamik Otomatik Çarpan Dış Bant) 4 katmanlı opaklık karışımı gradyan sistemine yükseltildi ve parlayan Retest Elmasları kullanıldı. - Standartlaştırılmış 4-Köşeli Dinamik Kokpit: Kullanıcı tarafından seçilebilen 4 köşeli ankramlama (Üst-Sol, Üst-Sağ, Alt-Sol, Alt-Sağ) ve otomatik harita boyutlandırma adaptasyonu eklendi. - Canlı Y
Titan NPC Pro v2.0 — Institutional Neural Edition Sürüm Notları: - Sağ Üst-Sağ Sinir Performans Kokpiti: Gerçek zamanlı kurumsal HUD eklendi; geçmişi Kazanma Oranı (%), Kazanılan Ortalama Pip, Smart Shield ADX filtre durumu (GÜVENLI vs. ENGELLENEN) ve kanal uzatma yüzdesi eklendi. - Çok Zaman Çerçevesi (MTF) Sinir Radar Matrisi: Sağ alttaki Sinir Radarı 5 zaman dilimli (M5'ten D1'e) ve seyahat matrisine yükseltildi. - Görsel Ortalama-Geri Dönüş Hedef Takibi: Sinyallerin başarıyla Rasyonel Quadr
Titan Score EA v2.0 — Kurumsal Prop-Firması ve Etkileşimli Kokpit Sürüm Notları: - Etkileşimli 4-Köşeli Kurumsal Kokpit: Harita üzerindeki HUD'u çift SAT/SAT Birleşme kartları, katman katman dağılım, canlı Floating PnL ve etkileşimli [TÜM POZISYONLARI KAPAT] ve [DURAKLATMA/DEVAM ET] butonları ile yeniden tasarlandı. - Canlı Grafik Üzerinde SuperTrend ve Uygulama İşatörleri: Artık renk kodlu SuperTrend yapısal çizgisi ve ticaret giriş oklarını doğrudan grafik çalışma alanında otomatik olarak ren
What's new in v3.00 Titan Prop Master has been rebuilt with a full cockpit and stronger prop firm protection. Cockpit (HUD) - Movable panel: drag the header anywhere, or press CORNER to jump between the four chart corners. Position is remembered per symbol. - MTF matrix: EMA and SuperTrend direction on M5, H1, H4 and D1, with a combined BUY / SELL / neutral bias row. - Risk bars: daily, weekly, monthly and overall loss versus your limits, with colour warnings as you approach them. - Performanc
Titan SMT & Correlation Sniper Pro (v2.3) is an institutional-grade multi-asset analysis and trade-timing suite engineered for MetaTrader 5. Built for professional traders and prop-firm managers, this indicator bridges the gap between classic Smart Money Concepts (ICT/SMT Divergence) and quantitative Statistical Arbitrage (Z-Score Mean Reversion). Unlike standard retail indicators that blindly look at a single chart, Titan SMT continuously scans and measures real-time Pearson correlation acros
Titan Kalman Quantum Trend Pro (v2.0) is an institutional-grade, zero-lag state-space trend and velocity tracking system engineered for MetaTrader 5. While traditional moving averages (EMA, SMA, Hull) rely on historical price averaging that inevitably lags behind sudden market movements, Titan Kalman Quantum Pro utilizes a 2-Dimensional Kinematic Kalman Filter to estimate both real-time price trajectory (Position State) and underlying market momentum (Velocity State) simultaneously. Combined w
Titan Reversal is a bottom/top reversal indicator that aggregates multiple independent signals into a single score, rather than relying on a solitary indicator. How does it work? For every candle, the indicator evaluates various components, including Williams %R, Stochastic RSI, buying/selling pressure, 9-13 counts, RSI/MACD/CCI/OBV divergences, Parabolic SAR, volume momentum, liquidity sweeps, and rejection candles. These components are categorized into four "families" (momentum, flow, struct
筛选:
无评论
回复评论