Cluster Pattern Frequency
- 指标
- 版本: 1.0
- 激活: 5

# Cluster Pattern Frequency - Eight sequences and their statistics
*Category: Pattern Recognition | Difficulty: advanced | Window: separate window below the chart | Markets: Universal (Forex, indices, commodities, crypto, stocks) | Suggested timeframes: M30, H1, H4, D1*
## Short description
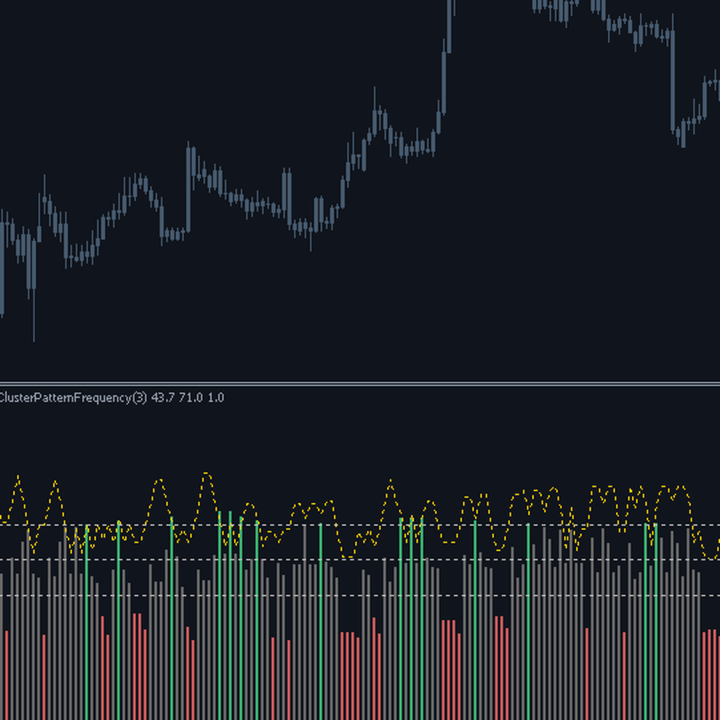
> Encodes every three bar sequence into one of eight possible configurations and measures the historical frequency of it being followed by an upward move.
## Full description
### Overview
Every three bar sequence can be encoded as a three digit binary number, using simply the sign of each bar: eight possible configurations in all, from three bearish bars to three bullish ones. This indicator identifies the current configuration, searches history for every time the same one occurred, and measures what followed: what percentage of those cases was followed by an upward move within the chosen horizon. The result is not a forecast but a frequency observed on this specific instrument. On many markets it will come out near fifty per cent, and that is itself valuable information: it means that sequence has no predictive value, and anyone trading it is betting on a regularity that does not exist.
### How the calculation works
1. Each bar contributes one bit: one if the close exceeds the open, zero otherwise.
2. The most significant bit is the oldest bar of the triple, so the code reads the sequence in chronological order.
3. The outcome of every past bar is the change realized within the chosen horizon.
4. The historical case search starts InpHorizon bars back: only those cases have a fully observed outcome.
5. This constraint guarantees no future information ever enters the value shown on the current bar.
6. If fewer than InpMinCases cases are found the frequency is not shown: too small a sample is unreliable.
### How to use it
- Always look first at the case count line: a frequency computed on few cases has no value.
- Frequencies near fifty per cent mean that sequence has no predictive value on this market.
- Use the frequency to size the position, not to decide whether to enter: sixty per cent still leaves forty per cent of contrary cases.
- Comparing frequencies across instruments reveals which markets have short term regularities and which do not.
- Increase the horizon to measure slower effects, knowing the usable cases decrease.
### Who it is for and on which timeframes
It targets quantitatively minded traders who can tell an observed frequency from a forecast, a distinction essential to using it correctly. It works from M30 to D1. Its most honest use is precisely to verify that bar sequences have no predictive power on most markets: it is a tool serving as much to find regularities as to disprove supposed ones. It requires deep history to produce meaningful samples.
### Practical example of reading a signal
On EURUSD H4 the current sequence is three consecutive bearish bars, code zero. The indicator finds sixty one identical cases over the last five hundred bars. Of these, in thirty one price rose over the following three bars: the frequency is fifty point eight per cent, practically identical to a coin flip. The histogram stays grey. The correct conclusion is not that the pattern is weak, but that it does not exist at all: on that market three bearish bars say nothing about what comes next. A trader with a strategy based on that sequence has just discovered, in thirty seconds, that it has no foundation.
## Input parameters
| Parameter | Default | Description |
|---|---|---|
| `InpLookback` | 500 | History searched for similar cases. The wider it is the more cases are found, but computational cost grows. Internally capped at 3000. |
| `InpHorizon` | 3 | Bars within which the outcome is measured. It defines which effect is being sought: immediate or longer term. |
| `InpMinCases` | 15 | Minimum cases for the frequency to be shown. Below this threshold the value stays neutral. |
| `InpEdgeLevel` | 60.0 | Frequency beyond which the case is deemed notable and the histogram is coloured. |
## Advantages / strengths
- It replaces a belief with a measure verifiable on the instrument real data.
- It explicitly shows the sample size, allowing the reliability of every value to be judged.
- The eight configuration encoding exhaustively covers every possible three bar sequence.
- No repaint: the search uses only cases whose outcome is already fully observed.
## Limitations and warnings
- A historical frequency is not a future probability and must not be used as one.
- The encoding uses only the sign of the bars and completely ignores their size.
- On many markets all eight configurations come out near fifty per cent, and the indicator stays grey throughout.
- Searching hundreds of bars on every bar carries a substantial computational cost.
**No repaint:** values printed on a closed bar are never modified afterwards.
**Disclaimer.** This product is a technical analysis tool, not an automated trading system, and it offers no profit guarantee whatsoever. Financial markets carry the risk of total loss of the invested capital. Past performance is not indicative of future results. Every signal must be confirmed with your own analysis, a money management plan and prior testing on a demo account. The author is not responsible for trading decisions taken on the basis of this indicator.
## Suggested tags / keywords for MQL5
`pattern`, `frequency`, `statistics`, `backtest`, `sequence`, `probability`, `no repaint`, `validation`