Gotobi Overnight JPY
- 专家
- 版本: 1.0
- 激活: 10

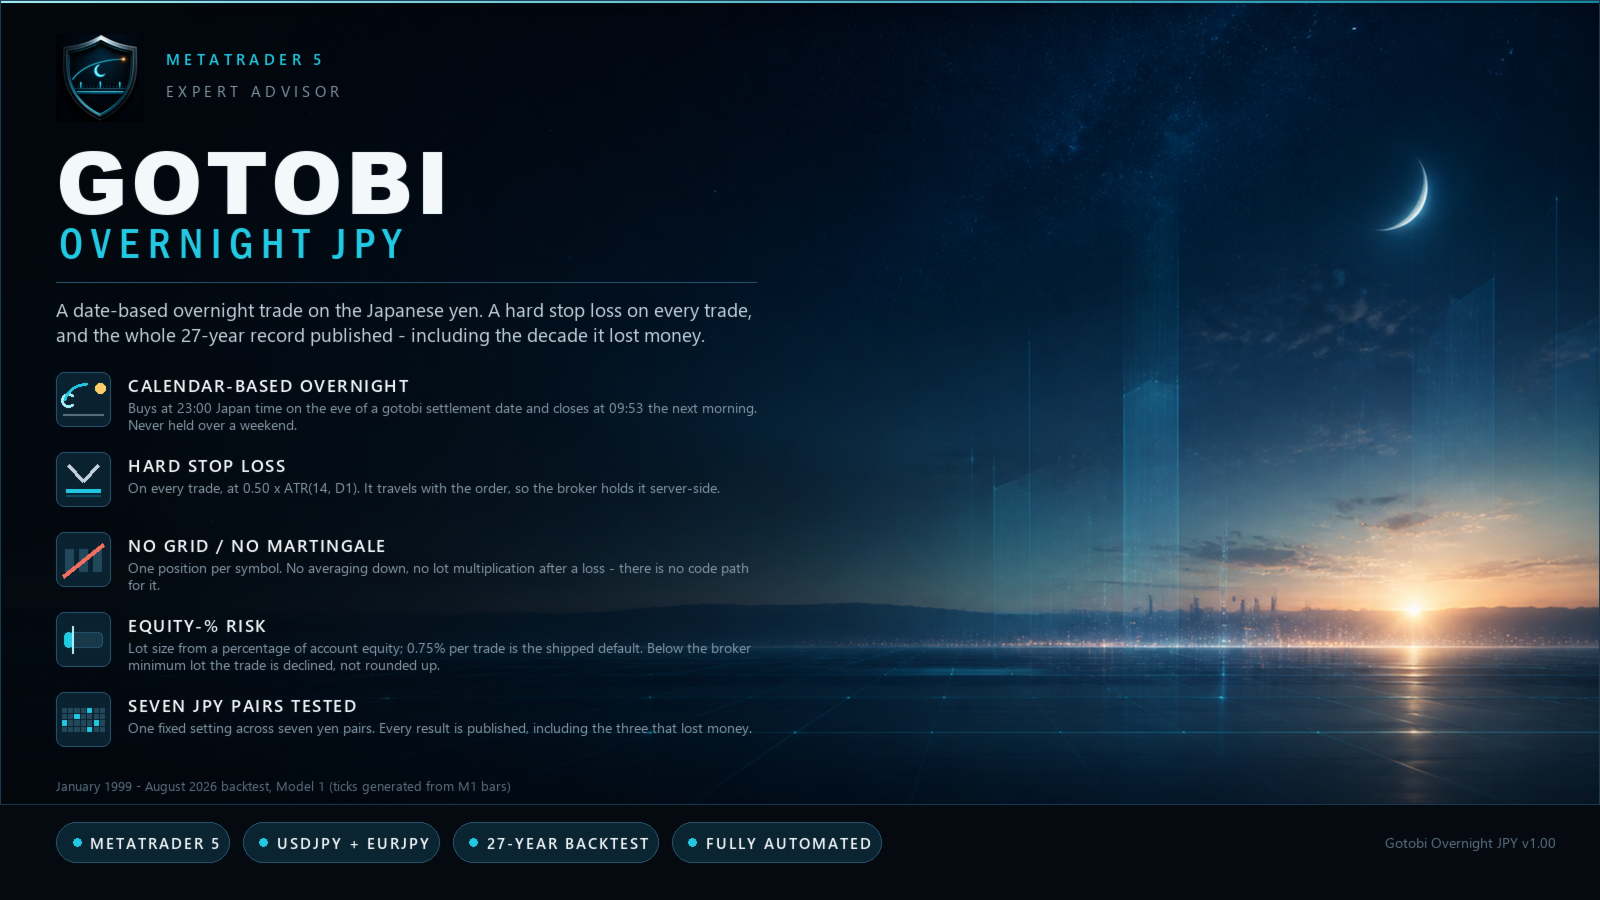
Gotobi Overnight JPY - a calendar strategy on the Japanese yen.
No grid, no martingale, no averaging down, hard SL on every trade.
Symbol: USDJPY and EURJPY
Timeframe: any - the schedule is a clock, not a bar
Risk per trade: 0.75% of equity, capped at 2.0% in code
Japanese firms settle invoices on days ending in 5 or 0 - gotobi days - and their
banks buy foreign currency to do it. This EA buys USDJPY and EURJPY at 23:00
Japan time on the eve of a gotobi date and closes at 09:53 next morning, before
the 09:55 fixing in Tokyo. Long only, one position per symbol, a hard stop at
0.5 x ATR(14) of the daily chart. About 129 trades a year; 83% end at the
time exit, 17% on the stop. We do not claim the fixing
spike itself - the flow arrives before the fix.
Bank holidays move gotobi dates, so the EA computes them from Japanese statute
instead of a table: all 604 from 1998 to 2027, zero mismatches, no expiry date.
The equinox formula holds for 1980-2099, and a one-off holiday from a future law
cannot be predicted - one date moves by a day, the EA does not stop.
== BACKTEST RESULTS ==
January 1999 - August 2026 (27 years 8 months), USDJPY + EURJPY, 0.75% risk,
compounded on one account. Tick model: Model 1 (ticks generated from M1 bars).
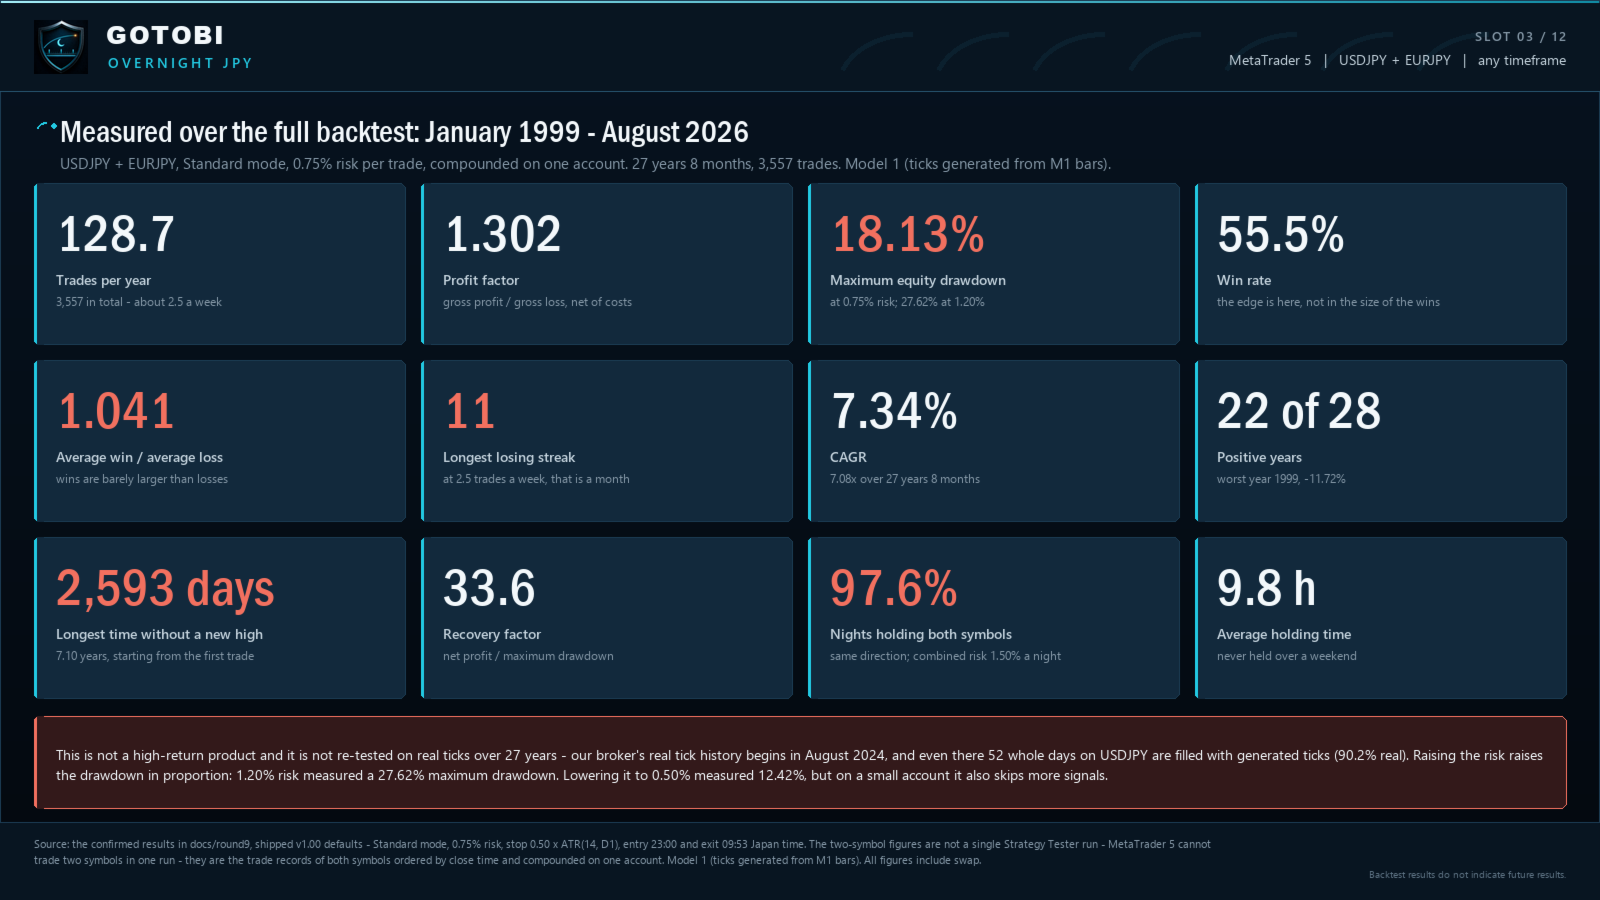
129 trades a year (3,557 total). CAGR 7.3%
Profit factor 1.30. Win rate 55.5%. Average win / loss 1.04
Maximum drawdown 18.1% at 0.75% risk, 12.4% at 0.50%, 27.6% at 1.20%
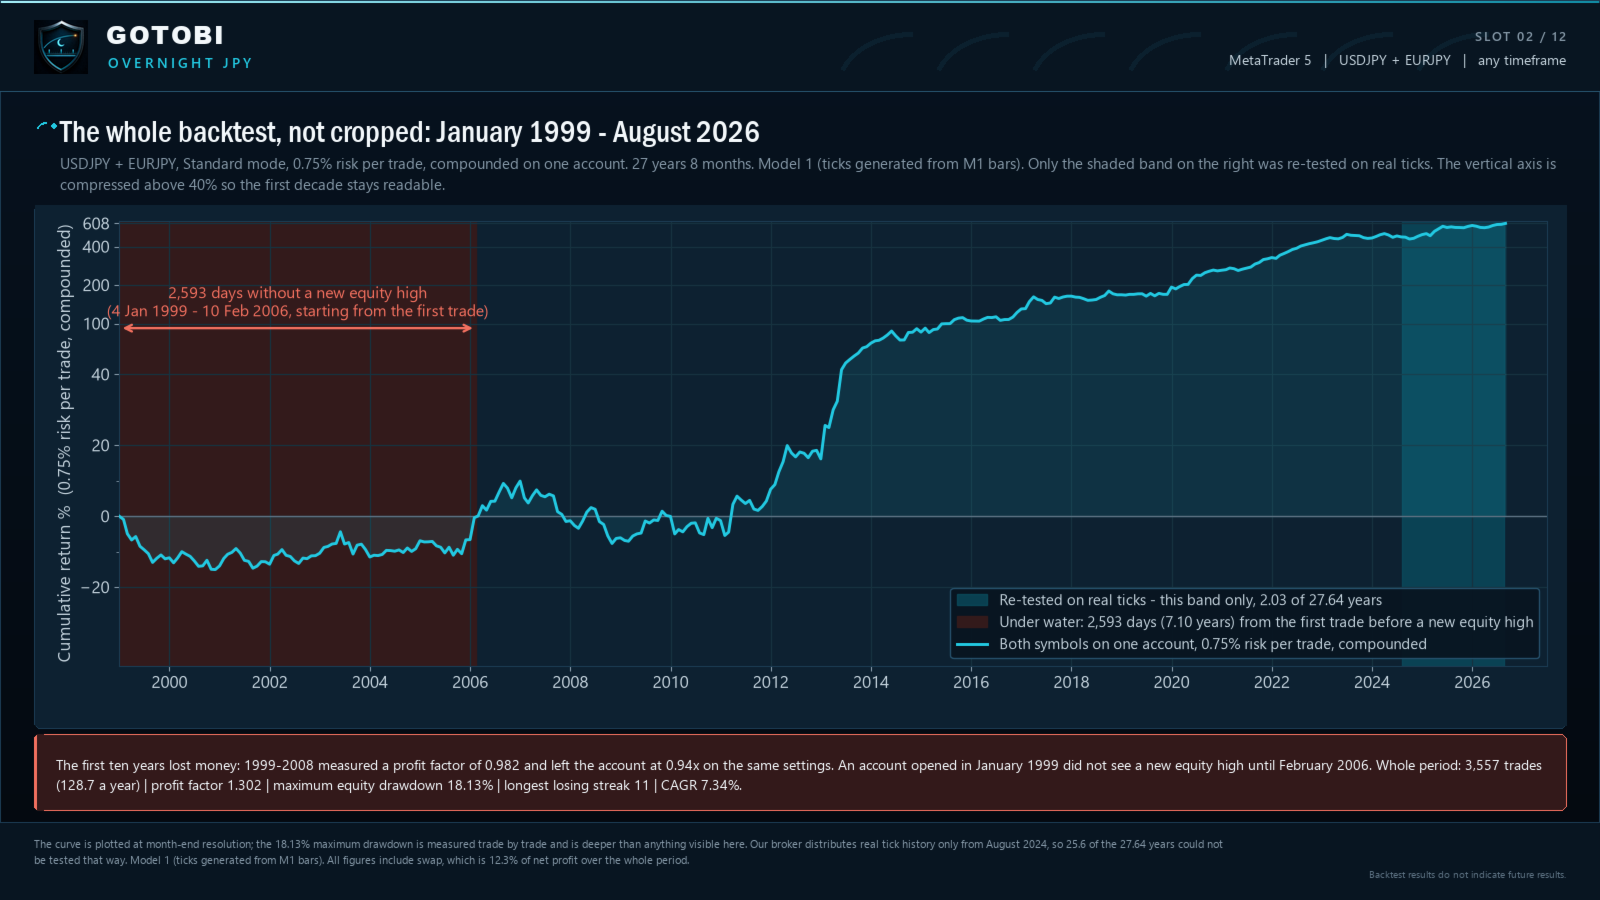
Longest losing streak 11. Longest flat period 2,593 days (7.10 years)
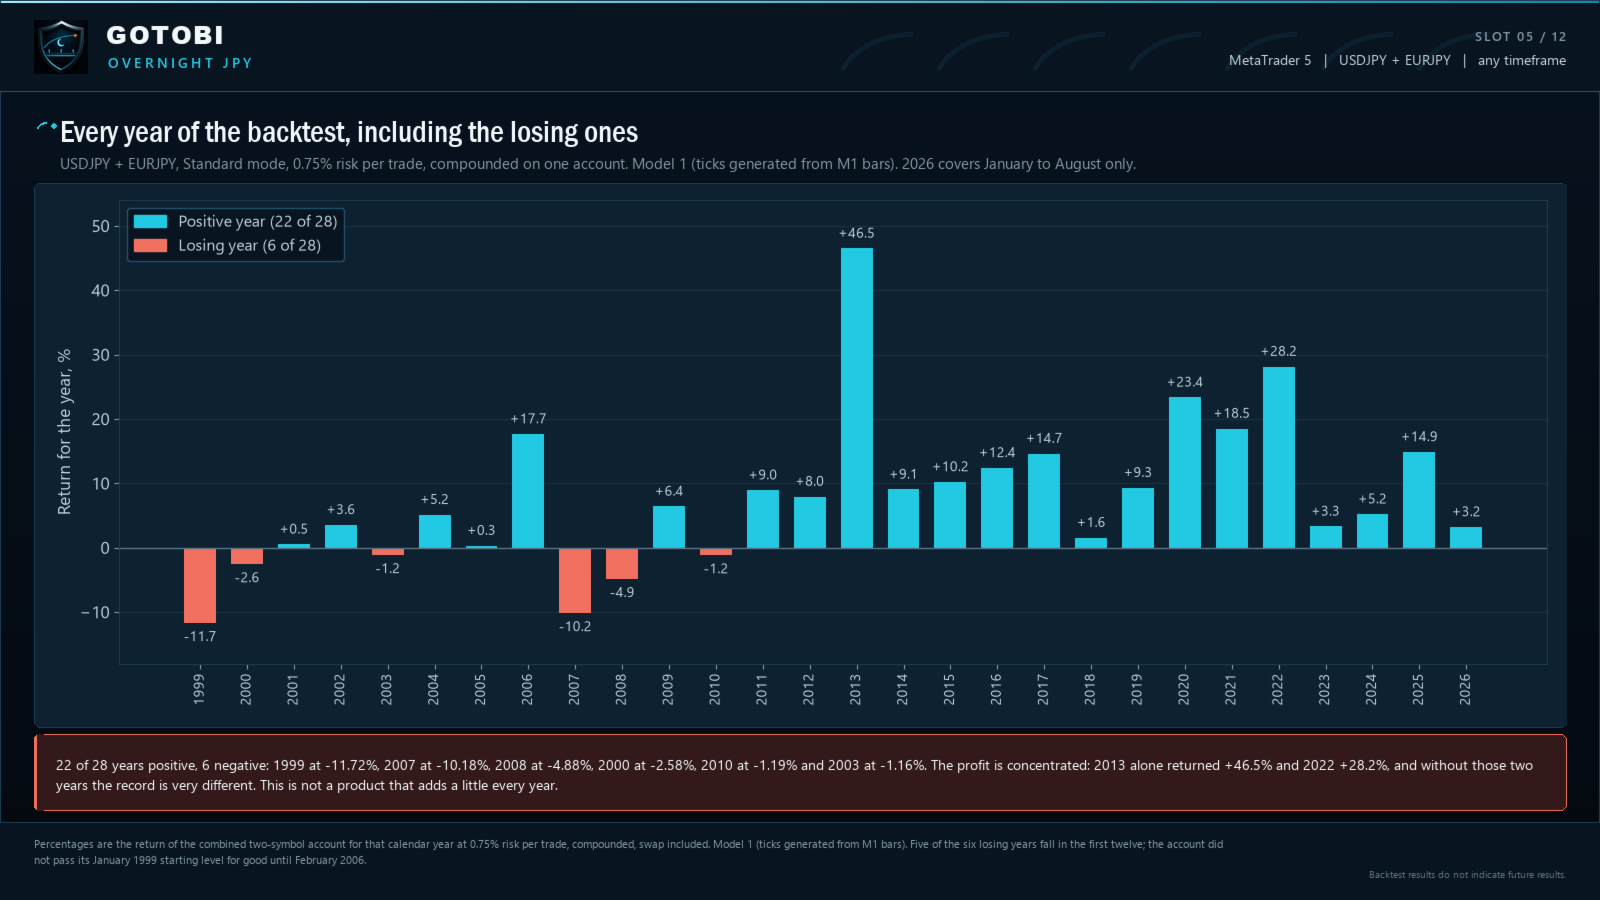
Positive in 22 of 28 years. Worst year 1999, -11.7%
Those 2,593 days start on day one: an account opened in January 1999 was back at
its starting equity in February 2006 (screenshot 2).
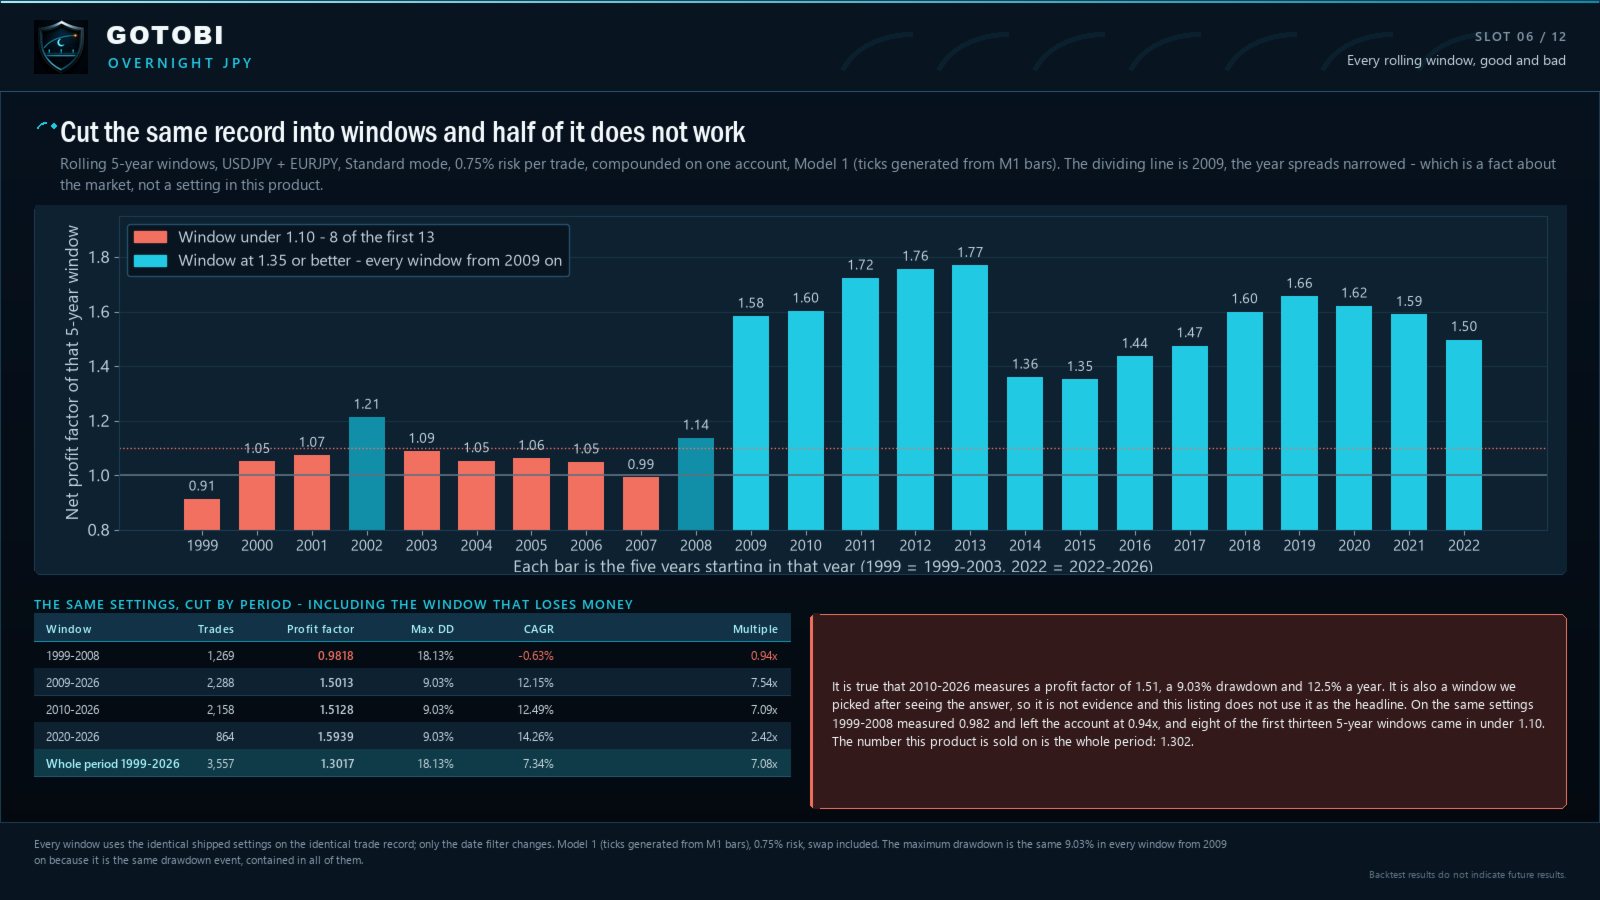
1999-2008 lost money on these settings - profit factor 0.982, 0.94x equity. The
figures above only appear from 2009, when spreads narrowed (2010-2026: PF 1.51,
drawdown 9.0%), a window we would be choosing after seeing it (screenshot 6).
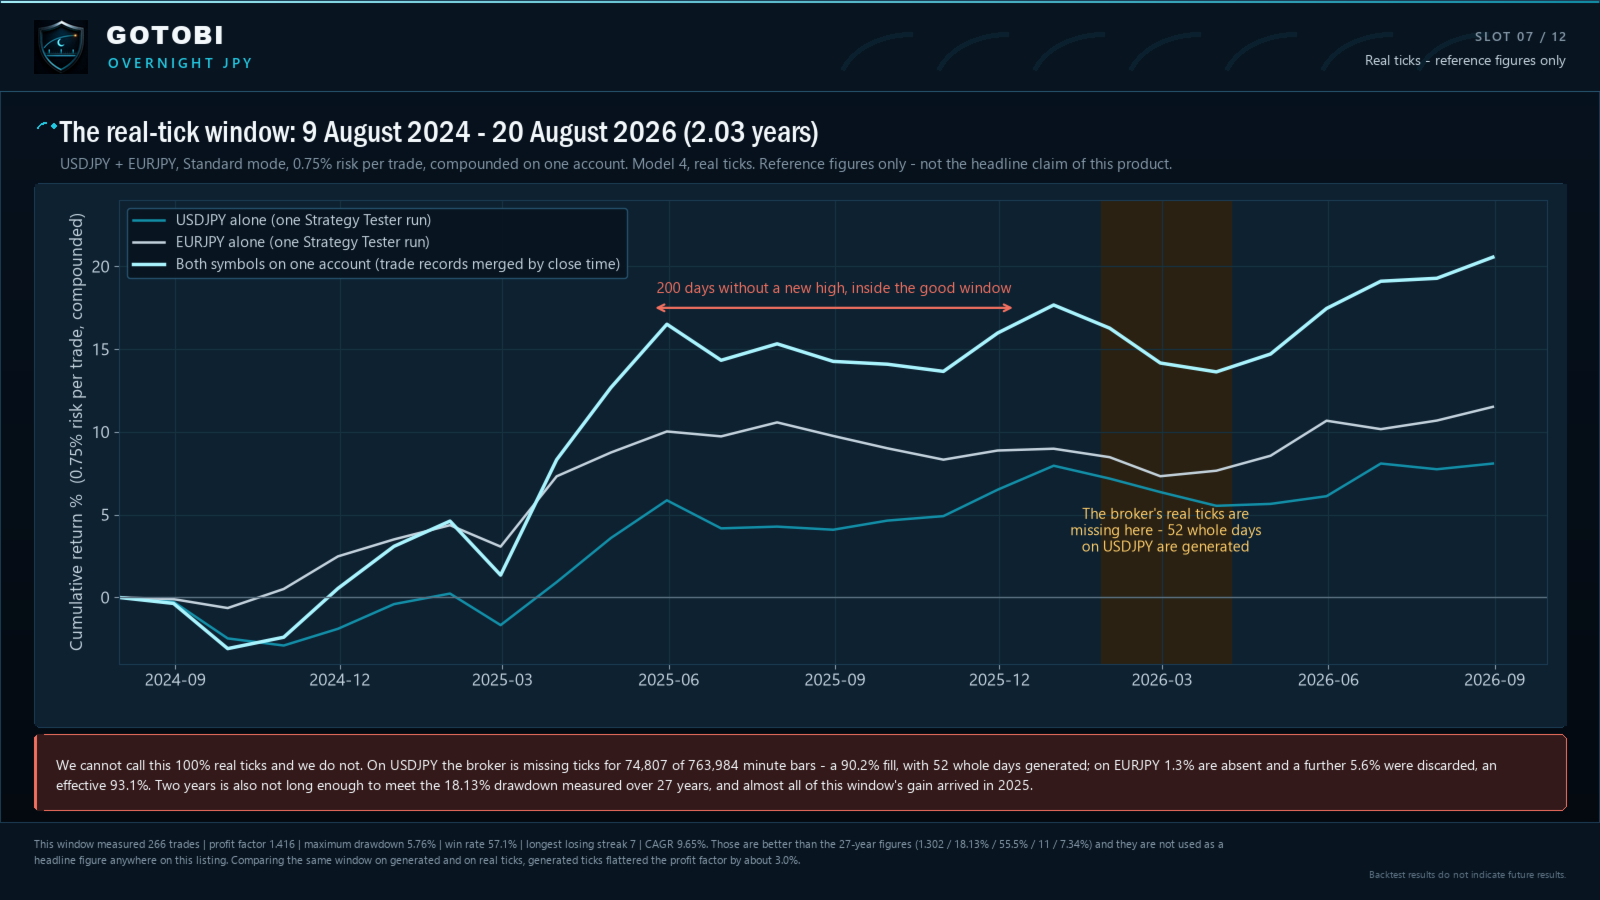
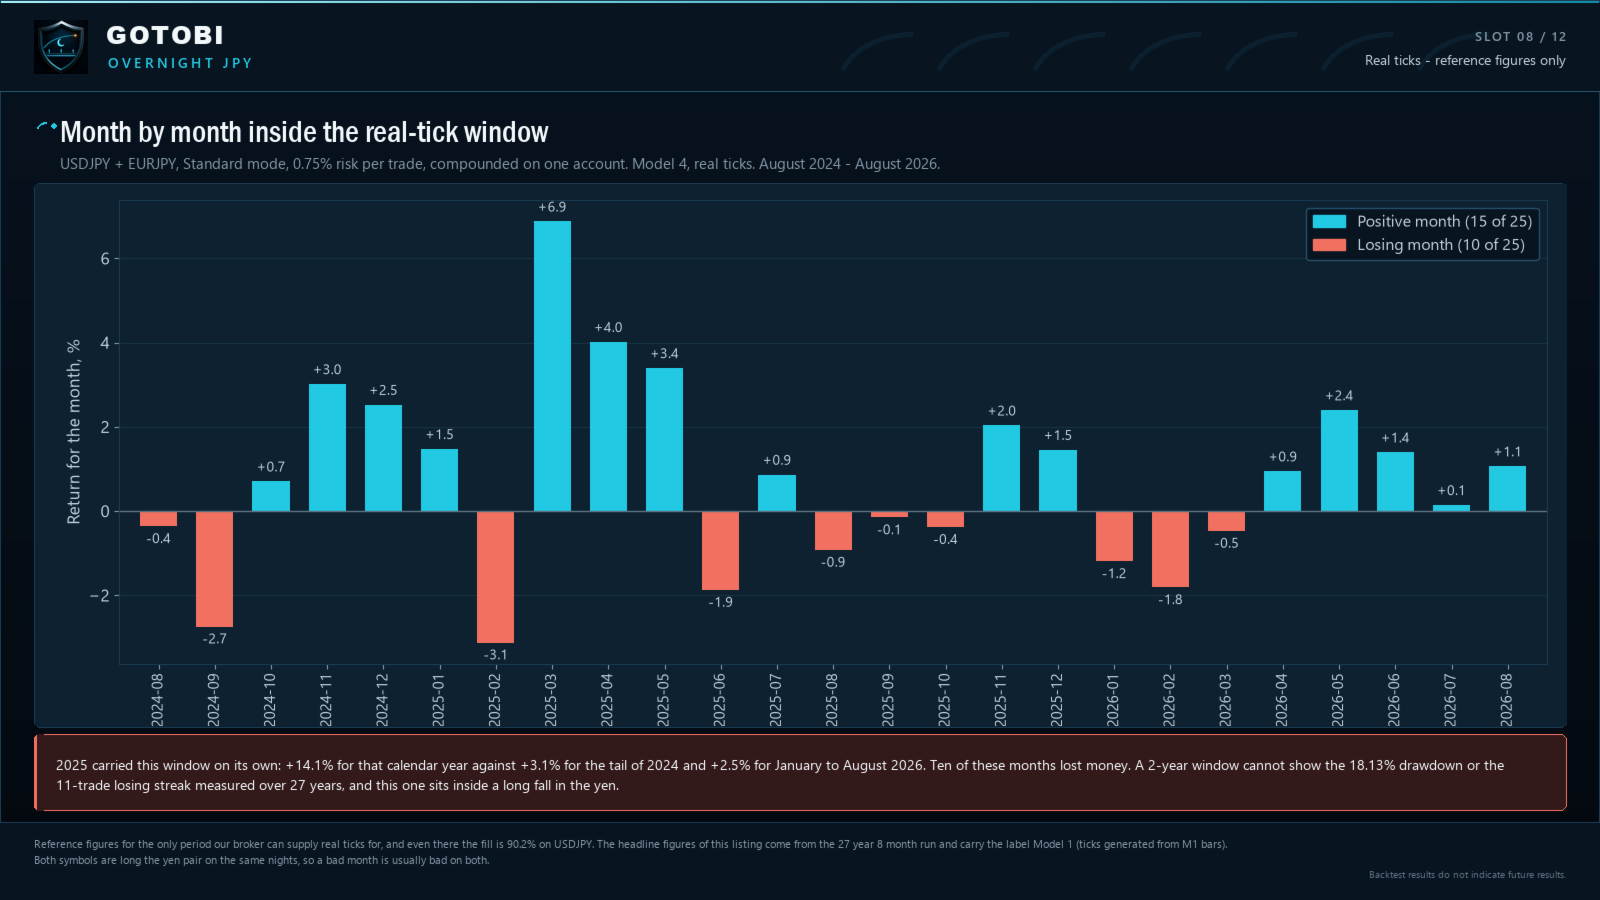
Real ticks (Model 4) cover only August 2024 - August 2026, about 2 years, and 52
whole days of USDJPY are missing inside it (90.2% tick coverage), so "100% real
ticks" is not something we can write. That window - 266 trades, PF 1.42, drawdown
5.8% - is reference only, never our headline, and generated ticks flatter the
result by about 3%.
Every figure here includes swap, which is 12.3% of net profit and not negligible.
Without swap the run is PF 1.25 with a 19.5% drawdown: not a carry trade, but a
with-swap number.
== HOW WE TRIED TO BREAK IT ==
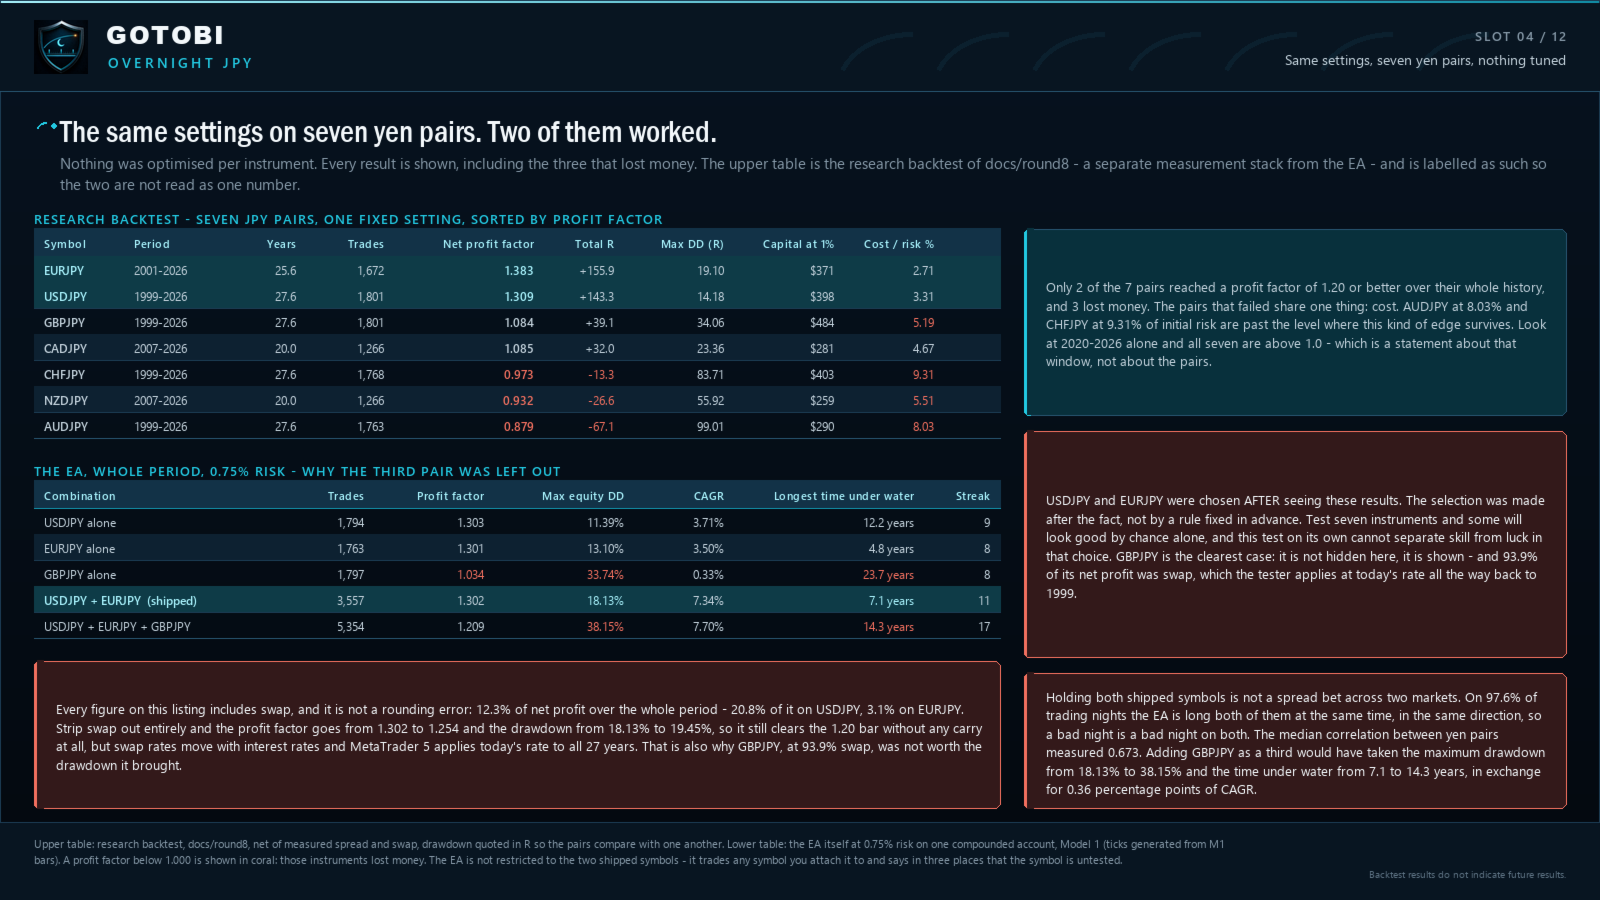
The same settings on seven yen pairs, nothing tuned. Three lost money (AUDJPY
0.88, NZDJPY 0.93, CHFJPY 0.97); full table on screenshot 4. USDJPY and EURJPY are a post-hoc selection.
GBPJPY we left out although it did not lose: it takes maximum drawdown from 18.1%
to 38.2%, the flat period from 7.1 to 14.3 years and the losing streak from 11 to
17, for 0.36 points of CAGR, and 93.9% of its profit was swap. The EA still
trades it and any other symbol (MQL5 forbids symbol locks), flagging [UNTESTED
SYMBOL] off tested ground.
Against 300 randomised sets of dates put through the identical exit machinery,
each shipped symbol sits at the 100th percentile of its own null distribution
(p = 0.0033 for each), so the dates do carry information - but
random weekdays held the same way already return a median PF of 1.04 on USDJPY
and 1.10 on EURJPY, leaving the gotobi calendar itself worth about +0.27 and
+0.29 of profit factor.
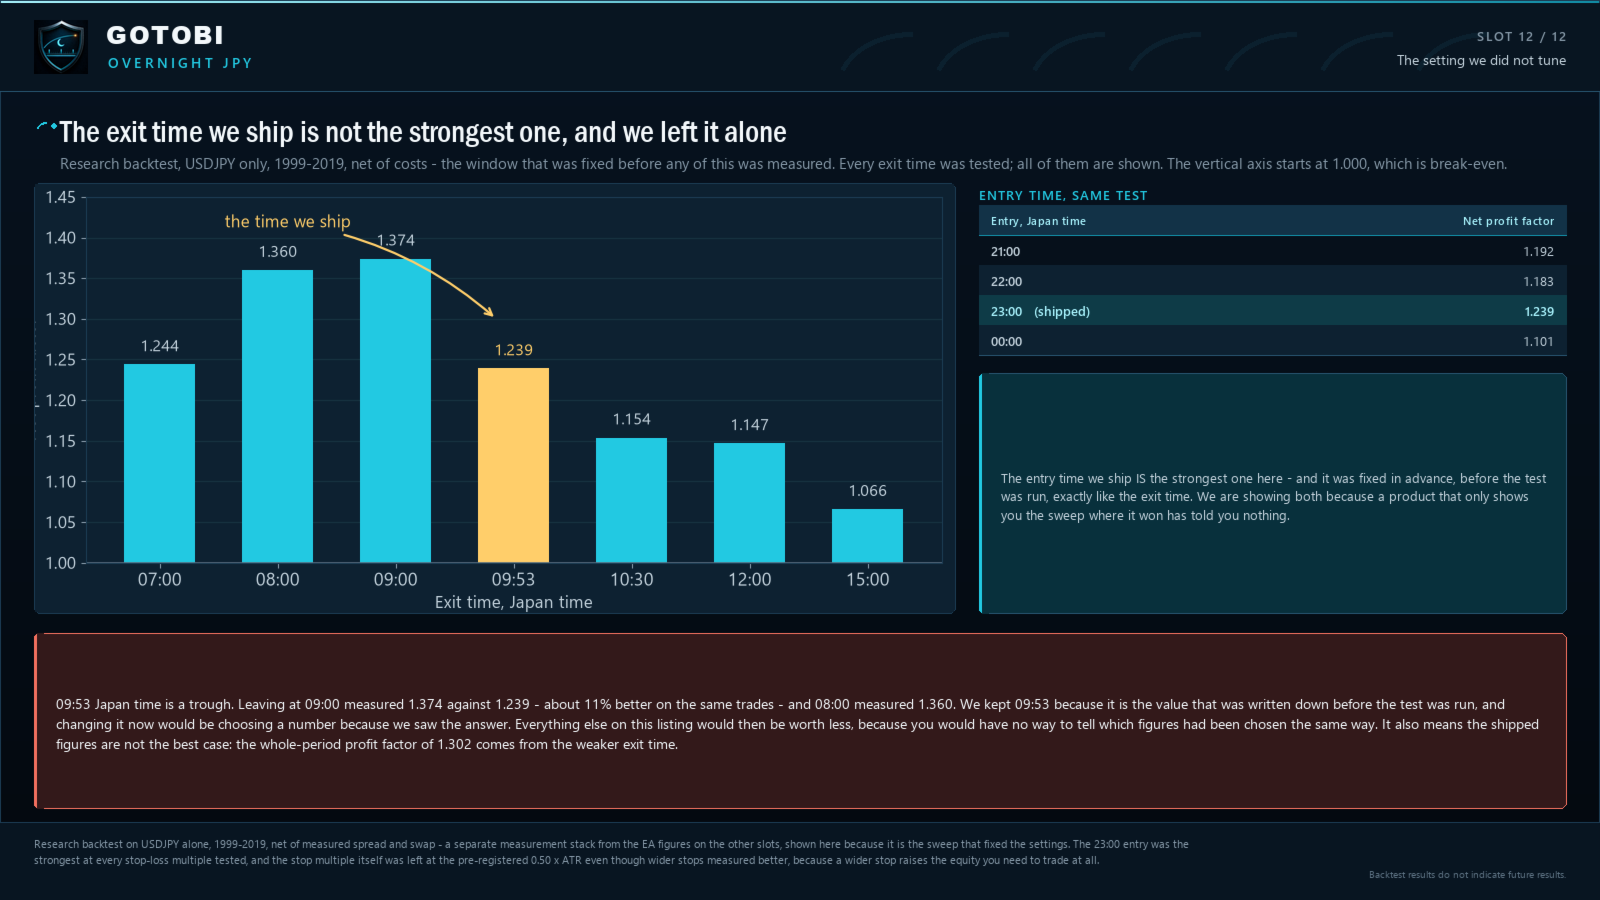
09:53 is not the best exit we measured: 09:00 scored 1.37 against 1.24. We could
justify 09:53 before looking, two minutes before the 09:55 fixing; moving it
would make it a number chosen after seeing the answer. Exit times: screenshot 12.
The 24 rolling five-year windows (eight below 1.10, all before 2011) are in the
shipped documents.
== RISK PER TRADE ==
0.75% of equity per trade, on each symbol: the figure in the .set files, and the
one every drawdown above assumes. The code caps risk
at 2.0%. Return and drawdown move together, and lowering risk raises the account
you need in exact proportion. Orders are sized from your equity and the
distance to the stop, and when your broker's smallest lot would exceed that
percentage, the EA declines the trade rather than round the risk up.
Two symbols is not risk spread across two markets. On 97.6% of trading nights
both are open at once in the same direction, and yen pairs move together (median
correlation 0.673 across the seven). That is 1.50% of equity at risk in one
night, and every symbol we added raised drawdown in proportion.
== WHAT IS BUILT IN ==
- Hard stop loss on every position, sent with the order and verified afterwards;
if it cannot be placed, the position is closed
- Time exit at 09:53 Japan time, win or lose
- Daily loss and profit limits - they watch this EA's own trades on its own
symbol, not your account as a whole
- Spread protection as a percentage of the stop distance
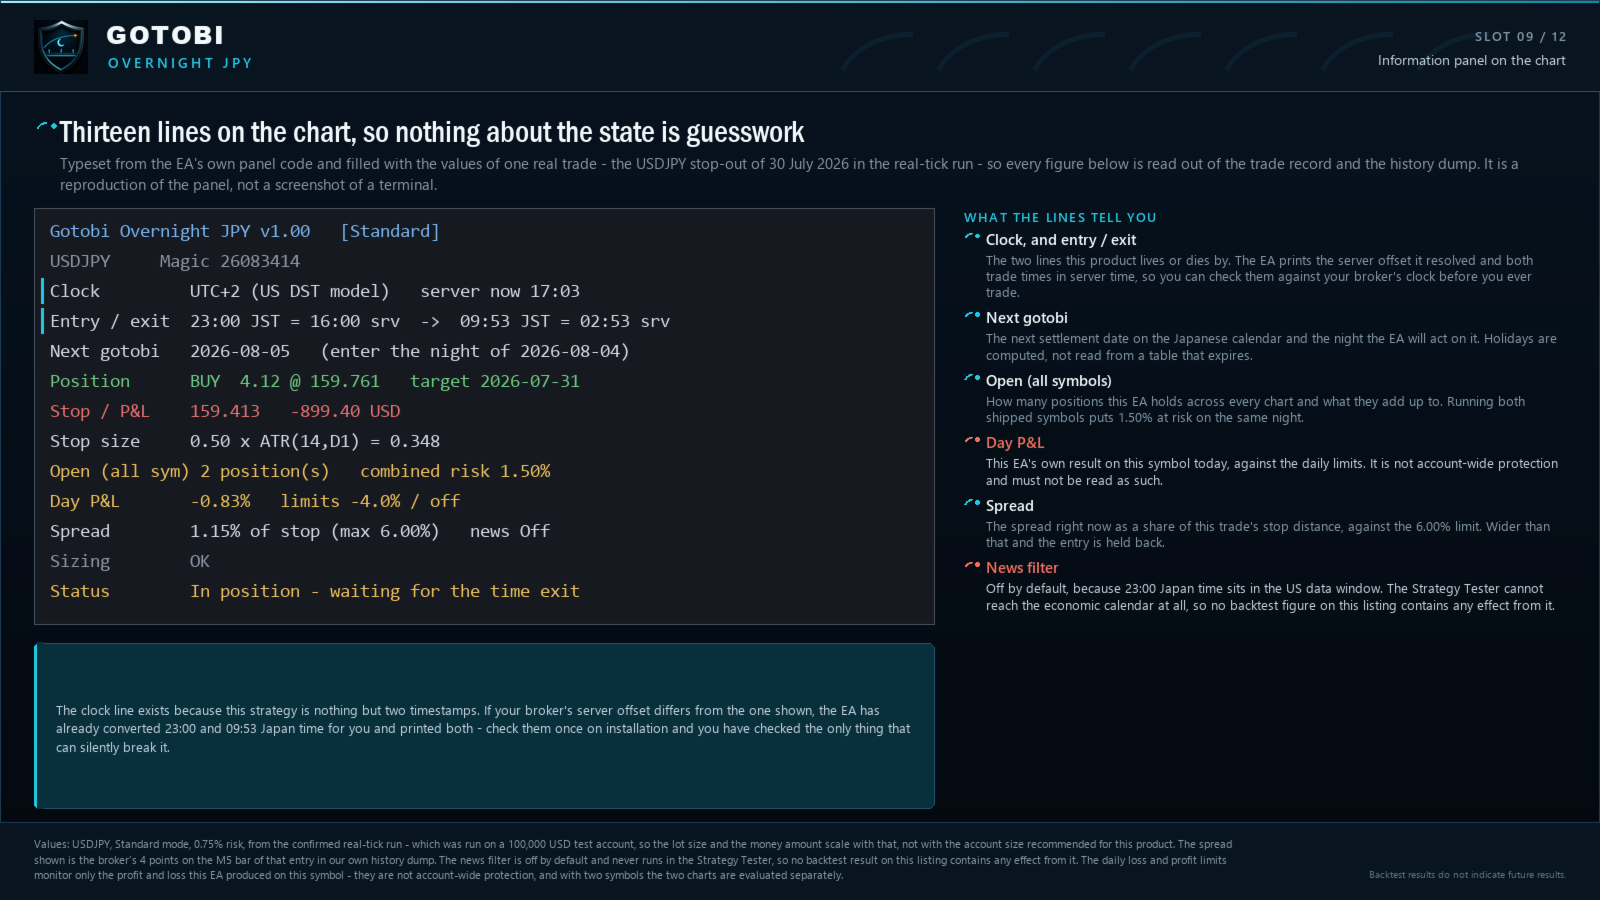
- 13-line panel: next gotobi date, resolved server times, tonight's total risk,
and the reason for every declined signal, including an account too small to
size the trade (screenshot 9)
- News filter, off by default: 23:00 Japan time is 14:00 UTC, inside the US data
window, and the Strategy Tester cannot reach the MT5 economic calendar. The
research used no filter, so no figure here includes any effect from it
== BEFORE YOU BUY ==
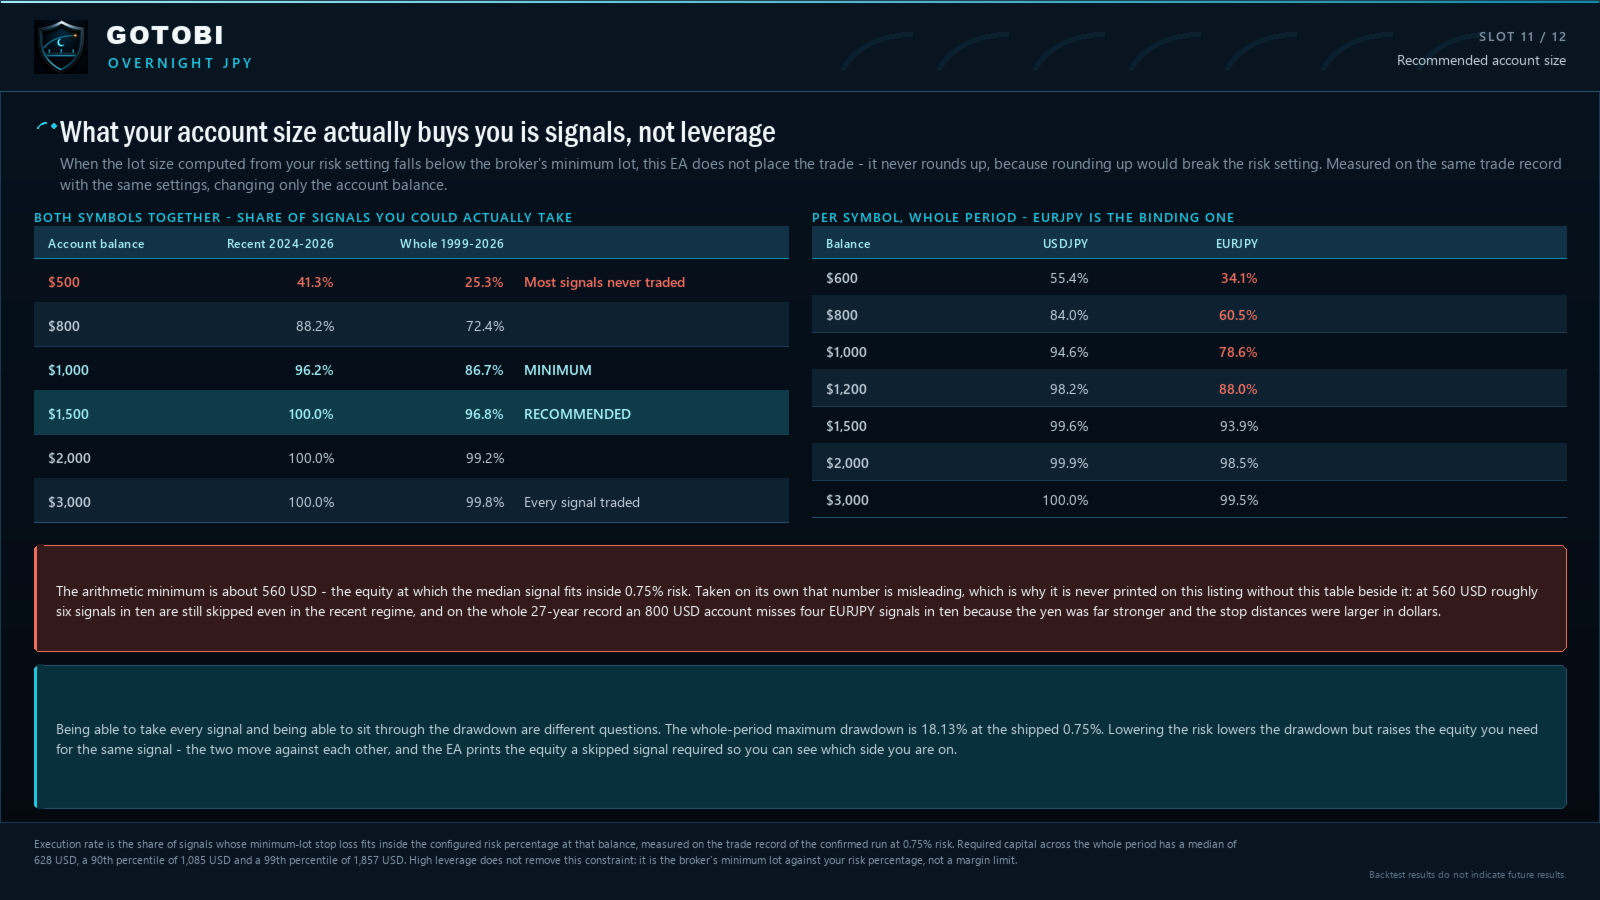
Recommended account 1,500 USD, minimum 1,000 USD - not for margin, but because
the EA skips a signal rather than exceed your risk setting, so a small account
quietly trades less.
500 USD: 41% of signals taken 800 USD: 88%
1,000 USD: 96% 1,500 USD: 100%
2024-2026 conditions; over the whole 27 years the same accounts take 25%, 72%,
87% and 97% (screenshot 11). The arithmetic minimum is 560 USD and we will not
print that number without this table - at that level you miss about 59% of the
signals, which is what happened to undersized accounts on our first product.
MetaTrader 5, a broker quoting USDJPY and EURJPY, continuous uptime; both symbols
are recommendations, not restrictions. Run one chart per symbol - this is not a
single-chart multi-symbol EA. Live, the EA resolves Japan time through
GMT; the Strategy Tester has no GMT, so it falls back to a daylight-saving model,
by default winter GMT+2 on US rules - on GMT+3 or EU rules your backtest differs
until you correct two inputs. Resolved entry and exit times are printed in the
startup log and on the panel: check them against your broker's clock, because an
hour of error is a materially different strategy.
Reproducing our backtest: avoid Wednesday. MetaTrader applies the swap rate live
at that moment to all 27 years and Wednesday rollover is triple - the same EA and
period measured PF 1.36 one day, 1.58 on a Wednesday afternoon.
We run this EA on our own live account. There is no published track record yet,
no MQL5 signal and no reviews: every number on this page is backtest data.
== WEAKNESSES ==
Two and a half trades a week, an average win barely larger than an average loss,
six losing years out of 28, and a decade at the start of the record that lost
money. The strategy rests on a settlement custom and a bank calendar continuing
to behave as they have. Not for you if you want daily activity, fast gains, or
would switch the EA off during a flat year. The seven-pair table, the rolling
windows and every stated limit ship in the user guide and risk disclosure -
nothing is hidden, it just does not fit here.
== RISK DISCLOSURE ==
Trading leveraged instruments carries a substantial risk of loss. Past results do
not indicate future results.
What the tested history already contains, at 0.75% risk: a maximum equity
drawdown of 18.1%, 11 losing trades in a row, 2,593 days between one equity high
and the next starting on day one, a worst calendar year of -11.7%, and a ten-year
stretch that ended below where it started. A future run can be worse. Use money
you can afford to lose, and read the risk disclosure document included with the
EA before you switch it on.
== WHAT YOU GET ==
The EA needs nothing extra: the recommended settings ship inside it as mode
presets (Standard 0.75% / Conservative 0.45%) - pick a mode and it runs. The
user guide, risk disclosure and optional .set files are attached in the
Comments tab, downloadable at any time. Questions before buying: Comments tab.
Version changes are logged in What's New.
== PRICE ==
The launch price is the lowest this EA will ever sell for. It rises one step
for every ten copies sold and stops permanently at 249 USD - a ceiling, not a
target, checkable in public on a page that keeps our history. Buying early
costs less and gets the same product. Updates are free whatever you paid.