OFX Heatmap
- 指标
-
Malik Muhammad Naveed
 ========================================================
ABOUT THE SELLER / AUTHOR (for MQL5 profile & products)
========================================================
----------------------------------------
SHORT VERSION (profile "About me" / signature) - 版本: 1.10
========================================================
OFX HEATMAP — MQL5 MARKET PRODUCT DESCRIPTION
(formatting notes: **bold** = editor Bold button;
lines starting with "•" = bullet-list button;
UPPERCASE lines = section headings)
========================================================
SHORT TITLE (product name field):
OFX Heatmap — Volume-at-Price Heatmap + POC for XAUUSD (Gold)
-------------------------------------------------------
OVERVIEW
-------------------------------------------------------
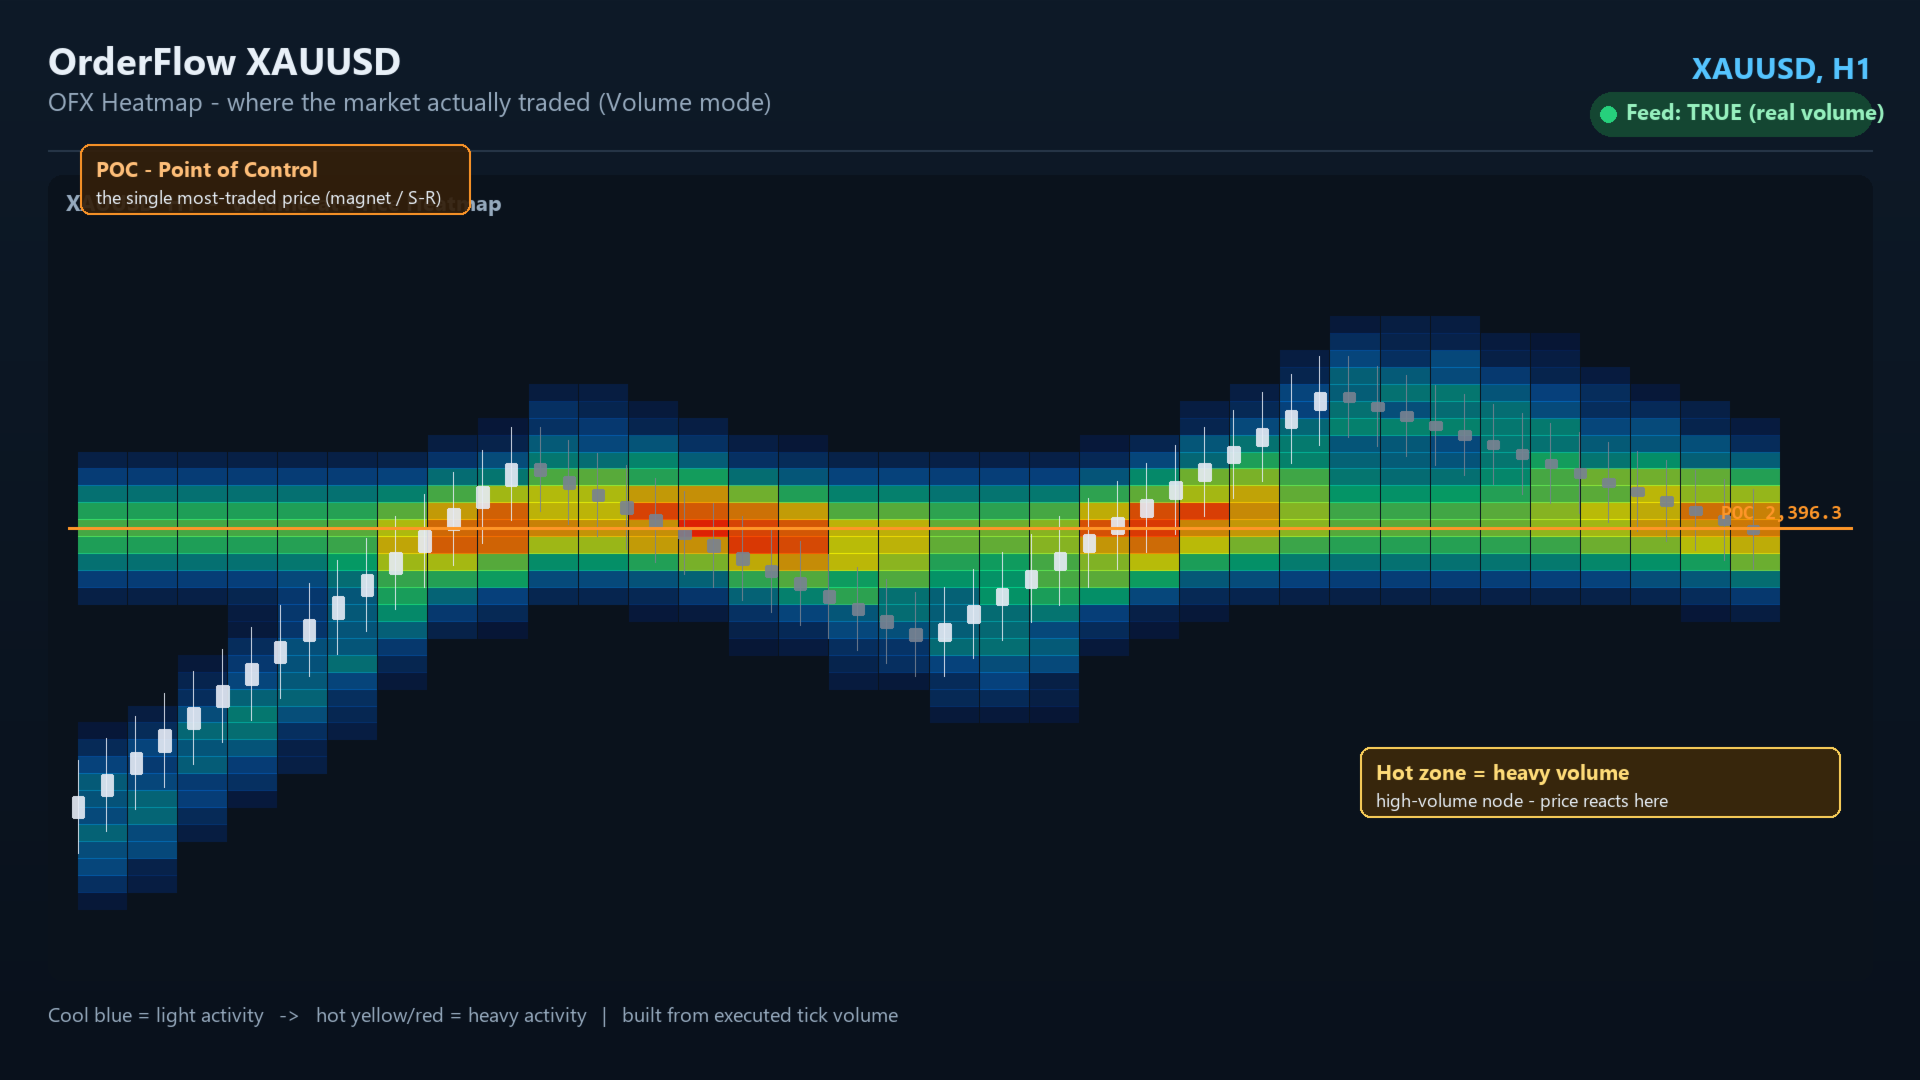
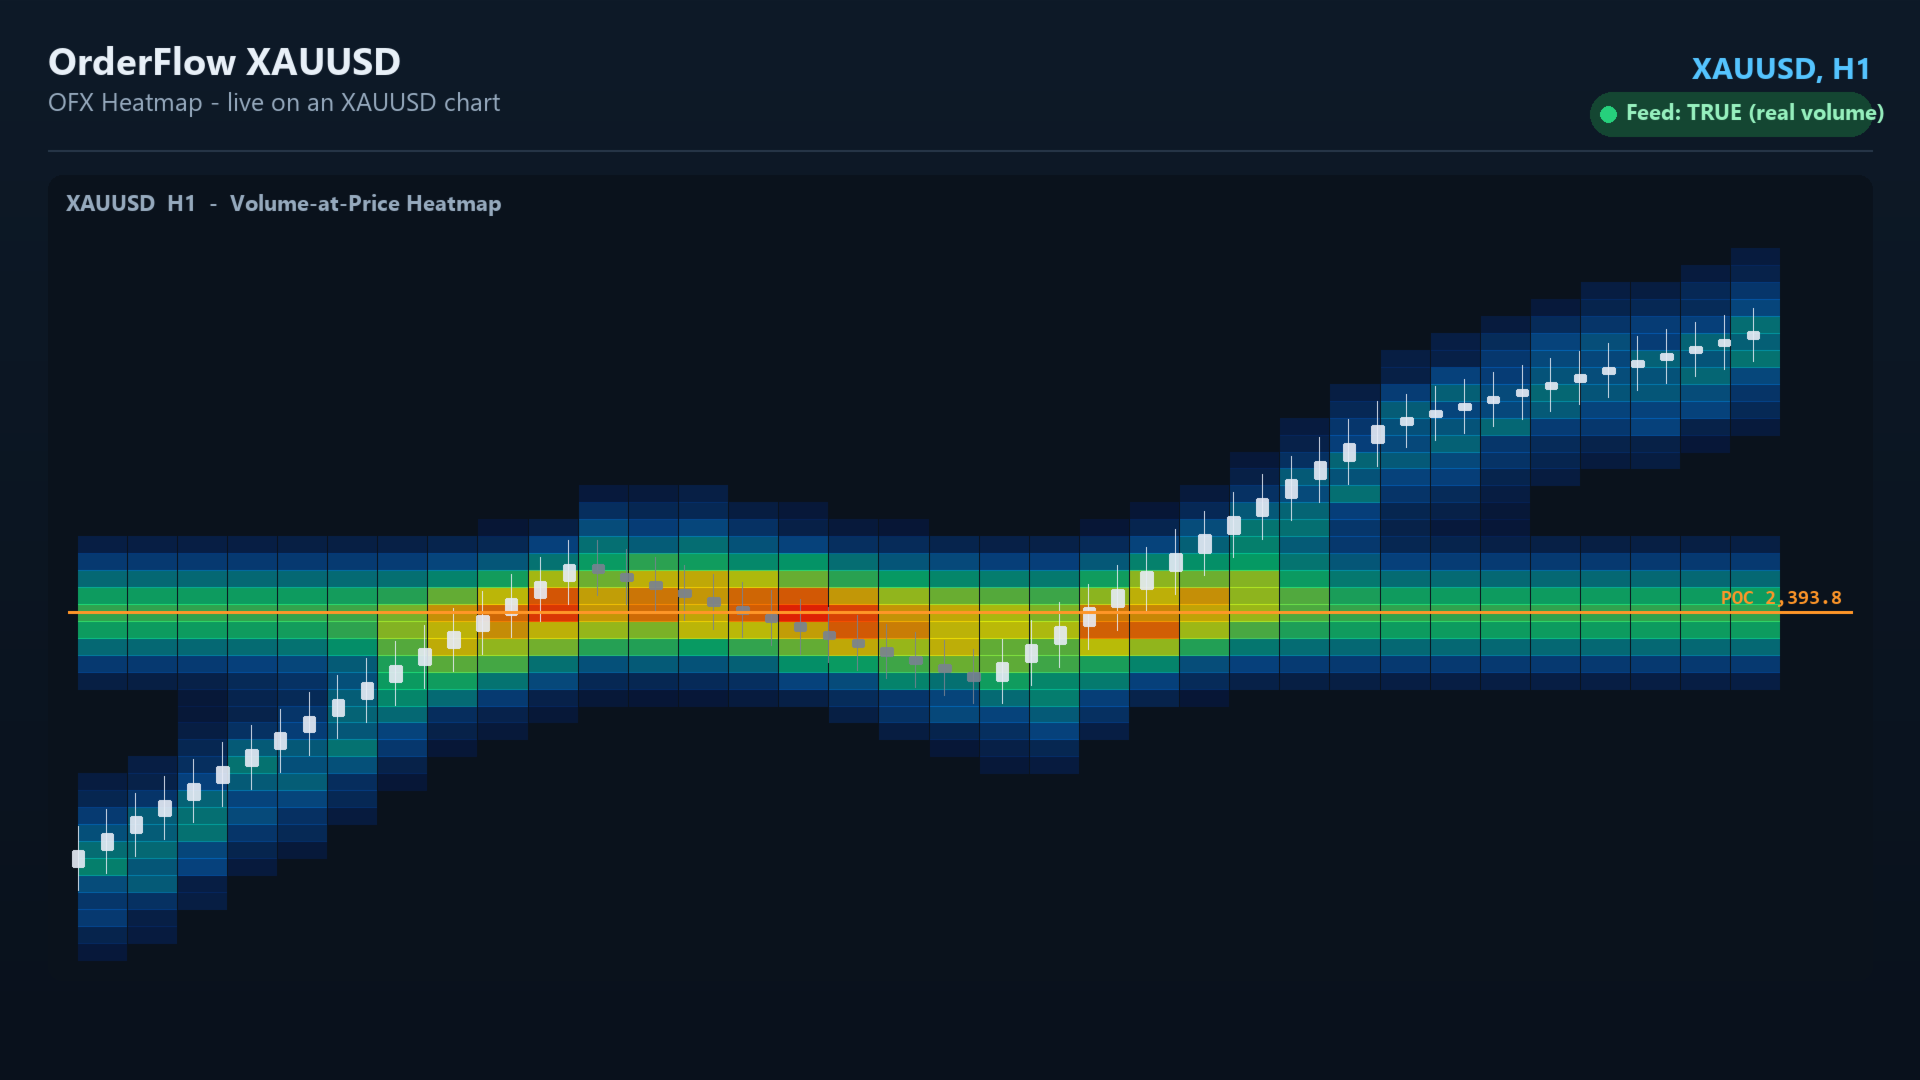
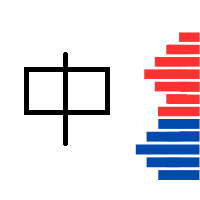
**OFX Heatmap** paints a Bookmap-style **volume-at-price** map directly on your
chart, so you can see exactly **where the market actually traded** — the price
bands that attracted the most activity, and the **Point of Control (POC)**, the
single most-traded price.
It is built **honestly** from executed tick volume (not fabricated order-book
liquidity), and is purpose-built for **XAUUSD (Gold)**, recommended on **H1**.
-------------------------------------------------------
WHAT IT DOES
-------------------------------------------------------
• **Volume-at-price grid** — the chart is divided into time columns and price rows;
each cell is colored by how much volume traded in that price band and time slice.
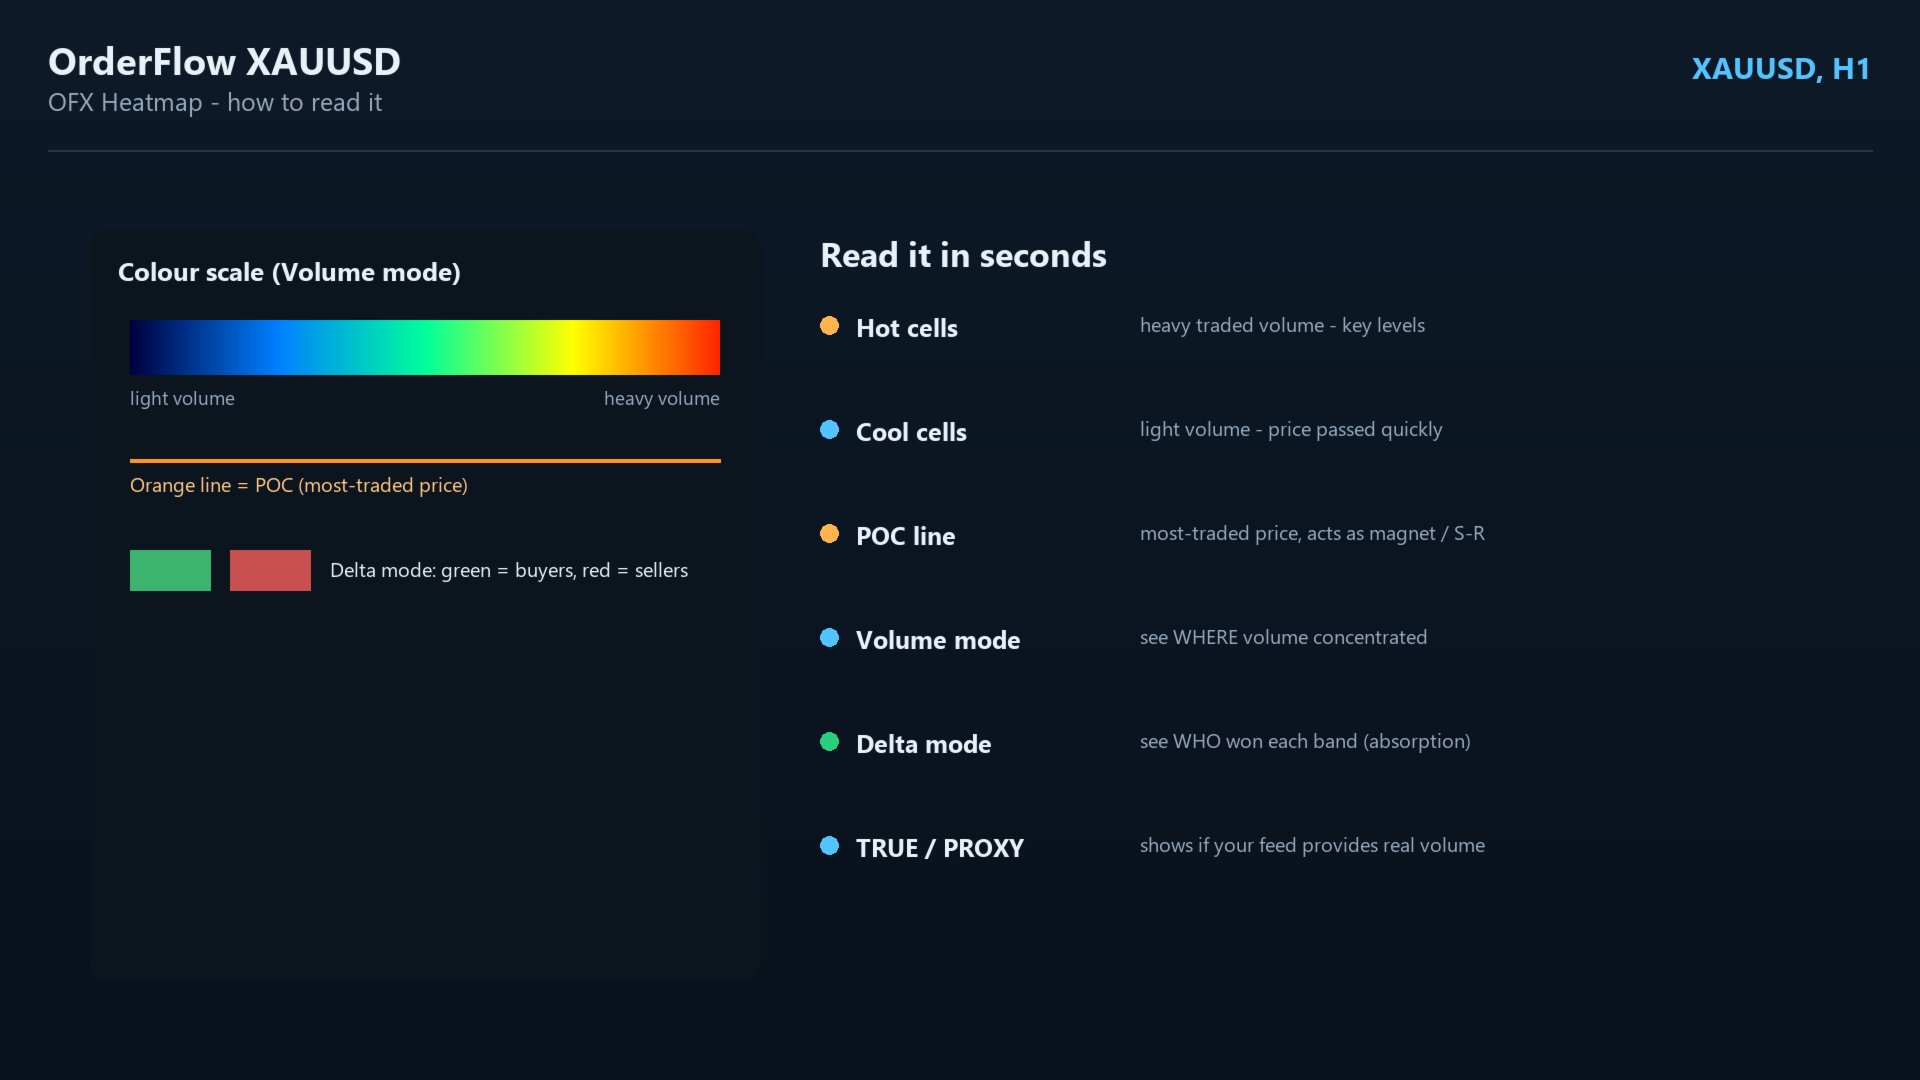
• **Thermal colouring** (Volume mode) — cool blue/cyan = light activity, hot
yellow/red = heavy activity, so high-volume zones jump out instantly.
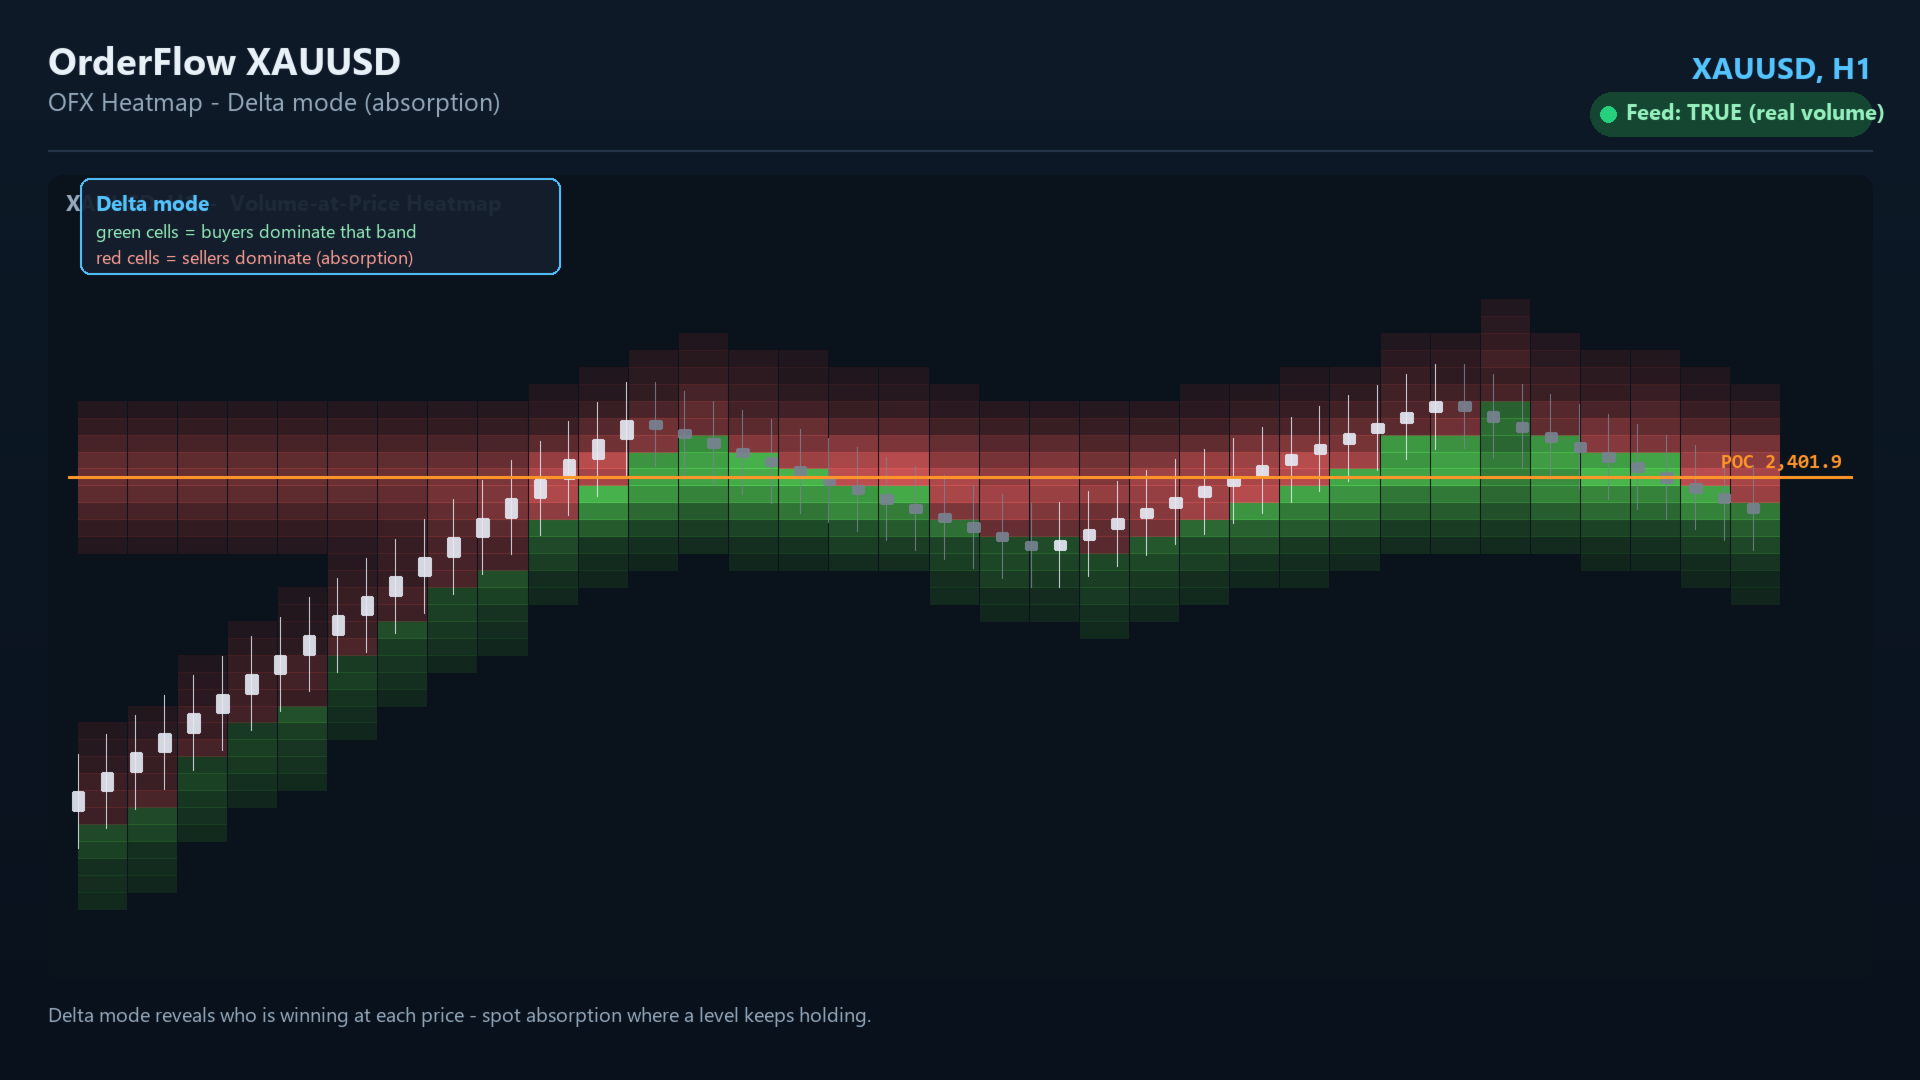
• **Delta mode** — colour cells by buy/sell dominance (green = buyers, red =
sellers) to reveal **absorption** at a level.
• **Point of Control (POC)** — an orange line marks the single most-traded price:
a natural magnet and support/resistance level.
• **Sparse & fast** — only meaningful cells (above a % of the peak) are drawn, so
the chart stays responsive.
• **Honest by design** — a feed-quality badge is stamped **TRUE** (real volume) or
**PROXY** (feed-limited).
-------------------------------------------------------
KEY ADVANTAGES
-------------------------------------------------------
• **See real support/resistance** — high-volume nodes and the POC are where price
reacts, not arbitrary lines.
• **Two views in one tool** — Volume heat OR buy/sell delta (absorption).
• **Bookmap-style, honestly built** — from executed volume, no fabricated liquidity.
• **Built for gold** — tuned for XAUUSD, recommended on H1 (runs on other symbols).
• **Performance-aware** — sparse drawing keeps charts light.
• **Fits a bigger system** — see below.
-------------------------------------------------------
PART OF THE OFX ORDERFLOW SUITE — ALL ENGINES WORK TOGETHER
-------------------------------------------------------
OFX Heatmap is **one engine in the OrderFlow (OFX) suite** — a set of indicators
built as **one connected system, not separate tools.** Each engine reads a
different, independent side of the same gold market, and they are designed to agree:
• **OFX Delta** + **OFX CVD** — raw order-flow (delta and cumulative delta)
• **OFX MoneyFlow** — money-flow pressure (CMF / MFI style)
• **OFX ICT** and **OFX KillZones** — higher-timeframe bias, FVG and session timing
• **OFX Heatmap** (this product) — where liquidity/volume is resting across levels
• **OFX Book** — live order-book / DOM imbalance
• **OFX Dashboard** — the cockpit that reads all the engines in one panel
When several independent engines line up in the **same direction**, the read is far
stronger than any single tool. **OFX Heatmap adds the price-map dimension** — the
key volume levels and POC where the other engines' signals are most likely to
react. Use it on its own, or add the rest of the suite for multi-engine confluence.
-------------------------------------------------------
REQUIREMENTS
-------------------------------------------------------
• Symbol: **XAUUSD (Gold)** recommended (runs on other symbols too)
• Recommended timeframe: **H1**
• Best with a broker feed that provides **real tick volume**; otherwise it labels
the read PROXY and says so.
• MetaTrader 5.
-------------------------------------------------------
HOW TO USE
-------------------------------------------------------
1. Attach OFX Heatmap to an **XAUUSD H1** chart.
2. Watch the hot (yellow/red) zones and the orange **POC** — these are the levels
price respects.
3. Switch to **Delta mode** to see absorption (green vs red) at a level, and confirm
with the rest of the OFX suite for higher-conviction entries.
-------------------------------------------------------
INPUTS / PARAMETERS
-------------------------------------------------------
• **InpCols** — number of time columns in the grid (default: 60)
• **InpBarsPerCol** — bars per column; total lookback = Cols x this (default: 3)
• **InpRows** — number of price rows in the grid (default: 60)
• **InpMode** — colour by total Volume (thermal) or buy/sell Delta (default: Volume)
• **InpMinPct** — draw only cells >= this fraction of the peak volume (default: 0.04)
• **InpPadPct** — extra padding added to the price range (default: 0.02)
• **InpShowPOC** — draw the Point-of-Control line (default: true)
• **InpPOCColor** — colour of the POC line (default: Orange)
• **InpPrefix** — object-name prefix for the drawn cells (default: OFXHM_)
-------------------------------------------------------
NOTE ON DATA HONESTY
-------------------------------------------------------
OFX only shows metrics your broker's feed can actually support. The heatmap is built
from executed tick volume; where real volume isn't available it labels the read
**PROXY** instead of inventing numbers. This is by design.