Ichimoku Multi Timeframe Dashboard
- 指标
-
Hacene Harrous
 我为 MetaTrader 5 开发简洁而实用的指标。我专注于多周期面板:它们把一个指标(RSI、趋势、MACD、ADX、随机指标、CCI 或完整的一目均衡表系统)在多个时间周期上一眼呈现,让你不必再切换图表。每个工具都很轻量,警报绝不重绘,而且全部免费。如果某个工具对你的交易有帮助,一条简短的评价就是对作品最好的支持。
 - 版本: 1.1
- 更新: 27 八月 2026
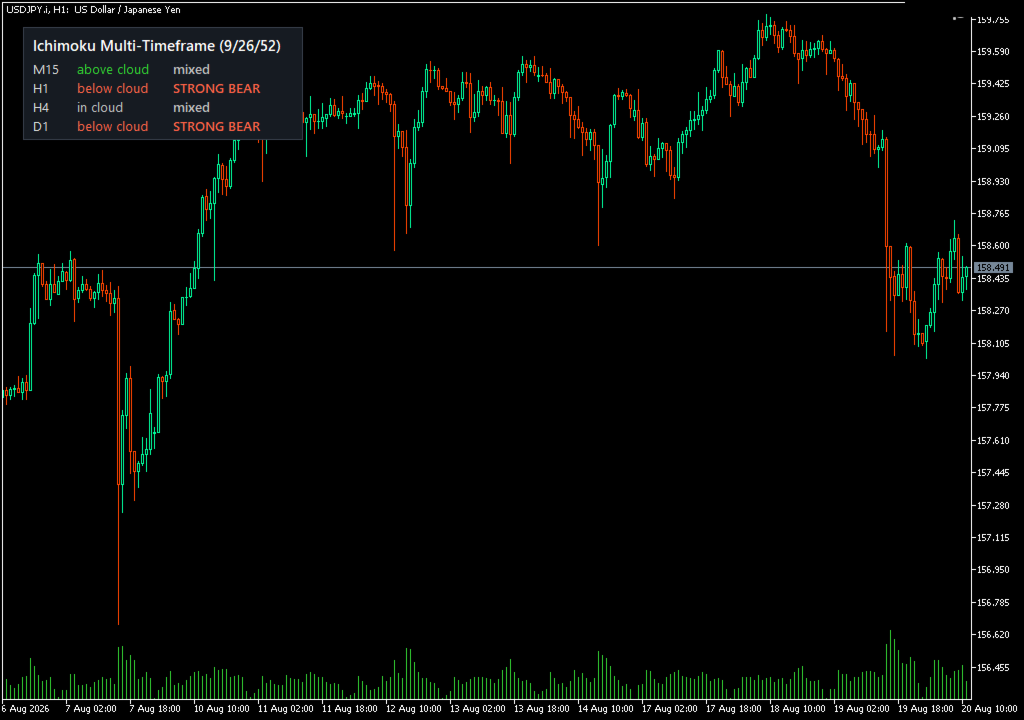
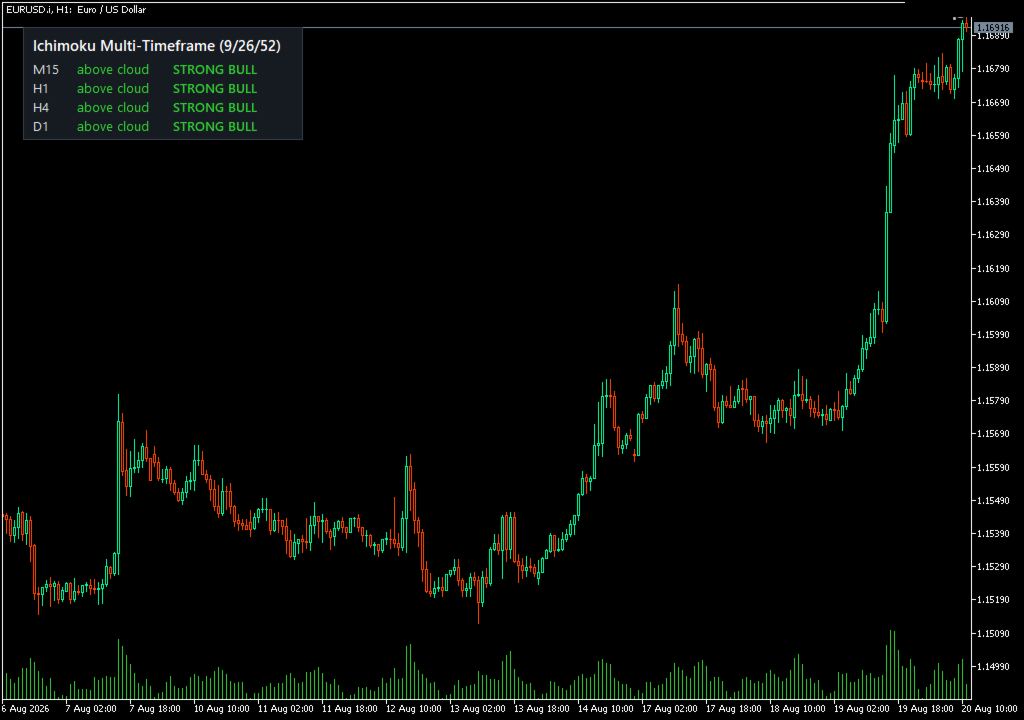
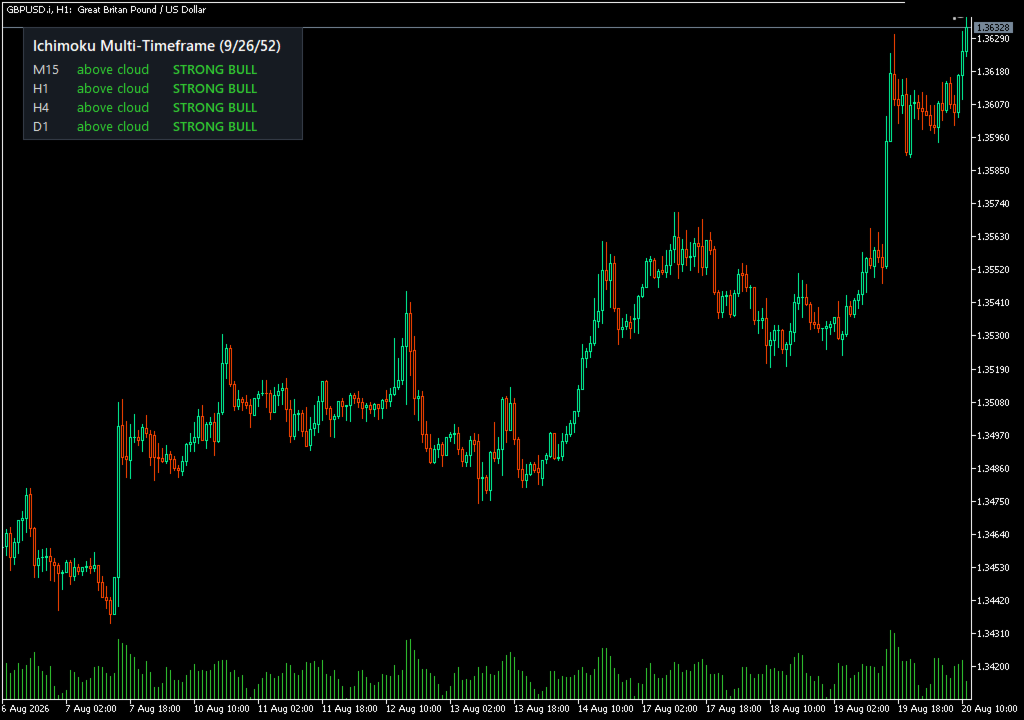
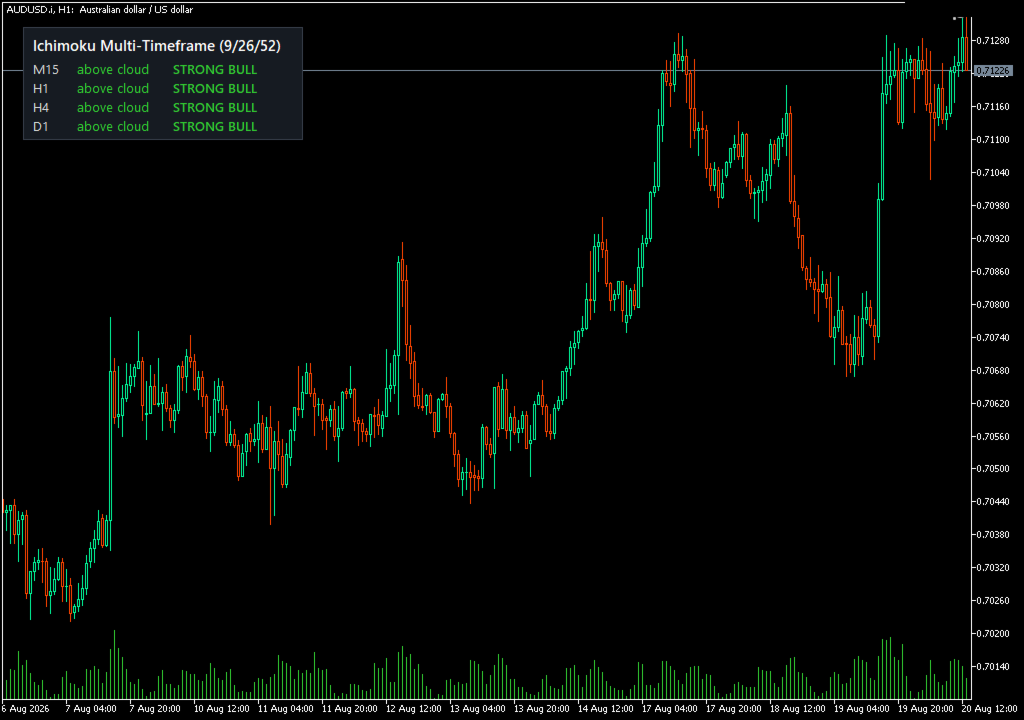
Ichimoku MTF Dashboard reads the full Ichimoku Kinko Hyo system across four timeframes at once and turns it into a single clear state for each of them. Instead of crowding every chart with five overlapping lines, it answers the question that actually matters at a glance. On M15, H1, H4 and D1, is price above, inside or below the cloud, and is the balance tilting bullish or bearish.
For each timeframe the panel combines four honest Ichimoku readings. It looks at the position of price relative to the Kumo, at the relationship between the Tenkan and the Kijun, at the color of the forward cloud built from the two leading spans, and at the Chikou span compared with past price. These four readings are summed into one synthesized state that runs from strong bear to strong bull, so alignment or conflict between timeframes becomes obvious in a moment.
The panel is fully movable. You can anchor it to any of the four corners or drag it anywhere with the mouse, and it remembers where you left it. It stays inside the chart, so it cannot be lost off screen. It refreshes once per second, which keeps it smooth and light on the processor, and it can alert you on a closed bar when a timeframe changes its overall state. Because the alert is built on the closed bar, it fires once per real change and never repaints.
The Ichimoku periods are configurable, with the standard values of nine, twenty six and fifty two set as defaults. The four timeframes, the colors and the font size are all adjustable. The indicator computes Ichimoku directly from price, works on any symbol and any timeframe, and adds nothing to your chart beyond its own compact panel.
This dashboard is part of a family of multi timeframe tools on my profile, and it is offered free. A rating and a short review are greatly appreciated.
IF YOU WANT THE DECISION ON TOP OF THE READING
This dashboard tells you what the four timeframes are doing. Ichimoku Multi Timeframe PRO tells you when that picture changed. You choose how many timeframes must agree, from one to four, and the panel states the verdict with the exact count, for example buy with three timeframes out of four. When that verdict flips, an arrow is drawn on the chart. The last four hundred bars are replayed when the indicator loads, so you can judge the behaviour on your own instrument before you rely on it, and the two arrow buffers are exposed so a robot can read the signal through iCustom. Everything is computed on closed bars, so nothing repaints. You can find it here: https://www.mql5.com/en/market/product/192636