New York Session Trader
- 指标
- 版本: 3.10
- 激活: 20

The New York Session Trader: Your Complete Guide to the AMD Power Scanner
Introduction: The Dawn of a New Trading Era
Imagine waking up each morning knowing that you have a tireless assistant that has been working around the clock, analyzing every currency pair, every timeframe, and every potential setup - all while you slept. This isn't science fiction. This is the reality of the New York Session Trader, a revolutionary indicator and scanner system that has transformed the way traders approach the most volatile and profitable trading session of the day.
The AMD Power Scanner, as it's technically known, represents the culmination of years of trading experience, countless hours of backtesting, and a deep understanding of institutional market mechanics. It's not just another indicator that paints pretty lines on your chart. It's a complete trading ecosystem designed to identify high-probability setups during the New York session, the time when the world's largest financial institutions, hedge funds, and central banks conduct their most significant market operations.
What makes this system truly special is its comprehensive approach to market analysis. It doesn't just look at price action. It considers market structure, session dynamics, institutional order flow, news catalysts, and even daily bias to provide a holistic view of the market landscape. It's the trading equivalent of having a Wall Street veteran sitting beside you, whispering in your ear exactly when and where to enter trades.
The Architecture of Success: How the Scanner Works
At its core, the New York Session Trader is built on a sophisticated algorithmic framework that processes massive amounts of market data in real-time. Every thirty seconds, the scanner wakes up, takes a deep breath of market data, and begins its analysis. It examines up to 25 different currency pairs, each across multiple timeframes, looking for specific patterns that have historically preceded powerful moves.
The system uses what traders call a "gated scanning approach." This means it only operates during the New York session, the period when liquidity is at its highest and market movements are most likely to follow technical patterns. This gating mechanism is crucial because it prevents false signals during lower-liquidity sessions when price action can be erratic and unpredictable.
The scanner's analysis is based on a proprietary multi-case methodology that identifies specific market structures. It looks for what traders call "accumulation" and "manipulation" patterns in the Asian and London sessions, then uses those patterns to predict potential New York session moves. This is based on the observation that institutional traders often use these earlier sessions to build positions and test key levels before making their real moves during the New York session.
When the scanner identifies a setup, it doesn't just give you a vague signal. It provides a complete trade package including entry price, stop-loss level, take-profit target, and the specific logic behind why the setup was identified. This level of detail is unprecedented in retail trading tools and allows traders to understand not just what to do, but why they should do it.
The Daily Ritual: Maximizing Your Scanner's Potential
The Morning Preparation
Your trading day should begin with a simple but crucial ritual. As you approach your trading desk, before even looking at price charts, open your MetaTrader 5 platform and ensure the New York Session Trader is loaded. This is your most important asset for the day ahead.
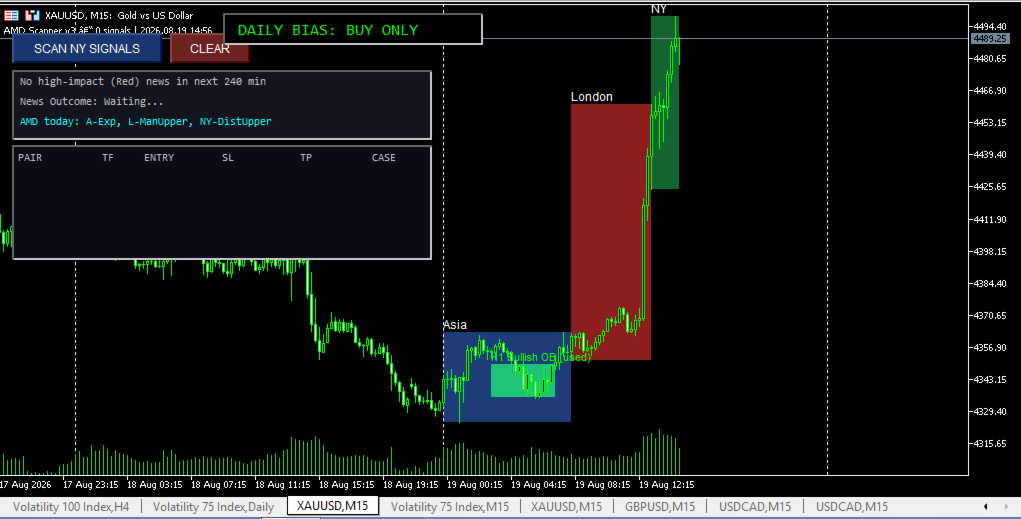
The first thing you'll notice on your chart is the Daily Bias panel at the top of your screen. This panel, which you've positioned centrally, provides you with the market's directional bias based on daily timeframe analysis. It uses a combination of exponential moving averages, relative strength index readings, and ADX directional movement to determine whether the market is favoring buyers or sellers. This isn't just another indicator to ignore. This is your North Star for the day. If the bias says "BUY ONLY," you should be extremely hesitant to take short positions regardless of what your intuition might tell you.
Beneath the bias panel, you'll find the news section. This displays upcoming high-impact news events that could affect the currencies in your watchlist. The scanner automatically checks the economic calendar, identifies red-folder events, and displays them prominently. This feature is absolutely critical because it prevents you from getting caught in the chaos of major news releases without proper preparation.
The AMD Classification: Your Market Roadmap
One of the most innovative features of this system is its AMD classification label. AMD stands for Accumulation, Manipulation, and Distribution - three phases of institutional market activity that professional traders use to position themselves. The scanner analyzes the Asian and London sessions to determine which phase the market is currently in.
The Asian session is typically the accumulation phase. During this time, institutions build their positions without moving price significantly. The scanner measures whether Asia was accumulating or expanding. A tight Asian range, typically less than 90 pips, suggests accumulation. A wide range suggests distribution or expansion.
The London session is often the manipulation phase. This is when institutions test key levels and try to shake out weak hands. The scanner identifies whether London manipulated above or below the Asian range, or whether it continued in the same direction. This information is crucial for understanding the market's intent going into the New York session.
The New York session is typically the distribution phase. This is when institutional traders take profits and unwind their positions. The scanner's AMD label tells you exactly what happened in each session and how the current session is developing.
The Mid-Morning Check
As the New York session gets underway, typically around 13:00 broker time, the scanner becomes fully operational. The scan button on your chart transforms from grayed-out and unresponsive to a vibrant blue, inviting you to begin your analysis.
This is when you should run your first scan of the day. The scanner will examine all available currency pairs and present you with a dashboard of potential setups. Each row in the dashboard represents a complete trade opportunity complete with entry, stop-loss, and take-profit levels.
As you review these signals, you should begin with the Daily Bias panel. This panel has already told you whether the market is favoring long or short positions. If the bias says "SELL ONLY" and the dashboard shows bullish signals, you should be extremely cautious. The bias panel represents institutional sentiment on the daily timeframe, and fighting that sentiment is rarely profitable.
The news panel should also inform your decisions. If high-impact news is approaching, consider waiting until the news has been released before entering new positions. The market often experiences increased volatility and unpredictable price movements around major economic announcements.
The Psychology of Patience: What NOT to Do While Waiting
One of the most challenging aspects of trading is the waiting. The market doesn't move in straight lines, and there are extended periods where no clear setups present themselves. This is when traders often make their biggest mistakes.
Don't Overtrade
The most common mistake traders make is forcing trades when the scanner isn't producing signals. Just because you're sitting at your desk doesn't mean you need to be in a trade. The New York Session Trader is designed to identify the highest-probability setups. If there are no signals on the dashboard, it means the market conditions aren't favorable for your strategy. Forcing trades in these conditions is like trying to force a square peg into a round hole - it doesn't work and it damages both the peg and the hole.
Instead, use this waiting time to review your trading plan, check your risk management rules, and study the market structure. The scanner's AMD labels provide perfect material for this analysis. Watch how the current session develops compared to the Asian and London sessions. This is valuable learning that will improve your trading even without executing trades.
Don't Chase Price
Another common pitfall is chasing price when a signal is missed. Perhaps you saw a setup on the dashboard but hesitated, and now the price has moved significantly. The temptation to chase the entry is powerful, but it's almost always a mistake. The scanner identified that setup based on a specific entry price and risk-reward ratio. Chasing price means entering at a worse price, which reduces your potential reward and increases your risk.
Remember, the scanner is running continuously. If you missed one setup, there will be others. Patience is not just a virtue in trading - it's a requirement. The market rewards patience with better entry prices and higher probability setups.
Don't Ignore the Session Boxes
The scanner draws transparent boxes around the Asian, London, and New York session ranges. These boxes are not decoration. They represent key support and resistance levels determined by institutional trading activity. Ignoring these levels is a mistake many traders make.
The session boxes act as invisible barriers that often contain price movement. If price is approaching the top of the London box, and you're considering a long position, you should be aware that the London high is likely to act as resistance. The scanner's algorithms have already considered these levels when generating signals, but you should also be mindful of them when managing trades.
The Risk Management Ecosystem
The New York Session Trader doesn't just identify potential trades. It also provides the risk management framework for executing those trades.
The Stop-Loss Placement
Each signal includes a specific stop-loss level. These stops are not random numbers. They are placed at key technical levels where the trade's underlying logic would be invalidated. For example, a bearish signal based on London manipulation above the Asian range might have its stop-loss placed just above the London high. This means if the market rallies above that level, the manipulation thesis has been invalidated, and it's time to exit.
The Take-Profit Calculation
The take-profit levels are based on the risk-reward ratio you've configured. By default, the scanner uses a 2:1 risk-reward ratio. This means for every dollar you risk, you're aiming to make two dollars. This is a sustainable approach that allows you to be wrong more often than you're right and still remain profitable.
The Position Sizing Consideration
While the scanner doesn't automatically determine position size, it provides all the information you need to calculate it. The entry price tells you where to enter, the stop-loss tells you how much you're risking per unit, and the take-profit tells you your potential reward. Using standard position sizing formulas, you can determine exactly how many units to trade based on your account size and risk tolerance.
The Power of Multiple Timeframe Analysis
The New York Session Trader performs what professional traders call "top-down analysis." It looks at the daily timeframe for bias, the H1 timeframe for order blocks, and the session-specific analysis for entry timing.
Daily Bias: Your Market Compass
The daily bias calculation is performed using persistent indicator handles. The scanner creates these handles once and reuses them, ensuring that the bias calculation is fast and accurate. The bias is determined using three key metrics:
The EMA comparison tells you whether price is above or below the 20-period moving average on the daily chart. This is a basic trend indicator that quickly tells you whether the bulls or bears are in control.
The RSI reading indicates whether the market is overbought or oversold. An RSI above 50 suggests bullish momentum, while an RSI below 50 suggests bearish momentum. This adds conviction to the trend reading.
The ADX analysis measures trend strength. A strong ADX reading, combined with directional movement, suggests a strong trend that is likely to continue. The scanner gives extra weight to the ADX reading because strong trends are the most profitable trading conditions.
H1 Order Blocks: The Institutional Footprint
The scanner identifies H1 order blocks, which are areas where institutional orders are likely to be resting. These order blocks are drawn directly on your chart, providing visual clues about where the market might find support or resistance.
The order block detection is sophisticated. The scanner looks for consolidation patterns followed by breakout moves. When it identifies a consolidation, it calculates the consolidation range. If the subsequent breakout is strong, it marks the consolidation area as an order block. These order blocks often act as magnets for price, attracting the market back to these levels to fill unfilled orders.
The scanner also applies a mitigation check to order blocks. If price has already traded back into the order block area, it's considered "used" and is drawn with a dotted line instead of a solid line. This prevents you from placing too much importance on order blocks that may no longer be relevant.
Session Analysis: The Intraday Context
The session analysis provides the intraday context for your trades. The Asian session establishes the initial range. The London session manipulates that range. The New York session distributes positions established earlier.
Understanding this flow helps you interpret the signals. A signal that says "C1-Dist-Down" means the market is distributing positions downward. This is a short signal. A signal that says "C4-SweepRev-Up" means the market swept a key level and reversed upward. This is a long signal.
Real-World Trading Scenarios
Let's walk through how a trader might use this system on a typical trading day.
It's 13:30 broker time, and the New York session has just begun. You've been watching the scanner's AMD label, which shows the Asian session was accumulation, the London session manipulated lower, and the New York session is starting to break upward. This suggests a potential upward move.
You run the scan. The dashboard shows three signals on different currency pairs. One signal has the logic "C2-Cont-Up," indicating it's a continuation signal following London manipulation lower. This aligns with the AMD label showing the same pattern.
You check the daily bias panel. It says "DAILY BIAS: BUY ONLY." This confirms that the daily trend is bullish. The signals on the dashboard are all bullish, which matches the daily bias. Everything is aligned.
You check the news panel. It says "No high-impact news in next 240 min." There are no economic releases that could disrupt your trade. The market should move based on technical factors.
You review the specific signal. The entry is at 1.12500, the stop-loss is at 1.12200, and the take-profit is at 1.13100. This is a 30-pip risk for a 60-pip reward. A 2:1 risk-reward ratio.
You calculate your position size. If you're comfortable risking 1% of your account on this trade, and your stop-loss is 30 pips, you would trade 3.33 micro lots per $1,000 in your account. You place your trade accordingly.
You set your stop-loss and take-profit orders with your broker. The scanner has already drawn the entry line, stop-loss box, and take-profit box on your chart. These visual references help you manage your trade without having to constantly check your positions.
You sit back and watch. The market moves in your favor, but it's a choppy ride. The daily bias panel reassures you that the trend is still bullish. The session boxes show that price is respecting key levels. You hold your position through the dips, trusting the system.
The market reaches your take-profit level. You exit the trade with a 2% gain on your account. The scanner has just earned you a substantial return.
Why This System Is Essential for Every Trader
The Time-Saving Factor
Professional traders spend hours each day analyzing charts. They look at multiple timeframes, calculate support and resistance levels, check economic calendars, and analyze market structure. The New York Session Trader does all of this automatically, in seconds.
Consider the time investment required for manual analysis. A professional trader might spend two hours analyzing markets before the New York session opens. The scanner performs this same analysis continuously, presenting the results in a simple, easy-to-understand dashboard. The time saved can be redirected to other aspects of your trading, such as journaling, reviewing past trades, or refining your strategy.
The Consistency Factor
One of the biggest challenges in trading is maintaining consistency in your analysis. Human traders are subject to emotions, biases, and fatigue. The scanner has none of these limitations. It applies the same rigorous analysis to every symbol at every scan. It doesn't get tired. It doesn't get emotional. It simply executes its algorithms and presents the results.
This consistency is crucial for developing a profitable trading routine. When you know that the scanner will apply the same criteria to every pair, you can focus on executing the setups it identifies rather than worrying about whether you've correctly identified the setup yourself.
The Risk Management Factor
Perhaps the most valuable aspect of this system is its integrated risk management. Each signal comes with pre-calculated stop-loss and take-profit levels. These aren't random numbers placed at arbitrary distances from the entry. They're calculated based on market structure and technical analysis.
Having pre-calculated stops and targets removes the emotional element from trade management. You don't need to debate where to place your stop-loss or whether to move your take-profit. The scanner has already determined the optimal levels based on market conditions.
The Learning Factor
The New York Session Trader is more than just a tool for identifying trades. It's also an educational resource. By studying the signals it generates and the logic behind them, you can develop a deeper understanding of market structure and institutional trading dynamics.
Over time, you'll start to recognize the patterns the scanner uses. You'll understand why certain setups work and others don't. This knowledge is transferable. Even if you eventually move away from using automated scanners, the understanding you've gained will make you a better discretionary trader.
The Psychological Factor
Trading psychology is often the difference between success and failure in the markets. The scanner helps with the psychological aspects of trading in several ways:
First, it removes uncertainty. When you have a clear setup with defined entry, stop-loss, and take-profit levels, you can trade with confidence. The scanner provides this clarity for every signal it identifies.
Second, it helps you avoid overtrading. The scanner only identifies setups that meet its specific criteria. If there are no signals on the dashboard, it's a clear indication that market conditions aren't favorable. You can step away from your desk without feeling like you're missing opportunities.
Third, it builds trust. As you use the system and see it generate profitable signals day after day, you'll develop confidence in its ability to help you succeed. This confidence is essential for maintaining the discipline required to follow your trading plan.
The Technical Excellence: Under the Hood
The New York Session Trader is built on a foundation of technical excellence. Its code structure ensures reliability, efficiency, and accuracy.
Persistent Indicator Handles
One of the technical innovations in this system is its use of persistent indicator handles. Many scanners create new indicator handles every time they scan, which causes the indicators to warm up from scratch each time. This can lead to slow performance and inaccurate readings.
The New York Session Trader creates its indicator handles once, when the system is initialized, and reuses them for the life of the system. This ensures that the daily bias calculation is fast and accurate, with no warm-up period required.
Date-Filtered Analysis
The scanner uses date-filtered analysis for its session calculations. Instead of looking at the last 400 bars and grouping them by hour of day, it specifically filters for today's bars. This is a crucial distinction.
Without date filtering, the scanner would blend multiple days of data. A setup that looks clean on today's chart might not be identified because the range it's comparing against includes data from previous days. The date-filtered approach ensures the scanner's analysis matches what you see on your chart.
Efficient Object Management
The scanner is efficient with its use of chart objects. It creates objects once and updates them in place rather than deleting and recreating them. This eliminates flicker and improves performance. The daily bias panel, news panel, and AMD label are all updated in place, creating a smooth user experience.
Memory Management
The scanner cleans up after itself. When it's unloaded, it releases indicator handles and deletes chart objects. This prevents memory leaks and ensures your platform remains responsive even with multiple instances running.
The Big Picture: Transforming Your Trading
The New York Session Trader is more than just a scanning tool. It's a complete trading solution that addresses every aspect of the trading process.
It provides the analysis, identifying high-probability setups based on institutional market mechanics. It provides the execution framework, with clear entry, stop-loss, and take-profit levels. It provides the risk management, with pre-calculated position sizing information. It provides the educational component, helping you understand why certain setups work and others don't.
But perhaps most importantly, it provides the psychological support that every trader needs. The clarity and consistency it offers help you avoid the emotional pitfalls that plague so many traders. The confidence it builds helps you execute your trades with conviction.
The New York Session Trader is the tool that successful traders have been waiting for. It bridges the gap between retail and institutional trading, giving individual traders access to the same level of analysis used by professional trading desks. It's the edge that can transform your trading from a guessing game to a systematic, profitable endeavor.
Getting Started: Your First Day
When you first load the New York Session Trader, take some time to familiarize yourself with its components. The Daily Bias panel sits at the top of your chart, providing directional guidance. The news panel below it keeps you informed of upcoming economic events. The AMD label tells you what the market has been doing in each session.
The dashboard appears below these panels, ready to display your signals. The scan button, which remains grayed out until the New York session begins, is waiting for you to press it.
As you run your first scan, watch the dashboard populate with signals. Each row represents a potential trade. Review the logic column to understand the setup. Check the entry, stop-loss, and take-profit levels. Cross-reference with the daily bias and news panels. Make sure everything aligns before you execute.
With the New York Session Trader, you have the power to trade like a professional. The analysis, the risk management, the discipline - it's all built in. All that's left is for you to execute with confidence.
The markets have always been a game of information and execution. With this scanner, you have the information advantage. Now it's time to execute.