VWAP Deviation Indicator

VWAP 偏差指标(VWAP Deviation Indicator)

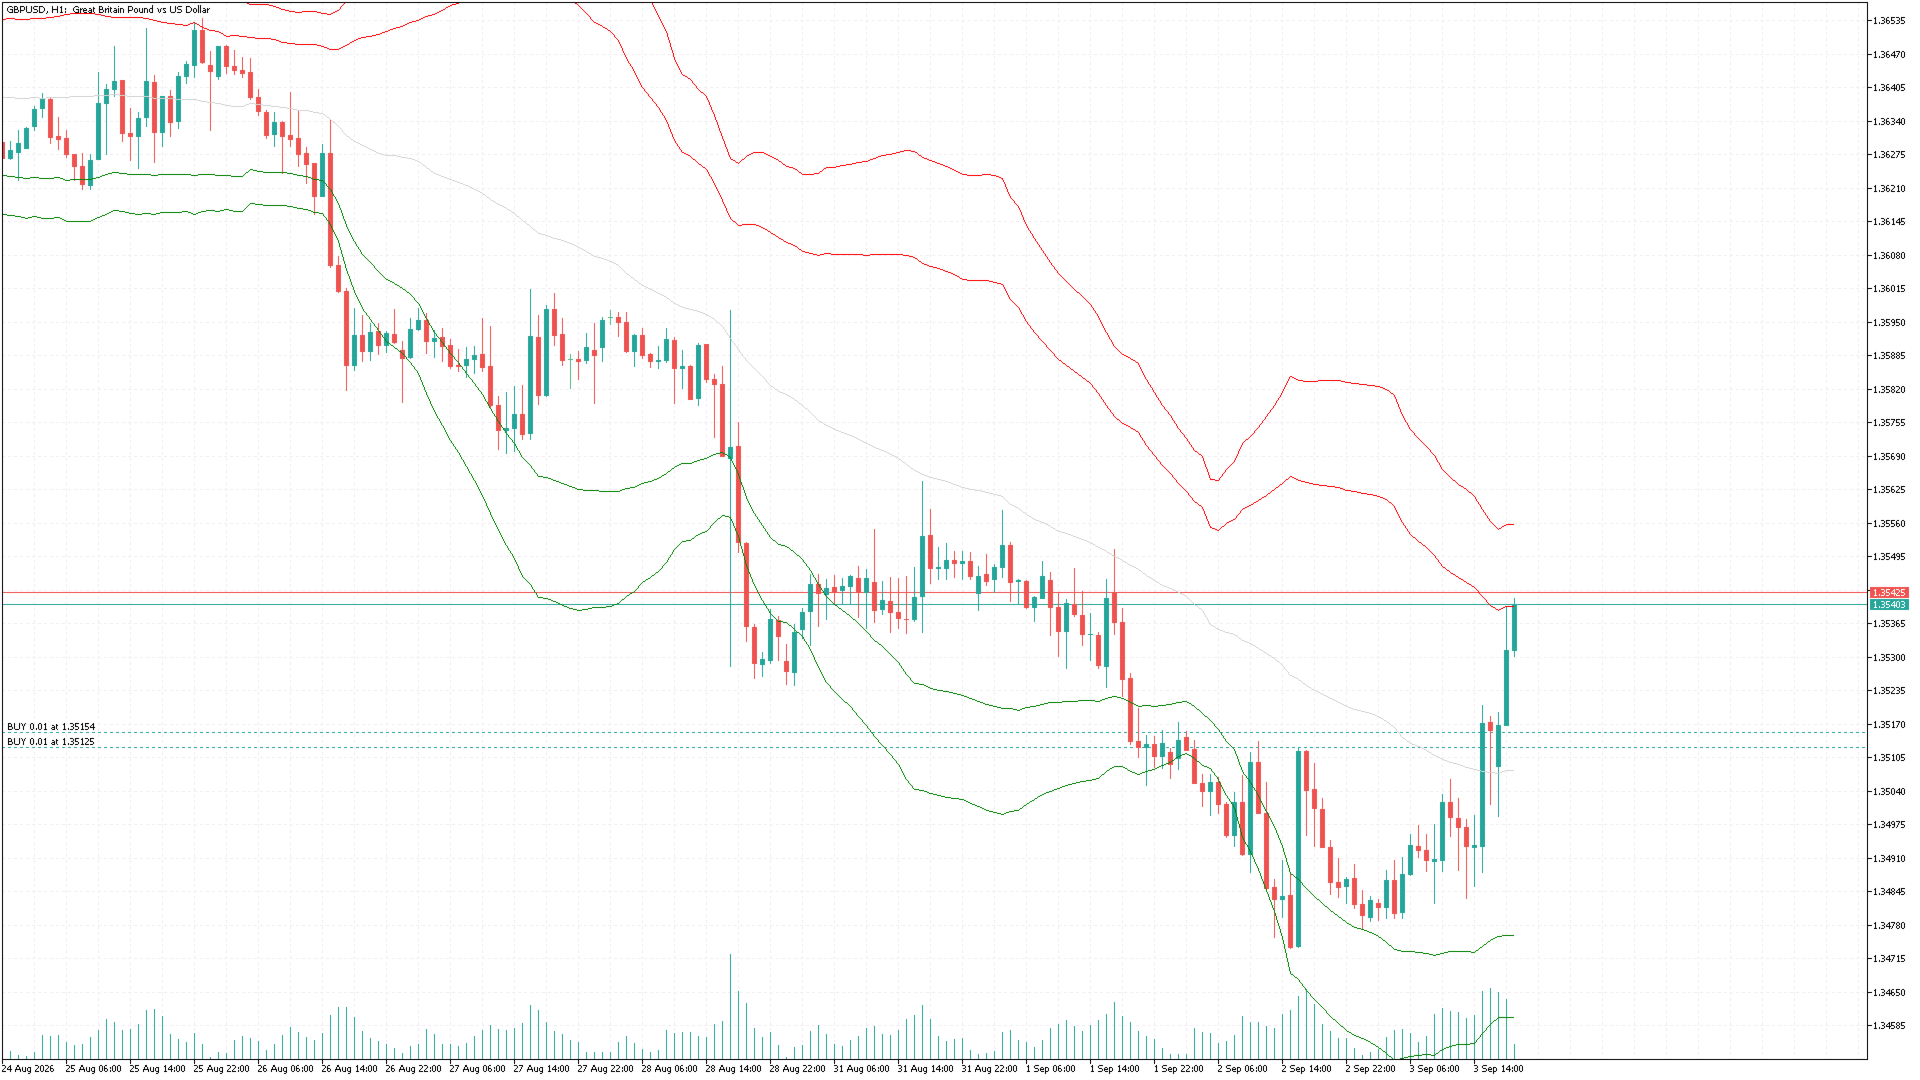
VWAP 偏差指标是一款基于成交量加权的价格分析工具,用于识别当前价格与动态计算的 VWAP 基准线及其偏差水平之间的关系。

与简单移动平均线不同,该指标采用Tick Volume(Tick 成交量)加权方式进行计算,使交易活动较高的价格水平在 VWAP 计算中获得更大的权重。

指标显示中央 VWAP Basis,同时提供 2 倍和 3 倍偏差带,为分析当前价格位置、潜在的价格过度延伸以及均值回归区域提供动态参考框架。

主要功能

成交量加权 VWAP

指标使用所选计算周期内的 Tick Volume 计算自定义 VWAP。

动态偏差带

VWAP 周围显示四个偏差水平:

  • Upper Dev 2 — VWAP + 2× 偏差

  • Upper Dev 3 — VWAP + 3× 偏差

  • Lower Dev 2 — VWAP − 2× 偏差

  • Lower Dev 3 — VWAP − 3× 偏差

这些水平会根据当前市场条件动态调整。

两种偏差计算方法

您可以在以下两种方法之间进行选择:

平均偏差(Average Deviation)

  • 使用基于成交量加权的 VWAP 平均绝对偏差。

  • 提供对典型价格离散程度的稳健衡量。

标准差(Standard Deviation)

  • 使用成交量加权标准差。

  • 特别适用于识别价格相对于 VWAP 的统计显著偏离。

对数空间计算

可选的 **Log-Space(对数空间)**模式会在对数价格空间中执行 VWAP 和偏差计算,然后将结果转换回正常价格值。

当分析不同价格规模的市场,或者当比例价格变化比绝对价格变化更加重要时,该功能可能非常有用。

可配置的 VWAP 价格源

计算价格源可以从标准 MQL5 应用价格类型中进行选择,包括:

  • Close — 收盘价

  • Open — 开盘价

  • High — 最高价

  • Low — 最低价

  • Median — 中间价

  • Typical — 典型价格

  • Weighted — 加权价格

可配置的计算周期

VWAP 计算周期可以完全自定义。

默认设置为 60 根 K 线,但您可以根据自己的交易风格和所使用的时间周期选择合适的计算长度。

如何使用

VWAP Basis 可以作为动态参考水平,用于判断当前价格是在其成交量加权平均值之上还是之下。

偏差带可以帮助识别价格明显偏离 VWAP 的区域。

例如:

价格高于 VWAP
→ 市场价格高于其成交量加权参考价格。

价格低于 VWAP
→ 市场价格低于其成交量加权参考价格。

价格接近 ±2 偏差
→ 价格已经明显偏离 VWAP。

价格接近 ±3 偏差
→ 价格相对于 VWAP 参考值出现更大幅度的偏离。

这些水平可以作为额外的分析信息,用于趋势分析、回调、突破以及潜在的均值回归交易机会。

适用市场

该指标可以应用于:

  • 外汇(Forex)

  • 黄金及贵金属

  • 指数

  • 股票

  • 期货

  • CFD

  • 加密货币

该指标适用于不同时间周期,也可以作为自动化交易策略和 Expert Advisor(EA)的组成部分。

重要提示

VWAP 偏差指标是一款分析工具,并不提供任何保证盈利的交易信号。

偏差水平应结合价格行为、市场结构、趋势状况以及其他相关市场信息进行综合判断。

参数

Log-space
启用或禁用对数空间 VWAP 和偏差计算。

Deviation Type
在 Average Deviation(平均偏差)和 Standard Deviation(标准差)之间进行选择。

Length
用于 VWAP 和偏差计算的 K 线数量。

VWAP Source Price
选择用于计算的价格来源。

简单、清晰而强大的 VWAP 分析

使用 VWAP 作为动态市场参考线,并通过偏差带了解当前价格距离其成交量加权平均值有多远。

VWAP Basis • 2× 偏差 • 3× 偏差 • 平均偏差/标准差 • Log-Space • 完全可配置

推荐产品
This product is designed for the MT5 platform and offers two key features: VWAP (Volume Weighted Average Price) calculation and Volume Profile analysis. Advantages: VWAP Calculation: The product calculates the VWAP, which is a popular indicator used by traders to determine the average price of a security based on its trading volume. It helps identify potential buying or selling opportunities by comparing the current price to the average price weighted by volume. Volume Profile Analysis: The prod
VWAP Indicator MT5
Kyra Nickaline Watson-gordon
Description : VWAP (Volume-Weighted Average Price) is the ratio of the value traded to total volume traded over a particular time horizon. It is a measure of the average price at which pair is traded over the trading horizon. Read More. All Symbols and All Timeframes are supported. Indicator Inputs :     VWAP Mode : Mode of VWAP Calculation. Options can be selected : Single,Session,Daily,Weekly,Monthly     Volumes : Real Volumes,Tick Volumes     Price Type : Used price for calculating. O
Stackable VWAP
Flavio Javier Jarabeck
3.5 (4)
Volume Weighted Average Price (VWAP) is a trading benchmark commonly used by Big Players that gives the average price a Symbol has traded throughout the day. It is based on both Volume and price. Additionally we put in this indicator the MVWAP (Moving Volume Weighted Average Price). For those who do not know the usage and the importance od this indicator I recommend a great article about this subject at Investopedia ( https://www.investopedia.com/articles/trading/11/trading-with-vwap-mvwap.asp
FREE
OrderFlux – MetaTrader 5 的订单流 (Order Flow) 与足迹图 (Footprint) 指标 OrderFlux 是一款专业的 MetaTrader 5 订单流和足迹图指标。它打开每一根 K 线,揭示其内部结构:每个价格水平的交易量,并将其划分为主动买盘和主动卖盘。根据这些 Tick 数据,系统会实时构建完整的足迹图,包括 Delta, Imbalance (失衡), Volume Profile (成交量分布) 和 Market Profile (市场轮廓) 。 常规图表只显示开盘、最高、最低和收盘价。这只是运动的结果,而非原因。OrderFlux 让每根 K 线的微观结构变得可见,并回答了最关键的问题: 究竟是谁在真正推动行情? 这使得交易者能够基于真实的交易量来读取支撑和阻力,而不是仅仅根据 K 线形状进行猜测。 足迹图显示内容 在每个价格水平上,都会显示两个数字。左侧是 Bid(买价)的交易量,右侧是 Ask(卖价)的交易量。这两侧之间的关系创造了 Delta — 来自买方或卖方的净压力。 Imbalances (失衡): 某一方具有压倒性优势的
MTF VWAP Indicator - Quick Overview   This indicator shows you where institutional money is flowing across multiple timeframes using Volume Weighted Average Price (VWAP) to identify high-probability trading zones. New version has VWAP bands plotting capability if user enabled and display panel (whose background changes colour on confluence) can be toggled on/off.      What It Actually Does:     1. Tracks Smart Money Levels: - Shows Daily, Weekly, and Monthly VWAP lines where big players (banks,
QuantMatrix Probability AI PRO QuantMatrix Probability AI PRO is a technical indicator for MetaTrader 5 designed to evaluate current market conditions and present them as BUY, SELL and NEUTRAL percentage estimates. The indicator combines several market measurements, including trend, momentum, volatility, price position, candlestick wick behavior and breakout conditions. It also compares the current market state with similar historical situations found in the selected symbol and timeframe. The hi
Angus Orderflow Heatmap
Mr Monthon Chaipreechapat
Volume Footprint & Heatmap Indicator This indicator combines Volume Footprint and Heatmap visualization, inspired by the Order Flow and Heatmap concepts found in Bookmap. Unlike futures markets, the Forex market does not provide real exchange-traded volume data. Instead, it only offers Tick Volume . This indicator is designed to simulate Bookmap-style market visualization as closely as possible using the available Tick Volume data. Because the indicator relies on Tick Volume, the quality and acc
Moving VVC mt5
Andriy Sydoruk
The   Visual Volatility Clustering   indicator clusters the market based on volatility. The indicator does not redraw and gives accurate data, does not use closing prices. Uses the opening prices or the highs or lows of the previous completed bar. Therefore, all information will be clear and unambiguous. The essence of the indicator is to divide the price market into certain areas according to a similar type of volatility. This can be done in any way. In this example, the indicator is configure
Anchored VWAP with Alert MT5
Trade The Volume Waves Single Member P.C.
5 (1)
What is the Volume Weighted Average Price (VWAP)? The volume weighted average price (VWAP) is a trading benchmark used by traders that gives the average price an instrument has traded at throughout the day, based on both volume and price.  It is important because it provides traders with insight into both the trend and value of the instrument. What is the Difference between VWAP and AVWAP? While VWAP is having as starting point the beggining of the day,week,month etc. in the AVWAP you can pla
Breakout Boxes with Volume Pressure This indicator automates the identification of key consolidation zones (Supply and Demand) based on Market Pivots and Volatility (ATR). Unlike standard support/resistance tools, this indicator provides a unique   Volume Pressure Analysis   inside every box, giving you insight into the battle between Buyers and Sellers before a breakout occurs. Key Features Automated Supply & Demand Zones:   Automatically detects significant Pivot Highs and Lows to draw dyna
Midas VWAP
Paulo Henrique Faquineli Garcia
4 (2)
Volume Weighted Average Price (VWAP) is a trading benchmark commonly used by Big Players that gives the average price a Symbol has traded throughout the day. It is based on both Volume and price. This indicator contains Daily VWAP and MIDAS' VWAP, which means you are able to anchor the beggining of MIDAS' calculations and, therefore you will be able to use this methodology to study price versus volume moves after anchor point. You will be able to anchor up to 3 HIGH MIDAS VWAP's and 3 LOW. Wish
FREE
The  OBV MTF  is an Enterprise-grade On-Balance Volume indicator that transforms standard OBV into a complete trading system. It combines gradient-aware momentum analysis, divergence detection, multi-timeframe alignment, and dynamic customisable midpoint-filtering in a single intuitive professional volume analysis tool. Core Features 1. 5-State Momentum Engine Aqua (Strong Bullish) : OBV slope rising with positive acceleration SteelBlue (Weak Bullish) : OBV rising but losing momentum Gray (Neutr
RAD Real Acummulation and Distribution
Jose Alejandro Jacome Jimenez
RAD CRITICAL LEVES RAD indicator tracks “Relevant Volume” in real time, identifying accumulation and distribution processes, projecting them in the chart as SUPPORT or RESISTANCE zones. Natural   support   and resistance levels are generated by Volume Accumulation and Distribution processes. As these processes evolve, levels at which the relevant volume in the market place is positioned, become difficult areas to cross upwards or downwards. By using this information, traders can identify very s
Market Structure Evaluator MTF Market Structure Evaluator MTF is an institutional-grade price action indicator designed for Smart Money Concepts (SMC) and Market Structure traders. It automatically tracks Market Structure Breaks ( BOS ) and Change of Character ( CHOCH ) in real-time across multiple timeframes, giving you a complete macro-to-micro view of market trend alignment without cluttering your charts or having to analyse other timeframes. Whether you trade manually or build automated tr
Adjustable Consecutive Fractals  looks for 2 or more fractals in one direction and sends out a on screen alert, sound alert and push notification, for strong reversal points . Adjustable Consecutive Fractals, shows the fractals on chart along with a color changing text for buy and sell signals when one or more fractals appear on one side of price. Adjustable Consecutive Fractals is based Bill Williams Fractals . The standard Bill Williams fractals are set at a non adjustable 5 bars, BUT withe th
VWAP and MVWAP
Flavio Javier Jarabeck
4 (9)
Volume Weighted Average Price (VWAP) is a trading benchmark commonly used by Big Players that gives the average price a Symbol has traded throughout the day. It is based on both Volume and price. Additionally we put in this indicator the MVWAP (Moving Volume Weighted Average Price). For those who do not know the usage and the importance od this indicator I recommend a great article about this subject at Investopedia ( https://www.investopedia.com/articles/trading/11/trading-with-vwap-mvwap.asp )
FREE
MR Volume POC Levels 5
Sergey Khramchenkov
The most important price level in any "Volume profile" is the "Point of Control" . This is the price level with the highest trading volume. It is primarily the level where large players initiate their positions, making it the accumulation/distribution level for the "Smart money" . The idea of the indicator arose after the "MR Volume Profile 5" indicator was made. When creating the "MR Volume Profile 5" indicator, we spent a lot of time comparing the volumes with those from the volume profile in
Volume flow Profile
Israr Hussain Shah
大师版是一款专业级的分析工具,旨在通过成交量和资金流向的视角来可视化市场结构。与标准的成交量指标不同,该工具直接在图表上显示每日成交量分布,让您准确看到价格发现发生的位置以及“聪明钱”的定位。 此大师版专为清晰度和速度而设计,具有独特的自动主题同步系统,加载后即刻美化您的图表布局。 主要特点: 真实资金流向计算: 超越标准的跳动量。启用“Use Money Flow”时,成交量按价格加权,揭示了特定价格水平的实际资金投入。 价值区域 (VA) 可视化: 自动计算价值区域(默认为成交量的70%)。 VA填充: 为价值区域背景着色,以便即时识别控制区域。 关键水平: 清晰标记控制点 (POC)、价值区域高点 (VAH) 和价值区域低点 (VAL)。 专业标记系统: 扫描概况结构以识别关键交易区域: HVN (高成交量节点): 接受和盘整区域(支撑/阻力)。 LVN (低成交量节点): 拒绝区域或“快速通过”区域。 所有标记均向右绘制延长线,便于监控。 Delta 背离(左侧直方图): 左侧直方图可视化每个级别的买卖压力对比。这有助于识别隐藏的背离——即价格可能上涨,但卖家在这些水平上激进打
Meravith MT5
Ivan Stefanov
5 (3)
做市商工具。 Meravith 将: 分析所有时间周期并显示当前正在运行的趋势。 标注流动性区域(成交量均衡区),即多头与空头成交量相等的位置。 在您的图表上直接显示来自不同时间周期的所有流动性水平。 生成并展示基于文本的市场分析供您参考。 根据当前趋势计算目标位、支撑位和止损位。 计算交易的风险回报比。 根据您的账户余额计算仓位大小,并估算潜在利润。 在市场出现重大变化时,Meravith 还会发出警告。 指标的主要线条: 多头/空头成交量衰竭线 —— 作为目标位使用。 趋势线 —— 指示市场趋势方向。根据市场是多头还是空头而改变颜色,并作为趋势支撑。其颜色主要反映市场情绪。 成交量均衡线(Eq)—— Eq(Volume Equilibrium)是系统的核心。它表示买卖双方成交量的平衡点,即市场流动性所在位置。向上突破 Eq 表示多头倾向,向下突破 Eq 表示空头倾向。突破后,应等待回调——当价格回到相反趋势的偏离线或衰竭线附近时。 使用方法:只需将其添加到图表中。 Meravith 可以分析一切——趋势和回调。 趋势线与某条成交量衰竭线之间的距离越大,说明该方向的成交量越高。 趋势
Liquidity HeatMap Profile
Israr Hussain Shah
5 (1)
Here   our more valuable tools SMC Trend Trading   ,  Easy SMC Trading  ,  Institutional SMC Architect Volume Analysis Tools  ,  Volume flow Profile  ,  Market volume profile  , FVG with Volume  , Liquidity Heatmap Profile  ,  Volume Spread Analysis 2. Key Features Dynamic Filtering : The core feature. As soon as the current price crosses a historical liquidity level, that level disappears. This reduces chart clutter and prevents you from trading off "dead" support/resistance. Liquidity Heatma
该指标基于离散哈特利变换。使用此转换允许您在处理金融时间序列时应用不同的方法。该指标的一个显着特点是它的读数不是指图表上的一个点,而是指指标周期的所有点。 处理时间序列时,指标允许您选择时间序列的各种元素。过滤的第一种可能性是建立在这种方法上的——所有不必要的高频分量都被简单地丢弃。第一个图展示了这种方法的可能性,选择CutOff参数,可以选择原始时间序列的细节(红线-只剩下主要信息CutOff = 0,黄色-主要和最低频率周期CutOff = 1 , 蓝色 - 所有最高频的噪声都被丢弃 CutOff = 4 )。然而,这不是唯一的可能性——噪声分量可以通过额外的过滤来抑制。 这两个选项都在该指标中实施。它的参数是: iPeriod - 指标周期 Shift - 指标相对于当前柱的偏移。通过更改此参数,您可以评估指标过去的表现。 NoiseReduction 是一种降低噪音的方法。可能的值:none - 不抑制噪声(在这种情况下只有 CutOff 参数起作用),constant - 噪声通过常数衰减,linear - 线性噪声抑制,对数 - 对数衰减,square - 根据平方根进行
Automatic Vwap Midas
Ricardo Almeida Branco
5 (1)
The 3 Automatic Vwap (Midas) Indicator can be used for Price and Volume studyers to map the movement of market drivers. It automatically plots 3 Vwaps, two of which are dynamic and will be updated throughout the day if new highs or new lows emerge. The third Vwap is daily and can help if the trend is up or down. Also, an auxiliary indicator that plots (also dynamic) points of interest with OHLC prices (Open, High and Low of the current day and Close of the previous day) was inserted. Success and
MIDAS Super VWAP
Flavio Javier Jarabeck
4.27 (11)
Imagine VWAP, MVWAP and MIDAS in one place... Well, you found it! Now you can track the movement of Big Players in various ways, as they in general pursue the benchmarks related to this measuring, gauging if they had good execution or poor execution on their orders. Traders and analysts use the VWAP to eliminate the noise that occurs throughout the day, so they can measure what prices buyers and sellers are really trading. VWAP gives traders insight into how a stock trades for that day and deter
FREE
Deriv BC Blue Guardian
Israr Hussain Shah
After Purchase Inbox TO get your Trader Kit with this tool YouTube Demo B&C Blue Guardian is a professional-grade precision indicator built for Boom & Crash indices, Deriv synthetics, . It combines multi-oscillator confluence  to pinpoint high-probability spike and reversal zones with zero chart lag.   Strict Direction Engine: Automatically enforces BUY-onl
Market Profile Osw MT5
William Oswaldo Mayorga Urduy
用户手册:Market Profile Osw Market Profile Osw 是一款先进的拍卖分析工具,能够可视化特定周期内的成交量和价格分布。与传统的 K 线图不同,该系统揭示了交易活动最集中的区域,从而根据实际市场参与情况识别心理支撑位和阻力位。 1. 参数指南(输入菜单) 常规设置 Show Market Profile: 启用或禁用图表上的轮廓显示。 Volume Type: 可选择通过价格变化计数(Tick)或实际交易量(仅限特定经纪商和资产)来衡量活动。 Look Back Bars: 定义指标将回溯多少根 K 线来构建当前轮廓。 Profile Right Side: 确定轮廓是贴近价格轴绘制(右侧)还是在分析周期的起始处绘制(左侧)。 Seconds Refresh: 指标更新数据并重新绘制轮廓的等待时间。 美学与颜色 Market Profile Lines Color: 相关性较低的一般交易区域颜色。 70% Value Area Algorithm Lines Color: 突出显示价值区域(Value Area)的颜色,该区域集中了 70% 的交易
Wave Box Market Frenquency
Jean Jacques Huve Ribeiro
4.75 (4)
Totally linked to the result of a movement and the duration he had. Its height records how many ticks the asset walked during a given movement, its width shows us the duration that movement had. Its configuration must be in line with the Weis Wave Indicator configuration to observe the movement force and can indicate a possible accumulation or distribution of the movement;
FREE
BoxProfile MT5
Evgeny Shevtsov
4.6 (10)
The indicator displays volume profiles based on the nesting principle. Profiles periods are pre-set so that each subsequent profile has a length twice as long as the length of the previous profile. In addition to profiles, the indicator displays volume clusters sorted by color, depending on the volume they contain. Indicator operation features The indicator works on typical timeframes from M5 to MN, but for calculations uses historical data from smaller timeframes: M1 - for timeframes from M5
FREE
Wick Exhaustion Tracker
Roberto Abreu De Lucena
On-Screen Backtest : Shows the real Win/Loss results and win rate directly on your chart ( 62.5% accurate under real tests). Ultra Lightweight : Specially optimized to run perfectly on computers with low RAM (like 4GB) or remote VPS servers without freezing your platform. Complete Dashboard : Includes a live candle countdown timer, trend detector, and a daily candle counter on the right side of your screen. Visual Aids : Tracks daily maximum and minimum lines automatically on your chart. Input
Epic Sails PRO is a clean, session-anchored VWAP indicator designed to provide a clear institutional price framework — not trade signals. It plots a stable VWAP with non-overlapping volatility bands and a real-time VWAP angle (in degrees) to help traders assess directional bias, slope strength, and market state. This tool is ideal for traders who prefer structure, context, and mechanical confirmation over subjective indicators. Key Features Session-anchored VWAP (resets at user-defined session s
Eternal Spike Detector
Emma-ekong Ben Eshiet
N/B: All our product purchase comes with our free ‘’DAILY   SCALPER EA’’ -   bit.ly/4qlFLNh Whatsapp Developer for yours after successful purchase Eternal Spike Detector Pro - M5 Mastery System   HOW TO TRADE THIS SYSTEM   TRADING RULES For CRASH 500/900/1000: SELL SETUP: · Wait for RED DOWN ARROW to appear · Enter SELL at the close of the M5 candle where arrow appears · Stop Loss: 1.5x ATR above the entry high · Take Profit: 2-3x ATR below entry · Only trade maximum 7 signals per day
该产品的买家也购买
Neuro Poseidon MT5
Daria Rezueva
4.8 (54)
Neuro Poseidon is a new indicator by Daria Rezueva. It combines precise trading signals with adaptive TP/SL levels - creating best possible trades as a result! Message me and get  Neuro Poseidon Assistant  as a gift to automize your trading process! What makes it stand out? 1. Proven profitability on all assets and timeframes 2. Only confirmed BUY and SELL signals present on the chart 3. Adaptive TP & SL levels generated by the software for each trade 4. Easy to understand - suitable for al
Azimuth Pro
Ottaviano De Cicco
5 (7)
Azimuth Pro V2:MT5合成分形结构分析与确认入场 概述 Azimuth Pro 是 Merkava Labs 推出的多层级波段结构指标。四层嵌套波段层级、锚定波段的VWAP、ABC形态识别、三时间框架结构过滤以及收盘确认入场——一个图表,一个从微观波段到宏观周期的完整工作流程。 这不是盲目的信号产品。它是一个以结构为先的工作流程,专为重视位置、背景和时机的交易者打造。 ️ 夏季促销 — 庆祝夏至与 The Oracle Pro 上市:Azimuth Pro 七折优惠,现价 279 美元(原价 399 美元)。限时夏季优惠。 1. V2的变化 合成多时间框架引擎 高时间框架分析从零开始重建,采用与Meridian Pro相同的专有合成架构。更清晰的HTF背景、稳定的实时行为、无经典MTF同步问题。合成引擎还解锁了 固定比率时间框架级联 (x2、x3、x4、x6)——不再在经纪商的固定时间框架之间任意跳转,您可以按图表时间框架的固定倍数分析结构,在每个尺度上保持相同的分形关系。 确认入场箭头 作为稳定且可恢复的执行层而设计的收盘确认箭头。当ABC设置形成且自适应确认逻辑
UZFX {SSS} 超短线智能信号 v5.0 MT5 是一款无重绘的高性能交易指标,专为在快速波动的市场中需要精准、实时信号的超短线交易者、日内交易者和波段交易者设计。该指标由 (UZFX-LABS) 开发,融合了价格行为分析、趋势确认和智能过滤技术,可在所有货币对和时间周期内生成高概率的买卖信号、预警信号以及趋势延续机会。 别再对交易犹豫不决了,开始遵循这一专为追求清晰、精准和纪律性市场执行的交易者设计的结构化信号系统吧。 相信我,这是 MQL5 上最优秀的指标之一,所以千万不要错过!!“为睿智交易者打造的智能信号” 最新 5.0 版本现已发布,价格可能会在未事先通知的情况下上涨至 499.99 美元,所以请尽快入手,以免错失良机!! 最终购买前!如果您想获取免费试用版,请通过 WhatsApp 号码 +923030751987 联系我!! 如果您遇到任何问题“或”有任何不明白的地方,请在私聊中向我咨询!!! 主要功能更新 • 自动买入和卖出信号检测 • 先进的反转识别逻辑 • 潜在市场反转前的预警信号 • 趋势延续确认信号 • 内置风险管理功能,包含入场点、止损点、TP1、
TrendMaestro5
Stefano Frisetti
note: this indicator is for METATRADER4, if you want the version for METATRADER5 this is the link:  https://www.mql5.com/it/market/product/108106 TRENDMAESTRO ver 2.5 TRENDMAESTRO recognizes a new TREND from the start, he never makes mistakes. The certainty of identifying a new TREND is priceless. DESCRIPTION TRENDMAESTRO identifies a new TREND in the bud, this indicator examines the volatility, volumes and momentum to identify the moment in which there is an explosion of one or more of these da
Boom & Crash & PainX & GainX Ultimate Spike Detector Trade Spikes With Confidence — Not Guesswork Catching spikes should be one of the most profitable strategies in synthetic markets. But for most traders, it becomes one of the most frustrating. You enter too early… price goes against you. You wait for a spike… it never comes. You finally catch one… but don’t know whether to hold or close. You make profit… then give it all back because there’s no exit plan. This is exactly the problem the Ultim
Gem SIGNAL
Shengzu Zhong
5 (1)
GEM Signal Pro GEM Signal Pro 是一款適用於 MetaTrader 5 的趨勢跟隨指標,專為希望在圖表上獲得更清晰訊號、更有結構的交易設定,以及更實用風險管理的交易者而設計。 它不僅僅顯示一個簡單的箭頭,GEM Signal Pro 還能以更清晰、更易讀的方式呈現完整的交易思路。當條件確認完成後,指標可在圖表上顯示進場價、止損價與止盈目標,幫助交易者更有效率地評估交易設定。 運作方式 該指標首先根據其內部邏輯識別有效的初始訊號。 當確認條件滿足後,GEM Signal Pro 會在圖表上顯示完整的交易設定。這讓交易者可以更清楚地看到交易結構,並減少手動分析與計算的工作量。 圖表上的交易價位 對於已確認的訊號,GEM Signal Pro 可顯示: 進場價 止損價 止盈 1 止盈 2 止盈 3 風險報酬比 這讓交易設定更容易理解,也有助於讓圖表分析更有條理。 內建風險管理 風險管理是此指標設計的重要部分。 止損位基於近期市場結構,結合附近的擺動高低點與可選的 ATR 緩衝距離。這能讓交易價位更貼近當前市場條件,而不只是依賴固定距離。 圖表資訊面板 GEM Si
PrimeScalping
Temirlan Kdyrkhan
PrimeScalping is a powerful trading companion designed to generate high-probability entry signals with dynamic TP/SL/DP levels based on volatility. Built-in performance tracking shows win/loss stats, PP1/PP2 hits, and success rates — all updated live. Key Features: Buy/Sell signals with adaptive volatility bands Real-time TP/SL/DP levels based on ATR Built-in MA Filter with optional ATR/StdDev volatility Performance stats panel (Success, Profit/Loss, PP1/PP2) Alerts via popup, sound, push, or e
FX-AIEA 供给需求区智能识别指标(Supply and demand indicators MT5) 版本:2.51 | 适用平台:MetaTrader 5  为什么交易需要供给需求区? 供给需求区是机构订单流的核心体现,比传统支撑阻力更精准地反映真实买卖力量。但手动绘制不仅耗时,而且主观性强、容易错过关键区域。 FX-AIEA 供给需求区指标 采用自适应 ZigZag 算法,自动识别高概率供需区域,并将它们以彩色矩形直观标注在图表上,让您一眼看清当前市场的“禁区”与“机会区”。 核心特性 全自动绘制 + 实时刷新 基于改良版 ZigZag 动态提取有效波峰波谷,精准定位潜在供给区(红色)与需求区(天蓝色)。 新 K 线自动更新:指标使用 MQL5 原生  prev_calculated  机制,每出现一根新 K 线即重新计算并重绘区域,永远不会“卡住不刷新”。 支持手动刷新(双击图表或切换周期),确保数据始终同步。 灵活的时间框架 Forced_TimeFrame  参数:可强制指标运行在任意周期(如小时图加载指标,但基于日线计算区域)。 默认跟随当前图表周期,满足日内、波段、
SmartScalping
Temirlan Kdyrkhan
SmartScalping is a powerful trading companion designed to generate high-probability entry signals with dynamic TP/SL/DP levels based on volatility. Built-in performance tracking shows win/loss stats, PP1/PP2 hits, and success rates — all updated live. Key Features: Buy/Sell signals with adaptive volatility bands Real-time TP/SL/DP levels based on ATR Built-in MA Filter with optional ATR/StdDev volatility Performance stats panel (Success, Profit/Loss, PP1/PP2) Alerts via popup, sound, push, or e
ScalpPoint
Temirlan Kdyrkhan
ScalpPoint is a powerful trading companion designed to generate high-probability entry signals with dynamic TP/SL/DP levels based on volatility. Built-in performance tracking shows win/loss stats, PP1/PP2 hits, and success rates — all updated live. Key Features: Buy/Sell signals with adaptive volatility bands Real-time TP/SL/DP levels based on ATR Built-in MA Filter with optional ATR/StdDev volatility Performance stats panel (Success, Profit/Loss, PP1/PP2) Alerts via popup, sound, push, or emai
TrendProMaster
Temirlan Kdyrkhan
MasterTrend Indicator for MT5 A powerful trend-following and signal-evaluation tool MasterTrend   is a custom MT5 indicator that combines Moving Averages and ATR-based risk/reward logic to generate clear buy/sell signals. It visualizes dynamic SL/TP levels, evaluates past trade outcomes, and displays win/loss statistics in a clean on-chart panel. Key features include: Buy/Sell signals based on MA crossovers ATR-based SL/TP1/TP2/TP3 levels with visual lines and labels Signal outcome tracking wit
Transaction Speed MT5
Ivan Stefanov
5 (4)
当然,以下是翻译成中文(简体)的版本: 该指标标出市场中显现出 交易兴趣 的区域,并随后显示 订单积累区域 。它的工作方式类似于大规模的订单簿。 这是为 大资金 打造的指标,性能卓越。市场中有任何兴趣,你都能通过它清晰看到。 (这是一个 完全重写的自动化版本 —— 不再需要手动分析。) 交易速度 是一个全新的概念指标,它显示了市场上大订单 何时 、 何地 聚集,并揭示了其背后的意义。它可以在 非常早期 就检测到趋势的变化。 在外汇市场,所谓的“交易量”实际上是误导性的,因为那指的是价格在单位时间内的变化,因此真正的名称应是“交易速度”。 一切都取决于我们如何思考、如何行动、如何分析。 改变分析范式至关重要。 该指标完全重构了外汇市场上“交易量”的概念,用逻辑方式重新定义并应用,从而成为一个 独特而精准的工具 。 使用方法: 默认情况下,指标处于 自动模式 ,可独立用于任何时间周期。如果你希望切换到手动模式,只需点击 Auto / Manual Mode 按钮即可。 在 手动模式 下,所有计算从 2025年1月1日 开始。你可以根据需要更改该日期,以查看不同的分析结果。 最优数据周期
KT Alpha Hunter Arrows MT5
KEENBASE SOFTWARE SOLUTIONS
大多数箭头指标只给你一个信号,然后让你自己去判断剩下的一切。KT Alpha Hunter Arrows 为你提供完整的交易计划。 每一个信号箭头出现时,都会同时绘制一套完整计划:入场线、止损位、四个止盈目标,以及实时优势判断,告诉你当前这个交易品种和时间周期是否值得交易。随附的 Trade Manager EA 会在你手动入场后负责后续执行,让你在市场波动剧烈、情绪干扰明显时也能保持交易纪律。不重绘。仅在K线收盘后确认信号。适用于 Forex、黄金、指数以及任何你在 MT5 上交易的品种。 核心功能 不重绘买入和卖出箭头,只在K线收盘后生成。 每个信号都会显示入场线、结构性止损位和四个止盈目标。 Edge Dashboard 会分别评估当前图表上的买入和卖出机会。 判断系统包括:No Edge、Marginal、Tradeable、Good 或 Strong。 一键 Auto Optimize 按钮可根据当前品种和时间周期自动优化设置。 完整套装包含 Trade Manager EA,并提供五种专为本指标设计的预设交易管理方案。 Prop Firm Risk Panel 可在图表上
RelicusRoad Pro MT5
Relicus LLC
4.96 (24)
RelicusRoad Pro: 量化市场操作系统 终身访问限时 70% 折扣 - 加入 2,000+ 交易员社区 为什么大多数交易者即使拥有“完美”指标也会失败? 因为他们在真空中交易 单一概念 。没有背景的信号是赌博。要持续获胜,您需要 共振 (CONFLUENCE) 。 RelicusRoad Pro 不是一个简单的箭头指标。它是一个完整的 量化市场生态系统 。它描绘价格运行的“公允价值之路”,区分市场噪音和真实的结构性突破。 停止猜测。开始用机构级“路”逻辑进行交易。 核心引擎:“Road” (路) 算法 系统的核心是 Road Algo ,一个实时适应市场条件的动态波动率通道。它投射出 安全线 (平衡) 和价格可能反转的 扩展水平 。 Simple Road: 典型市场的标准结构映射。 Smooth Road: 针对震荡盘整的降噪计算。 Breakout Road: 专为识别波动率扩张和爆发性走势而调整。 1. 算法动量与确认 我们的“剥头皮箭头”不只是简单的交叉。它们利用 高阶多项式逻辑 过滤噪音,确保信号与主周期一致。我们检测动量、价格行为和 Road 结构汇聚的精确入场
看清市场真正在做什么。   在您眼前实时观察三大市场阶段(收缩、扩张、趋势),并在趋势阶段的早期阶段抓住更优的入场点。   不要再猜测。开始像机构和聪明钱那样解读市场。   Apex Market Structure Pro(MT5 版)是一款精准的聪明钱分析工具,它剥离噪音,向您展示每根 K 线之下的真实结构:流动性、结构转变、吸   筹区域与趋势偏向,全部呈现在一个简洁、专业的图层中。专为厌倦了滞后指标、准备以清晰视角交易的严肃交易者打造。   重要提示:本指标专为 Heikin Ashi(平均足)K 线设计。使用前请将图表切换为 Heikin Ashi,以释放其全部威力。全部分析都围绕 Heikin   Ashi 的价格流构建。正是在这里,Apex Market Structure Pro 发挥出最佳表现。   交易者为何选择 Apex Market Structure Pro:   流动性,一览无遗: 瞬间看清止损池所在之处。卖方与买方流动性会被自动标注。实时关注尚未被扫的价位,捕捉价格攫取流动性并反转的精确时   刻。在聪明钱交易的地方交易。   会说话的结构:
历史相似性匹配指标  概述 历史相似性匹配器(Historical Similarity Matcher)是 MetaTrader 5 的技术分析指标。它扫描历史价格数据,寻找与用户在图表上选定的参考时期具有统计相似性的片段。当找到匹配时,指标会显示历史模式,并根据这些历史片段的后续走势绘制潜在未来价格走势的投影。 本指标仅供教育和分析用途,不构成财务、投资或交易建议。不保证结果或盈利能力。过去表现不代表未来结果。交易存在重大损失风险。用户对自己的交易决策和结果负全责。  功能特点 - 识别与选定参考时期具有相关性的历史价格片段 - 支持正向和反向模式匹配 - 显示多个匹配的历史模式(数量可配置) - 为每个匹配绘制基于历史延续的独立投影线 - 可选 OpenCL 支持,在兼容硬件上加速计算(不支持时回退到 CPU) - 适用于任何时间周期和交易品种 - 允许在不同于当前图表的时间周期上进行扫描 - 在图表上提供启动扫描和导出结果的按钮 - 导出每个匹配的截图以及包含匹配详情的 CSV 文件  工作原理 1. 用户通过在图表上放置两条垂直线或在输入参数中设置日期来选择
AriX
Temirlan Kdyrkhan
1 (4)
AriX Indicator for MT5 A powerful trend-following and signal-evaluation tool AriX is a custom MT5 indicator that combines Moving Averages and ATR-based risk/reward logic to generate clear buy/sell signals. It visualizes dynamic SL/TP levels, evaluates past trade outcomes, and displays win/loss statistics in a clean on-chart panel. Key features include: Buy/Sell signals based on MA crossovers ATR-based SL/TP1/TP2/TP3 levels with visual lines and labels Signal outcome tracking with real-time stat
Gold Uptrend Insider
Lawrence Chiiambb Mkandawi
5 (1)
Uptrend Insider A clean and powerful trend-following indicator that helps you catch the beginning of uptrends and exit before the market turns into a range or downtrend. How it works:   Green → Uptrend signal (potential buying opportunity) Orange → Ranging / sideways market possibility but maintain the trend positions just keep an eye for possible ranges and reversals. Red → Downtrend or exit signal (time to close long positions) The indicator is designed to be extremely simple and visual. You o
OrderFlow Absorption – 專業級MT5買賣差與吸收訊號指標 釋放真正訂單流分析的力量,OrderFlow Absorption 是MetaTrader 5上最強大的買賣差(Delta)直方圖與吸收訊號指標。專為想看清每一個價格波動背後真相的交易者設計,這個工具揭示了隱藏的買賣壓力與推動市場的吸收事件。 功能特色 買賣差直方圖視覺化:   以清晰的色彩直方圖即時顯示買方與賣方壓力。 吸收訊號偵測:   先進邏輯自動辨識多空吸收事件,及早預警潛在反轉。 圖表標記:   吸收訊號直接標示於主圖表,方便視覺辨識。 彈出式警報:   新吸收訊號出現時即時通知。 自訂門檻:   過濾弱訊號,專注高勝率機會。 資源管理:   高效運算,適用於大型圖表也能流暢運行。 全品種兼容:   適用於任何商品與週期,包括外匯、指數、商品等。 簡易整合:   參數簡單,快速上手與調整。 OrderFlow Absorption 的邏輯說明 OrderFlow Absorption 採用專利演算法,能在沒有完整Tick數據的情況下,估算每根K棒的買賣壓力(Delta)。它分析成交量、價格行為、K
您好,交易员! 大多数散户交易者依赖于滞后的网页脚本。真正具有交易优势需要机构化的架构。 Astro AI 指标并非标准的图表叠加层。它是一个编译后的神经网络,包含两个代理,直接运行在您的终端上。 以下是该系统背后的具体技术: 1. 代理 1:分析师(图神经网络 - GNN) 市场并非孤立的价格柱;它们是相互关联的数据网络。 功能:代理 1 使用图神经网络来映射这些复杂的非线性关系。 优势:标准指标仅考虑单一的历史移动平均线,而我们的 GNN 可以实时处理深层的市场结构关系,在散户交易量发挥作用之前揭示隐藏的相关性。 2. 代理 2:执行器(近端策略优化 - PPO) 模式识别只是成功的一半。基于当前市场波动做出正确的决策,才是预测模型与滞后模型之间的区别所在。 功能:代理 2 使用 PPO(一种先进的强化学习算法)来确定最佳入场点。 优势:它持续调整交易策略,而非使用静态的“超买”或“超卖”线。它会分析当前市场状况并计算最可能的成交点。 执行桥接:通过 ONNX 集成到交易终端 如果执行速度慢,模式识别就毫无用处。我们已通过 ONNX(开放神经网络交换平台)
VTrende Pro
Andrii Diachenko
5 (1)
VTrende Pro - MTF indicator for trend trading with a display panel for MT5 *** Videos can be translated into any language using subtitles (video language - Russian) Although the signals of the VTrende Pro indicator can be used as signals of a full-fledged trading system, it is recommended to use them in conjunction with the Bill Williams TS. VTrende Pro is an extended version of the VTrende indicator. Difference between Pro version and VTrende: - Time zones - Signal V - signal 1-2 waves -    S
Flag Pattern Angelo
Brighton Mufaro Mudzingwa
Brandon Angelo Flag Pattern — how it works This indicator automatically detects classic bull and bear flag chart patterns in real time. The detection happens in three stages for each bar. First it looks for a flagpole — a sharp, strong directional move over a configurable number of bars ( FlagpoleBars , default 5) that must exceed a minimum percentage size ( FlagpoleMinPct ). For a bullish flag the pole must close net higher than it opened; for a bearish flag, net lower. Second it identifies th
This indicator automatically detects internal & swing market structure, Fibonacci Retracement and Fibo Levels. Features Full internal & swing market structure labeling in real-time Fibonacci Retracement Fibonacci Levels After purchasing the indicator, the full source code is provided, and via indicator buffers it can be easily integrated into your Expert Advisors (EAs) for automated trading strategies.
Naked Forex Tweezer Pro Indicator Tweezer Pro Indicator is a pattern recognition indicator for Forex, Stocks, Indices, Futures, Commodities and Cryptos. The standard Tweezer is a two bar pattern. Our enhanced version is a multi-bar pattern. We filter the patterns for you so that you only get the     best and most effective patterns   and ignore the noise. The Tweezer pattern is a simple and effective pattern to trade. The strategy that comes with the Tweezer is based on price action. The Twe
Chimera Volume
Marko Milenkovic
适用于 MetaTrader 5 的 Chimera Volume 高级成交量分析与市场活跃度可视化 Chimera Volume 是一款为 MetaTrader 5 设计的自定义指标,旨在通过动态视觉框架分析标准化成交量活跃度,并展示市场参与度的变化。 该指标利用自适应标准化算法处理 Tick 成交量数据,生成关于成交量强度、累积阶段以及不同市场条件下活跃度变化的结构化表达。 与显示原始成交量数值的标准成交量指标不同,Chimera Volume 应用了额外的计算方法,以突出市场活动的相对变化并提高图表的可读性。 主要功能 根意图直方图 (Root Intent Histogram): 一种动态直方图,用于可视化标准化成交量强度和市场参与度。该直方图使用自适应颜色过渡,以区分活跃度增加时期与参与度减弱时期。 惯性线 (Inertia Line): 一条由标准化成交量计算得出的平滑分析线。旨在帮助交易者观察成交量动能的变化,并监控扩张期与收缩期之间的转换。 信号线 (Signal Line): 一个用于比较短期和长期成交量表现的次级计算层,在评估市场状况时可作为辅助参考。 自适应成交量
CGE Trading Suite
Carl Gustav Johan Ekstrom
5 (2)
Institutional-Grade Analytics for MT5 The full analytical edge of a professional trading desk, built into your MT5 chart. CGE Trading Suite is an indicator system of 21 integrated modules covering market structure, timing, momentum, volume, capital flow and regime change, combined into a single chart-based workspace. Why CGE Trading Suite? The suite empowers traders with structure, confidence, and consistent performance across all markets and time frames. Hover over any signal or tool on the c
Meravith Scanner
Ivan Stefanov
5 (3)
MERAVITH SCANNER 是一款适用于 MetaTrader 5 的专业金融市场指标,将多种分析工具整合为一个统一的系统。它基于专有的成交量加权平均价格(VWAP)方法自动完成所有计算,完全消除主观判断。 该指标适用于所有资产类别(外汇、股票、指数、大宗商品、加密货币)以及从 M1 到 Monthly 的所有时间周期。其核心原理是价格跟随成交量。MERAVITH 识别机构资金成交量的集中区域,并从该集中区域中推导出数学上精确的价格水平。它不预测,不推测。它只计算。 使用 MERAVITH SCANNER,您可以在 2–3 分钟内扫描全部 28 个主要外汇货币对的所有时间周期。您也可以扫描任何您选择的市场——例如,大约 100 只股票约需 10 分钟。 该指标计算耗尽水平、平衡线、偏差、统计水平以及目标投射。 图表元素 Origin Point 标记所有计算的起始位置。指标会自动将其放置在最佳位置。红色标签(TOP)表示市场高点并带有看跌倾向。绿色标签(BOTTOM)表示市场低点并带有看涨倾向。 Sentiment Line 是一条动态曲线,反映基于成交量加权计算得出的市场情绪。
Big Player Range
Thalles Nascimento De Carvalho
5 (3)
BigPlayerRange — 适用于沪深300和美元人民币的最佳MT5指标 探索 BigPlayerRange 的强大功能,它被认为是用于 沪深300、上证指数、USD/CNH 等资产的 MetaTrader 5 最佳指标 。该工具能精准识别机构主力的关键区域,帮助交易者进行高精度的技术分析。 指标工作原理: BigPlayerRange 绘制两个水平区域,通过成交量分析反映市场能量: 绿色区域 :买方防守位置,支撑价格。 红色区域 :卖方压制位置,形成阻力。 使用策略: 收盘价突破绿色区域上方 :可能开启上涨趋势,目标为上方区间。 收盘价跌破红色区域下方 :暗示下跌压力增强,目标为下方支撑。 价格停留在区间内 :行情震荡,等待突破信号。 核心优势: 机构活动区域识别 :提前发现主力进出场信号。 自动计算的目标价格 :提供两个明确的止盈位置。 回调概率分析 :优化风险控制,提升稳定性。 参数个性化设置: 自定义交易时间与成交量类型(Tick或真实成交量)。 使用机构逻辑提升日内交易效率。 推荐搭配
Route Lines Prices MT5  - 是一款用于寻找潜在交易信号的指标。其简洁的界面包含多种价格行为算法,以及信号终点检测和已完成轨迹的计算。这些算法包括基于所用时间周期的波动率和价格平滑计算。 该指标的主要参数是“ Calculating price values ”。默认值 1 提供均衡的自动计算模式, 无需手动配置即可使用。通过手动更改 2 到 500 之间的值,您可以根据自己的交易系统自定义指标。 该指标内置市场方向指标,由两条移动平均线(快线和慢线)的交叉点表示,在确定自身趋势时可以禁用该指标。 建议在 M1 到 H4 的时间周期内使用该指标。支持所有交易品种。 信号箭头在蜡烛图收盘时生成;不会重绘历史数据。 主图表上会显示重复的箭头。该指标提供多种类型的警报。 内置信号线点计数器,用于计算从信号箭头到信号终点的收盘价。 由于指标不会重绘,信号结果的数值是在信号终点之后计算的,滞后于信号发出后一根K线。 总计数器会将接收到的值相加,以便在相应的图表上方便地调整参数。
作者的更多信息
Cross Over Trend – EMA/SMA 交叉趋势指标 Cross Over Trend 是一款适用于 MetaTrader 5 的简单而高效的技术指标,用于直观显示 指数移动平均线(EMA) 与 简单移动平均线(SMA) 之间的关系。 该指标可以帮助交易者快速识别当前市场趋势,并根据 EMA 与 SMA 的相对位置自动将市场阶段划分为 上升趋势(UpTrend) 和 下降趋势(DownTrend) 。 工作原理 指标比较 EMA 和 SMA 的当前值: EMA > SMA → UpTrend(上升趋势) EMA ≤ SMA → DownTrend(下降趋势) 当 EMA 位于 SMA 上方时,相应区域显示为 UpTrend 。 当 EMA 下穿 SMA 时,显示状态切换为 DownTrend 。 这样,无需手动比较 EMA 和 SMA,即可快速、清晰地判断当前市场方向。 主要功能 自动识别 EMA/SMA 交叉 分别显示 **UpTrend(上升趋势)**和 DownTrend(下降趋势) EMA 周期可自由设置 SMA 周期可自由设置 可选择独立的 EMA/SMA 计算
QQE Signal – 定性定量估计(QQE)指标 QQE Signal 是一款适用于 MetaTrader 5 的专业振荡器技术指标,旨在通过平滑 RSI 与动态计算的 QQE 信号线,帮助交易者识别潜在的趋势变化和市场动量变化。 该指标清晰显示 蓝色 RSI 信号线 与 黑色虚线平滑 QQE 线 之间的关系,并结合重要的 50 水平线 ,为市场方向和动量分析提供直观参考。 主要功能 QQE 信号线 蓝色线代表经过平滑处理的 RSI 信号值。 通过观察蓝色线的变化,交易者可以分析市场动量的变化以及潜在的价格方向转换。 平滑 QQE 线 黑色虚线是蓝色 QQE 信号线的动态参考线。 两条线之间的交叉可以用于识别潜在的市场动量变化。 〰️ 50 水平线 50 水平线是振荡器的重要参考位置: 高于 50 → 偏多动量 低于 50 → 偏空动量 买入信号 潜在的 BUY 买入信号 形成条件: 蓝色 QQE 线从下方向上穿过黑色虚线。 随后蓝色 QQE 线从下方向上突破 50 水平线 。 这种组合可能表示市场动量正在由偏空转向偏多。 卖出信号 潜在的 SELL 卖出信
筛选:
无评论
回复评论